List of U.S. states by African-American population
The following is a sortable table of U.S. states by the African American proportion of the population.
By 2010 census results
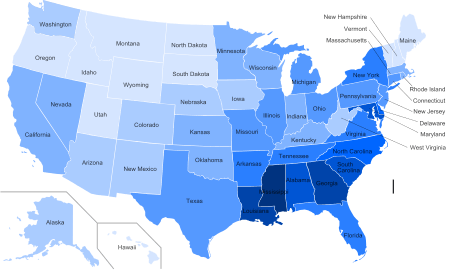
Percentage of population self-reported as African-American by state in 2010:
|
less than 2 %
2–5 %
5–10 %
10–15 %
15–20 %
|
20–25 %
25–30 %
30–35 %
35–40 %
|
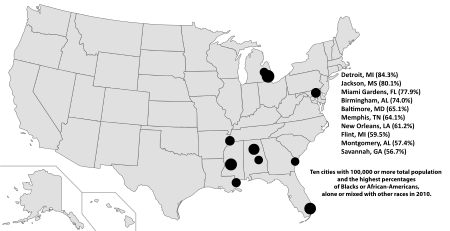
Cities with the highest percentage of Blacks or African Americans in 2010.
| Rank | State | African-American Alone Population (2010)[1] |
% African-American |
|---|---|---|---|
| 1 | District of Columbia | 305,074 | 50.08% |
| 2 | Mississippi | 1,074,200 | 37.30% |
| 3 | Louisiana | 1,506,534 | 32.4% |
| 4 | Georgia | 3,150,435 | 31.4% |
| 5 | Maryland | 1,798,593 | 30.1% |
| 6 | South Carolina | 1,290,684 | 28.48% |
| 7 | Alabama | 1,251,311 | 26.38% |
| 8 | North Carolina | 2,048,628 | 21.60% |
| 9 | Delaware | 191,814 | 20.95% |
| 10 | Virginia | 1,551,399 | 19.91% |
| 11 | Tennessee | 1,055,689 | 16.78% |
| 12 | Florida | 2,999,862 | 15.91% |
| 13 | Arkansas | 449,895 | 15.76% |
| 14 | New York | 3,073,800 | 15.18% |
| 15 | Illinois | 1,866,414 | 14.88% |
| 16 | New Jersey | 1,204,826 | 14.46% |
| 17 | Michigan | 1,400,362 | 14.24% |
| 18 | United States | 38,929,319 | 12.6 % |
| 18 | Ohio | 1,407,681 | 12.04% |
| 19 | Texas | 2,979,598 | 11.91% |
| 20 | Missouri | 704,043 | 11.49% |
| 21 | Pennsylvania | 1,377,689 | 10.79% |
| 22 | Connecticut | 362,296 | 10.34% |
| 23 | Indiana | 591,397 | 9.07% |
| 24 | Nevada | 255,633 | 9.0% |
| 25 | Kentucky | 361,273 | 8.2% |
| 26 | Massachusetts | 528,761 | 8.1% |
| 27 | Oklahoma | 277,644 | 7.96% |
| 28 | Rhode Island | 79,719 | 7.5% |
| 29 | California | 2,299,072 | 6.67% |
| 30 | Kansas | 167,864 | 6.15% |
| 31 | Wisconsin | 359,148 | 6.07% |
| 32 | Minnesota | 274,412 | 4.57% |
| 33 | Nebraska | 82,885 | 4.50% |
| 34 | Colorado | 201,737 | 4.28% |
| 35 | Alaska | 23,263 | 4.27% |
| 36 | Arizona | 259,008 | 4.16% |
| 37 | Washington | 240,042 | 3.74% |
| 38 | West Virginia | 63,124 | 3.58% |
| 39 | Hawaii | 21,424 | 3.08% |
| 40 | New Mexico | 42,550 | 2.97% |
| 41 | Iowa | 89,148 | 2.68% |
| 42 | Oregon | 69,206 | 2.01% |
| 43 | Wyoming | 4,748 | 1.29% |
| 44 | Utah | 29,287 | 1.27% |
| 45 | New Hampshire | 15,035 | 1.22% |
| 46 | South Dakota | 10,207 | 1.14% |
| 47 | North Dakota | 7,960 | 1.08% |
| 48 | Maine | 15,707 | 1.03% |
| 49 | Idaho | 9,810 | 0.95% |
| 50 | Vermont | 6,277 | 0.87% |
| 51 | Montana | 4,027 | 0.67% |
African-American proportion of state populations (1790–2010)
| State/Territory | 1790 | 1800 | 1810 | 1820 | 1830 | 1840 | 1850 | 1860 | 1870 | 1880 | 1890 | 1900 | 1910 | 1920 | 1930 | 1940 | 1950 | 1960 | 1970 | 1980 | 1990 | 2000 | 2010 |
|---|---|---|---|---|---|---|---|---|---|---|---|---|---|---|---|---|---|---|---|---|---|---|---|
| 19.3% | 18.9% | 19.0% | 18.4% | 18.1% | 16.8% | 15.7% | 14.1% | 12.7% | 13.1% | 11.9% | 11.6% | 10.7% | 9.9% | 9.7% | 9.8% | 10.0% | 10.5% | 11.1% | 11.7% | 12.1% | 12.3% | 12.6% | |
| 41.4% | 29.0% | 33.2% | 38.5% | 43.3% | 44.7% | 45.4% | 47.7% | 47.5% | 44.8% | 45.2% | 42.5% | 38.4% | 35.7% | 34.7% | 32.0% | 30.0% | 26.2% | 25.6% | 25.3% | 26.0% | 26.2% | ||
| 0.3% | 0.3% | 0.2% | 0.2% | 0.2% | 3.0% | 3.0% | 3.4% | 4.1% | 3.5% | 3.3% | |||||||||||||
| 0.3% | 0.3% | 0.4% | 1.5% | 1.5% | 1.0% | 2.4% | 2.5% | 3.0% | 3.5% | 3.3% | 3.0% | 2.8% | 3.0% | 3.1% | 4.1% | ||||||||
| 13.0% | 11.7% | 15.5% | 20.9% | 22.7% | 25.6% | 25.2% | 26.3% | 27.4% | 28.0% | 28.1% | 27.0% | 25.8% | 24.8% | 22.3% | 21.8% | 18.3% | 16.3% | 15.9% | 15.7% | 15.4% | |||
| 1.0% | 1.1% | 0.8% | 0.7% | 0.9% | 0.7% | 0.9% | 1.1% | 1.4% | 1.8% | 4.4% | 5.6% | 7.0% | 7.7% | 7.4% | 6.7% | 6.2% | |||||||
| 0.1% | 1.1% | 1.3% | 1.5% | 1.6% | 1.4% | 1.2% | 1.1% | 1.1% | 1.5% | 2.3% | 3.0% | 3.5% | 4.0% | 3.8% | 4.0% | ||||||||
| 2.3% | 2.5% | 2.6% | 2.9% | 2.7% | 2.6% | 2.1% | 1.9% | 1.8% | 1.9% | 1.6% | 1.7% | 1.4% | 1.5% | 1.8% | 1.9% | 2.7% | 4.2% | 6.0% | 7.0% | 8.3% | 9.1% | 10.1% | |
| 21.6% | 22.4% | 23.8% | 24.0% | 24.9% | 25.0% | 22.2% | 19.3% | 18.2% | 18.0% | 16.8% | 16.6% | 15.4% | 13.6% | 13.7% | 13.5% | 13.7% | 13.6% | 14.3% | 16.1% | 16.9% | 19.2% | 21.4% | |
| 30.4% | 33.1% | 31.2% | 30.1% | 29.1% | 26.6% | 19.1% | 33.0% | 33.6% | 32.8% | 31.1% | 28.5% | 25.1% | 27.1% | 28.2% | 35.0% | 53.9% | 71.1% | 70.3% | 65.8% | 60.0% | 50.7% | ||
| 47.1% | 48.7% | 46.0% | 44.6% | 48.8% | 47.0% | 42.5% | 43.7% | 41.0% | 34.0% | 29.4% | 27.1% | 21.8% | 17.8% | 15.3% | 13.8% | 13.6% | 14.6% | 16.0% | |||||
| 35.9% | 37.1% | 42.5% | 44.4% | 42.6% | 41.0% | 42.4% | 44.0% | 46.0% | 47.0% | 46.7% | 46.7% | 45.1% | 41.7% | 36.8% | 34.7% | 30.9% | 28.5% | 25.9% | 26.8% | 27.0% | 28.7% | 30.5% | |
| 0.2% | 0.4% | 0.1% | 0.2% | 0.1% | 0.5% | 0.8% | 1.0% | 1.8% | 2.5% | 1.8% | 1.6% | ||||||||||||
| 0.4% | 0.2% | 0.2% | 0.2% | 0.2% | 0.2% | 0.2% | 0.1% | 0.2% | 0.2% | 0.3% | 0.3% | 0.3% | 0.4% | 0.6% | |||||||||
| 7.4% | 6.4% | 2.5% | 1.5% | 0.8% | 0.6% | 0.4% | 1.1% | 1.5% | 1.5% | 1.8% | 1.9% | 2.8% | 4.3% | 4.9% | 7.4% | 10.3% | 12.8% | 14.7% | 14.8% | 15.1% | 14.5% | ||
| 4.4% | 2.6% | 1.0% | 1.1% | 1.0% | 1.1% | 0.8% | 1.5% | 2.0% | 2.1% | 2.3% | 2.2% | 2.8% | 3.5% | 3.6% | 4.4% | 5.8% | 6.9% | 7.6% | 7.8% | 8.4% | 9.1% | ||
| 0.4% | 0.2% | 0.2% | 0.5% | 0.6% | 0.6% | 0.6% | 0.7% | 0.8% | 0.7% | 0.7% | 0.8% | 0.9% | 1.2% | 1.4% | 1.7% | 2.1% | 2.9% | ||||||
| 0.6% | 4.7% | 4.3% | 3.5% | 3.5% | 3.2% | 3.3% | 3.5% | 3.6% | 3.8% | 4.2% | 4.8% | 5.3% | 5.8% | 5.7% | 5.9% | ||||||||
| 17.0% | 18.6% | 20.2% | 22.9% | 24.7% | 24.3% | 22.5% | 20.4% | 16.8% | 16.5% | 14.4% | 13.3% | 11.4% | 9.8% | 8.6% | 7.5% | 6.9% | 7.1% | 7.2% | 7.1% | 7.1% | 7.3% | 7.8% | |
| 55.2% | 51.8% | 58.5% | 55.0% | 50.7% | 49.5% | 50.1% | 51.5% | 50.0% | 47.1% | 43.1% | 38.9% | 36.9% | 35.9% | 32.9% | 31.9% | 29.8% | 29.4% | 30.8% | 32.5% | 32.0% | |||
| 0.6% | 0.5% | 0.4% | 0.3% | 0.3% | 0.3% | 0.2% | 0.2% | 0.3% | 0.2% | 0.2% | 0.2% | 0.2% | 0.2% | 0.1% | 0.2% | 0.1% | 0.3% | 0.3% | 0.3% | 0.4% | 0.5% | 1.2% | |
| 34.7% | 36.7% | 38.2% | 36.1% | 34.9% | 32.3% | 28.3% | 24.9% | 22.5% | 22.5% | 20.7% | 19.8% | 17.9% | 16.9% | 16.9% | 16.6% | 16.5% | 16.7% | 17.8% | 22.7% | 24.9% | 27.9% | 29.4% | |
| 1.4% | 1.5% | 1.4% | 1.3% | 1.2% | 1.2% | 0.9% | 0.8% | 1.0% | 1.0% | 1.0% | 1.1% | 1.1% | 1.2% | 1.2% | 1.3% | 1.6% | 2.2% | 3.1% | 3.9% | 5.0% | 5.4% | 7.9% | |
| 3.7% | 3.0% | 2.1% | 0.8% | 0.3% | 0.6% | 0.9% | 1.0% | 0.9% | 0.7% | 0.7% | 0.6% | 1.6% | 3.5% | 4.0% | 6.9% | 9.2% | 11.2% | 12.9% | 13.9% | 14.2% | 14.2% | ||
| 0.6% | 0.2% | 0.2% | 0.2% | 0.3% | 0.3% | 0.3% | 0.4% | 0.4% | 0.4% | 0.5% | 0.7% | 0.9% | 1.3% | 2.2% | 3.5% | 5.2% | |||||||
| 41.5% | 47.0% | 44.1% | 48.4% | 52.3% | 51.2% | 55.3% | 53.7% | 57.5% | 57.6% | 58.5% | 56.2% | 52.2% | 50.2% | 49.2% | 45.3% | 42.0% | 36.8% | 35.2% | 35.6% | 36.3% | 37.0% | ||
| 17.6% | 15.9% | 18.3% | 15.6% | 13.2% | 10.0% | 6.9% | 6.7% | 5.6% | 5.2% | 4.8% | 5.2% | 6.2% | 6.5% | 7.5% | 9.0% | 10.3% | 10.5% | 10.7% | 11.2% | 11.6% | |||
| 0.9% | 0.9% | 1.0% | 0.6% | 0.2% | 0.3% | 0.2% | 0.2% | 0.2% | 0.2% | 0.3% | 0.2% | 0.3% | 0.3% | 0.4% | |||||||||
| 0.3% | 0.6% | 0.5% | 0.8% | 0.6% | 0.6% | 1.0% | 1.0% | 1.1% | 1.5% | 2.1% | 2.7% | 3.1% | 3.6% | 4.0% | 4.5% | ||||||||
| 0.7% | 0.8% | 0.8% | 0.5% | 0.3% | 0.6% | 0.4% | 0.6% | 0.6% | 2.7% | 4.7% | 5.7% | 6.4% | 6.6% | 6.8% | 8.1% | ||||||||
| 0.6% | 0.5% | 0.5% | 0.3% | 0.2% | 0.2% | 0.2% | 0.2% | 0.2% | 0.2% | 0.2% | 0.2% | 0.1% | 0.1% | 0.2% | 0.1% | 0.1% | 0.3% | 0.3% | 0.4% | 0.6% | 0.7% | 1.1% | |
| 7.7% | 8.0% | 7.6% | 7.2% | 6.4% | 5.8% | 4.9% | 3.8% | 3.4% | 3.4% | 3.3% | 3.7% | 3.5% | 3.7% | 5.2% | 5.5% | 6.6% | 8.5% | 10.7% | 12.6% | 13.4% | 13.6% | 13.7% | |
| 0.0% | 0.1% | 0.2% | 0.8% | 1.2% | 0.8% | 0.5% | 1.6% | 0.7% | 0.9% | 1.2% | 1.8% | 1.9% | 1.8% | 2.0% | 1.9% | 2.1% | |||||||
| 7.6% | 5.3% | 4.2% | 2.9% | 2.3% | 2.1% | 1.6% | 1.3% | 1.2% | 1.3% | 1.2% | 1.4% | 1.5% | 1.9% | 3.3% | 4.2% | 6.2% | 8.4% | 11.9% | 13.7% | 15.9% | 15.9% | 17.5% | |
| 26.8% | 29.4% | 32.2% | 34.4% | 35.9% | 35.6% | 36.4% | 36.4% | 36.6% | 38.0% | 34.7% | 33.0% | 31.6% | 29.8% | 29.0% | 27.5% | 25.8% | 24.5% | 22.2% | 22.4% | 22.0% | 21.6% | 21.5% | |
| 1.0% | 0.3% | 0.2% | 0.1% | 0.1% | 0.1% | 0.1% | 0.0% | 0.0% | 0.1% | 0.4% | 0.4% | 0.6% | 0.6% | 1.2% | |||||||||
| 0.5% | 0.8% | 0.8% | 1.0% | 1.1% | 1.3% | 1.6% | 2.4% | 2.5% | 2.4% | 2.3% | 2.3% | 3.2% | 4.7% | 4.9% | 6.5% | 8.1% | 9.1% | 10.0% | 10.6% | 11.5% | 12.2% | ||
| 8.4% | 7.0% | 8.3% | 7.4% | 7.2% | 7.2% | 6.5% | 6.6% | 6.7% | 6.8% | 7.4% | 7.6% | 7.4% | |||||||||||
| 0.5% | 0.2% | 0.4% | 0.3% | 0.4% | 0.3% | 0.2% | 0.3% | 0.2% | 0.2% | 0.8% | 1.0% | 1.3% | 1.4% | 1.6% | 1.6% | 1.8% | |||||||
| 2.4% | 2.7% | 2.9% | 2.9% | 2.8% | 2.8% | 2.3% | 2.0% | 1.9% | 2.0% | 2.0% | 2.5% | 2.5% | 3.3% | 4.5% | 4.7% | 6.1% | 7.5% | 8.6% | 8.8% | 9.2% | 10.0% | 10.8% | |
| 6.3% | 5.3% | 4.8% | 4.3% | 3.7% | 3.0% | 2.5% | 2.3% | 2.3% | 2.3% | 2.1% | 2.1% | 1.8% | 1.7% | 1.4% | 1.5% | 1.8% | 2.1% | 2.7% | 2.9% | 3.9% | 4.5% | 5.7% | |
| 43.7% | 43.2% | 48.4% | 52.8% | 55.6% | 56.4% | 58.9% | 58.6% | 58.9% | 60.7% | 59.8% | 58.4% | 55.2% | 51.4% | 45.6% | 42.9% | 38.8% | 34.8% | 30.5% | 30.4% | 29.8% | 29.5% | 27.9% | |
| 0.0% | 0.6% | 0.3% | 0.2% | 0.1% | 0.1% | 0.1% | 0.1% | 0.1% | 0.1% | 0.2% | 0.2% | 0.3% | 0.5% | 0.6% | 1.3% | ||||||||
| 10.6% | 13.2% | 17.5% | 19.6% | 21.4% | 22.7% | 24.5% | 25.5% | 25.6% | 26.1% | 24.4% | 23.8% | 21.7% | 19.3% | 18.3% | 17.4% | 16.1% | 16.5% | 15.8% | 15.8% | 16.0% | 16.4% | 16.7% | |
| 27.5% | 30.3% | 31.0% | 24.7% | 21.8% | 20.4% | 17.7% | 15.9% | 14.7% | 14.4% | 12.7% | 12.4% | 12.5% | 12.0% | 11.9% | 11.5% | 11.8% | |||||||
| 0.4% | 0.1% | 0.1% | 0.2% | 0.3% | 0.2% | 0.3% | 0.3% | 0.2% | 0.2% | 0.4% | 0.5% | 0.6% | 0.6% | 0.7% | 0.8% | 1.1% | |||||||
| 0.3% | 0.4% | 0.3% | 0.4% | 0.3% | 0.3% | 0.2% | 0.2% | 0.3% | 0.3% | 0.3% | 0.2% | 0.5% | 0.2% | 0.2% | 0.1% | 0.1% | 0.1% | 0.2% | 0.2% | 0.3% | 0.5% | 1.0% | |
| 43.4% | 44.6% | 47.1% | 47.8% | 47.9% | 46.9% | 45.0% | 43.3% | 41.9% | 41.8% | 38.4% | 35.6% | 32.6% | 29.9% | 26.8% | 24.7% | 22.1% | 20.6% | 18.5% | 18.9% | 18.8% | 19.6% | 19.4% | |
| 12.7% | 0.3% | 0.9% | 0.4% | 0.4% | 0.5% | 0.5% | 0.5% | 0.4% | 0.4% | 1.3% | 1.7% | 2.1% | 2.6% | 3.1% | 3.2% | 3.6% | |||||||
| 9.5% | 9.8% | 11.5% | 12.1% | 11.2% | 9.6% | 7.8% | 5.6% | 4.1% | 4.2% | 4.3% | 4.5% | 5.3% | 5.9% | 6.6% | 6.2% | 5.7% | 4.8% | 3.9% | 3.3% | 3.1% | 3.2% | 3.4% | |
| 1.2% | 1.8% | 0.6% | 0.2% | 0.2% | 0.2% | 0.2% | 0.1% | 0.1% | 0.1% | 0.2% | 0.4% | 0.4% | 0.8% | 1.9% | 2.9% | 3.9% | 5.0% | 5.7% | 6.3% | ||||
| 2.0% | 1.4% | 1.5% | 1.0% | 1.5% | 0.7% | 0.6% | 0.4% | 0.9% | 0.7% | 0.8% | 0.7% | 0.8% | 0.8% | 0.8% | |||||||||
| 8.0% | 12.4% |
See also
- Black Belt (U.S. region)
- African American neighborhoods
- List of African American neighborhoods
- List of U.S. cities with large African-American populations
References
- ↑ U.S. Census Bureau (2011). "2010 Census Interactive Population Search". Retrieved 2011-06-24.
- ↑ "Historical Census Statistics on Population Totals By Race, 1790 to 1990, and By Hispanic Origin, 1970 to 1990, For The United States, Regions, Divisions, and States". Census.gov. Retrieved September 15, 2012.
- ↑ "Powered by Google Docs" (PDF). Docs.google.com. Retrieved September 15, 2012.
- ↑ "Powered by Google Docs" (PDF). Docs.google.com. Retrieved September 15, 2012.
| Demographics | |
|---|---|
| Economy | |
| Environment | |
| Geography | |
| Government | |
| Health | |
| History | |
| Law | |
| Miscellaneous | |
| |
This article is issued from Wikipedia - version of the 11/13/2016. The text is available under the Creative Commons Attribution/Share Alike but additional terms may apply for the media files.