List of U.S. states by educational attainment
This article presents a list of U.S. states sorted by educational attainment. This table is an estimation based on the responses to the American Community Survey. This survey is a large demographic survey collected throughout the year using mailed questionnaires, telephone interviews, and visits from Census Bureau field representatives to about 3.5 million household addresses annually, regardless of their legal immigration status.
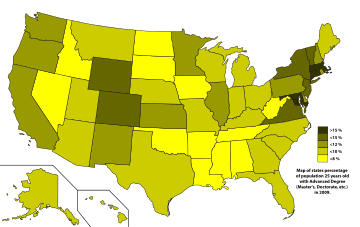
Map of states percentage of population 25 years old with Advanced Degree in 2009.

Map of states percentage of population 25 years old with Bachelor's Degree or Higher in 2009.
| Education in the United States |
|---|
|
|
| State | % High school graduate | Rank | % Bachelor's degree | Rank | % Advanced degree | Rank |
|---|---|---|---|---|---|---|
| Wyoming | 91.8% | 1 | 23.8% | 40 | 7.9% | 38 |
| Minnesota | 91.7% | 2 | 31.5% | 10 | 10.3% | 17 |
| Alaska | 91.4% | 3 | 26.6% | 24 | 9.0% | 27 |
| New Hampshire | 91.3% | 5 | 32.0% | 9 | 11.2% | 12 |
| Vermont | 91.0% | 6 | 33.1% | 7 | 13.3% | 6 |
| Montana | 90.8% | 7 | 27.4% | 21 | 8.3% | 36 |
| Iowa | 91.4% | 3 | 25.1% | 34 | 7.4% | 43 |
| Hawaii | 90.4% | 8 | 29.6% | 15 | 9.9% | 20 |
| Utah | 90.4% | 8 | 28.5% | 19 | 9.1% | 26 |
| Maine | 90.2% | 10 | 26.9% | 23 | 9.6% | 22 |
| North Dakota | 90.1% | 11 | 25.8% | 27 | 6.7% | 48 |
| South Dakota | 89.9% | 12 | 25.1% | 34 | 7.3% | 45 |
| Nebraska | 89.8% | 13 | 27.4% | 21 | 8.8% | 29 |
| Wisconsin | 89.8% | 13 | 25.7% | 28 | 8.4% | 34 |
| Kansas | 89.7% | 15 | 29.5% | 16 | 10.2% | 18 |
| Washington | 89.7% | 15 | 31.0% | 11 | 11.1% | 13 |
| Colorado | 89.3% | 17 | 35.9% | 3 | 12.7% | 8 |
| Oregon | 89.1% | 18 | 29.2% | 17 | 10.4% | 15 |
| Massachusetts | 89.0% | 19 | 38.2% | 1 | 16.4% | 1 |
| Maryland | 89.0% | 19 | 37.3% | 2 | 16.0% | 2 |
| Connecticut | 88.6% | 21 | 35.6% | 4 | 15.5% | 3 |
| Idaho | 88.4% | 22 | 23.9% | 39 | 7.5% | 42 |
| Michigan | 87.9% | 23 | 24.6% | 36 | 9.4% | 24 |
| Pennsylvania | 87.9% | 23 | 26.4% | 26 | 10.2% | 18 |
| Ohio | 87.6% | 25 | 24.1% | 38 | 8.8% | 29 |
| Delaware | 87.4% | 26 | 28.7% | 18 | 11.4% | 11 |
| New Jersey | 87.4% | 27 | 34.5% | 5 | 12.9% | 7 |
| District of Columbia | 87.1% | 48.5% | 28.0% | |||
| Missouri | 86.8% | 28 | 25.2% | 33 | 9.5% | 23 |
| Indiana | 86.6% | 29 | 22.5% | 43 | 8.1% | 37 |
| Virginia | 86.6% | 29 | 34.0% | 6 | 14.1% | 4 |
| Illinois | 86.4% | 31 | 30.6% | 12 | 11.7% | 9 |
| Oklahoma | 85.6% | 32 | 22.7% | 42 | 7.4% | 43 |
| United States | 85.3% | 27.9% | 10.3% | |||
| Florida | 85.3% | 33 | 25.3% | 31 | 9.0% | 27 |
| New York | 84.7% | 34 | 32.4% | 8 | 14.0% | 5 |
| Rhode Island | 84.7% | 34 | 30.5% | 13 | 11.7% | 9 |
| North Carolina | 84.3% | 36 | 26.5% | 25 | 8.8% | 29 |
| Arizona | 84.2% | 37 | 25.6% | 29 | 9.3% | 25 |
| Georgia | 83.9% | 38 | 27.5% | 20 | 9.9% | 20 |
| Nevada | 83.9% | 38 | 21.8% | 45 | 7.6% | 41 |
| South Carolina | 83.6% | 40 | 24.3% | 37 | 8.4% | 34 |
| Tennessee | 83.1% | 41 | 23.0% | 41 | 7.9% | 38 |
| New Mexico | 82.8% | 42 | 25.3% | 31 | 10.4% | 15 |
| West Virginia | 82.8% | 42 | 17.3% | 50 | 6.7% | 48 |
| Arkansas | 82.4% | 44 | 18.9% | 49 | 6.1% | 50 |
| Louisiana | 82.2% | 45 | 21.4% | 46 | 6.9% | 47 |
| Alabama | 82.1% | 46 | 22.0% | 44 | 7.7% | 40 |
| Kentucky | 81.7% | 47 | 21.0% | 47 | 8.5% | 32 |
| California | 80.6% | 48 | 29.9% | 14 | 10.7% | 14 |
| Mississippi | 80.4% | 49 | 19.6% | 48 | 7.1% | 46 |
| Texas | 79.9% | 50 | 25.5% | 30 | 8.5% | 32 |
References
- ↑ "Table 233. Educational Attainment by State". United States Census Bureau. 2011. Archived from the original on February 21, 2012. Retrieved 2014-05-23.
- ↑ "Educational Attainment in the United States: 2009" (PDF). United States Census Bureau. 2012. Retrieved 2016-01-09.
- ↑ "High school graduate or higher, percent of persons age 25 years+, 2010-2014". www.census.gov. Retrieved 2016-06-11.
External links
| Demographics | |
|---|---|
| Economy | |
| Environment | |
| Geography | |
| Government | |
| Health | |
| History | |
| Law | |
| Miscellaneous | |
| |
This article is issued from Wikipedia - version of the 11/28/2016. The text is available under the Creative Commons Attribution/Share Alike but additional terms may apply for the media files.