List of Polish voivodeships by GDP per capita
The GDP per capita (in Euros) across Polish voivodeships, with the statistics shown being for 2011 and 2013 income levels.[1]
Voivodeships
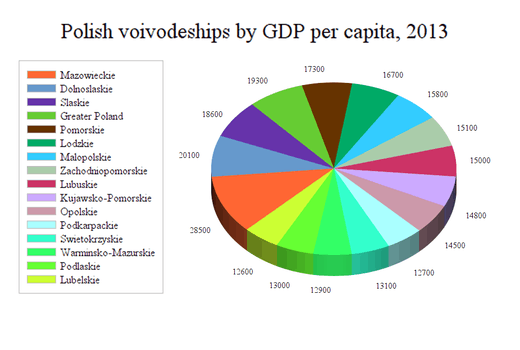
Polish voivodeships by GDP per capita, 2013
Voivodeship 2011 2013 Mazowieckie 26,300 28,500 Dolnoslaskie 19,000 20,100 Greater Poland 17,500 19,300 Slaskie 17,900 18,600 Polish Average 16,650 Pomorskie 16,000 17,300 Lodzkie 15,400 16,700 Malopolskie 14,800 15,800 Zachodniopomorskie 14,000 15,100 Lubuskie 13,900 15,000 Kujawsko-Pomorskie 13,600 14,800 Opolskie 13,600 14,500 Podkarpackie 11,700 12,700 Swietokrzyskie 12,700 13,100 Warminsko-Mazurskie 12,000 12,900 Podlaskie 12,200 13,000 Lubelskie 11,600 12,600
See also
References
Poland articles | |||||||
|---|---|---|---|---|---|---|---|
| History |  | ||||||
| Geography | |||||||
| Politics | |||||||
| Economy | |||||||
| Society |
| ||||||
| |||||||
This article is issued from Wikipedia - version of the 8/14/2016. The text is available under the Creative Commons Attribution/Share Alike but additional terms may apply for the media files.