List of Parliamentary constituencies in the West Midlands (county)
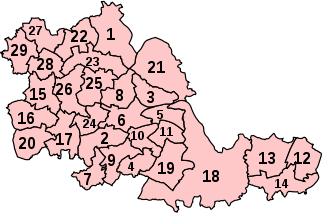
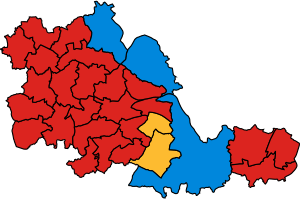
The ceremonial county of West Midlands, England is divided into 28 parliamentary constituencies, each of which elect one Member of Parliament (MP) to the House of Commons. These constituencies were first implemented at the 2010 general election. All are borough constituencies except for Meriden, which is a county constituency.
At the 1997, 2001 and 2005 elections, the West Midlands was divided into 29 Parliamentary constituencies.
| Name | 1997-2010 boundaries | Name |
- Aldridge-Brownhills BC
- Birmingham, Edgbaston BC
- Birmingham, Erdington BC
- Birmingham, Hall Green BC
- Birmingham, Hodge Hill BC
- Birmingham, Ladywood BC
- Birmingham, Northfield BC
- Birmingham, Perry Barr BC
- Birmingham, Selly Oak BC
- Birmingham, Sparkbrook and Small Heath BC
- Birmingham, Yardley BC
- Coventry North East BC
- Coventry North West BC
- Coventry South BC
|
|
- Dudley North BC
- Dudley South BC
- Halesowen and Rowley Regis BC
- Meriden CC
- Solihull BC
- Stourbridge BC
- Sutton Coldfield BC
- Walsall North BC
- Walsall South BC
- Warley BC
- West Bromwich East BC
- West Bromwich West BC
- Wolverhampton North East BC
- Wolverhampton South East BC
- Wolverhampton South West BC
|
|
Results
† Conservative
‡ Labour
¤ Liberal Democrat
| Constituency[nb 1] |
Electorate |
Majority[nb 2] |
Member of Parliament |
Nearest opposition |
Electoral wards[1][2] |
Map |
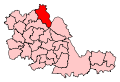
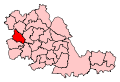
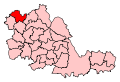
| Aldridge-Brownhills BC |
60,215 |
11,723 |
|
Wendy Morton† |
|
John Fisher‡ |
|
|
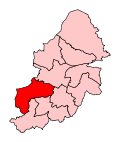
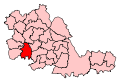
| Birmingham, Edgbaston BC |
65,591 |
2,706 |
|
Gisela Stuart‡ |
|
Luke Evans† |
|
|
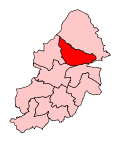
| Birmingham, Erdington BC |
65,128 |
5,129 |
|
Jack Dromey‡ |
|
Robert Alden† |
|
|
| Birmingham, Hall Green BC |
76,330 |
19,818 |
|
Roger Godsiff‡ |
|
James Bird† |
|
|
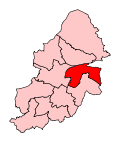
| Birmingham, Hodge Hill BC |
75,302 |
23,362 |
|
Liam Byrne‡ |
|
Kieran Mullan† |
|
|
| Birmingham, Ladywood BC |
68,128 |
21,868 |
|
Shabana Mahmood‡ |
|
Isabel Sigmac† |
|
|
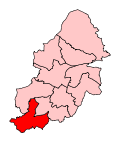
| Birmingham, Northfield BC |
71,428 |
2,509 |
|
Richard Burden‡ |
|
Rachel Maclean† |
|
|
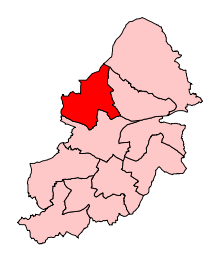
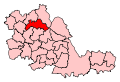
| Birmingham, Perry Barr BC |
69,943 |
14,828 |
|
Khalid Mahmood‡ |
|
Charlotte Hodivala† |
|
|
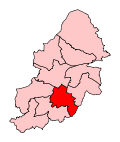
| Birmingham, Selly Oak BC |
75,092 |
8,447 |
|
Steve McCabe‡ |
|
Alex Boulter† |
|
|
| Birmingham, Yardley BC |
72,146 |
6,595 |
|
Jess Phillips‡ |
|
John Hemming¤ |
|
|
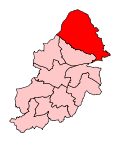
| Coventry North East BC |
75,462 |
12,274 |
|
Colleen Fletcher‡ |
|
Michelle Lowe† |
|
|
| Coventry North West BC |
73,626 |
4,509 |
|
Geoffrey Robinson‡ |
|
Parvez Akhtar† |
|
|
| Coventry South BC |
70,397 |
3,188 |
|
Jim Cunningham‡ |
|
Gary Ridley† |
|
|
| Dudley North BC |
60,718 |
4,181 |
|
Ian Austin‡ |
|
Les Jones† |
|
|
| Dudley South BC |
60,363 |
4,270 |
|
Mike Wood† |
|
Natasha Millward‡ |
|
|
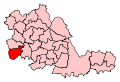
| Halesowen and Rowley Regis BC |
67,809 |
3,082 |
|
James Morris† |
|
Stephanie Peacock‡ |
|
|
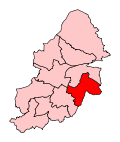
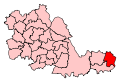
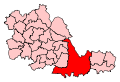
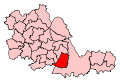
| Meriden CC |
81,928 |
18,795 |
|
Caroline Spelman† |
|
Tom McNeil‡ |
|
|
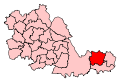
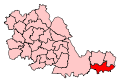
| Solihull BC |
77,956 |
12,902 |
|
Julian Knight (politician)† |
|
Lorely Burt¤ |
|
|
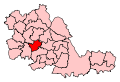
| Stourbridge BC |
69,077 |
6,694 |
|
Margot James† |
|
Pete Lowe‡ |
|
|
| Sutton Coldfield BC |
74,956 |
16,417 |
|
Andrew Mitchell† |
|
Robert Pocock‡ |
|
|
| Walsall North BC |
67,080 |
1,937 |
|
David Winnick‡ |
|
Douglas Hansen-Luke† |
|
|
| Walsall South BC |
67,743 |
6,007 |
|
Valerie Vaz‡ |
|
Sue Arnold† |
|
|
| Warley BC |
63,738 |
14,702 |
|
John Spellar‡ |
|
Tom Williams† |
|
|
| West Bromwich East BC |
63,637 |
9,470 |
|
Tom Watson‡ |
|
Olivia Seccombe† |
|
|
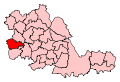
| West Bromwich West BC |
65,524 |
7,742 |
|
Adrian Bailey‡ |
|
Graham Eardley |
|
|
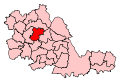
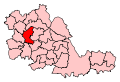
| Wolverhampton North East BC |
61,065 |
5,495 |
|
Emma Reynolds‡ |
|
Darren Henry† |
|
|
| Wolverhampton South East BC |
62,556 |
10,778 |
|
Pat McFadden‡ |
|
Suria Photay† |
|
|
| Wolverhampton South West BC |
60,368 |
801 |
|
Rob Marris‡ |
|
Paul Uppal† |
|
|
|
Party breakdown
References
- ↑ BC denotes borough constituency, CC denotes county constituency.
- ↑ The majority is the number of votes the winning candidate receives more than their nearest rival.