List of Parliamentary constituencies in Cornwall
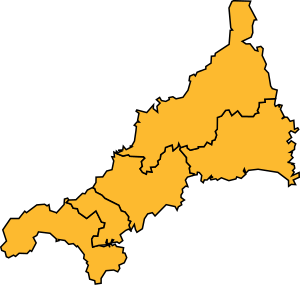
The ceremonial county of Cornwall, which includes the Isles of Scilly, is divided into six Parliamentary constituencies. They are all County constituencies.
Parliamentary history of Cornwall
For information on historical constituencies in Cornwall, see Parliamentary representation from Cornwall.
Constituencies
† Conservative ‡ Labour ¤ Liberal Democrat
| Constituency | Electorate[1] | Majority[nb 1] | Member of Parliament | 2nd-placed candidate | Electoral wards[2][3] | Map | ||
|---|---|---|---|---|---|---|---|---|
| Camborne and Redruth | 66,944 | 7,004 | George Eustice† | Michael Foster‡ | Carrick District Council: Mount Hawke. Kerrier District Council: Camborne North, Camborne South, Camborne West, Constantine, Gweek and Mawnan, Illogan North, Illogan South, Mabe and Budock, Redruth North, Redruth South, St Day, Lanner and Carharrack, Stithians, Wendron. Penwith District Council: Gwinear, Gwithian and Hayle East, Hayle North, Hayle South. | 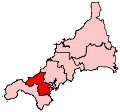 | ||
| North Cornwall | 67,192 | 6,621 | Scott Mann† | Dan Rogerson¤ | North Cornwall District Council: Allan, Altarnun, Blisland and St Breward, Bodmin St Mary's, Bodmin St Petroc, Bude, Camelford, Camelot, Grenville, Lanivet, Launceston, Marhamchurch, North Petherwin, Padstow and District, Poughill and Stratton, St Endellion and St Kew, St Minver, South Petherwin, Stokeclimsland, Tremaine, Valency, Wadebridge, Week St Mary and Whitstone. | 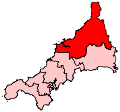 | ||
| St Austell and Newquay | 76,607 | 8,173 | Steve Double† | Steve Gilbert¤ | Restormel Borough Council: Bethel, Crinnis, Edgcumbe North, Edgcumbe South, Fowey and Tywardreath, Gannel, Gover, Mevagissey, Mount Charles, Poltair, Rialton, Rock, St Blaise, St Columb, St Enoder, St Ewe, St Stephen, Treverbyn. | 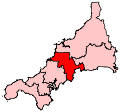 | ||
| St Ives | 67,282 | 2,469 | Derek Thomas† | Andrew George¤ | Kerrier District Council: Breage and Crowan, Grade-Ruan and Landewednack, Helston North, Helston South, Meneage, Mullion, Porthleven and Sithney, St Keverne. Penwith District Council: Goldsithney, Gulval and Heamoor, Lelant and Carbis Bay, Ludgvan and Towednack, Madron and Zennor, Marazion and Perranuthnoe, Morvah, Pendeen and St Just, Penzance Central, Penzance East, Penzance Promenade, Penzance South,
St Buryan, St Erth and St Hilary, St Ives North, St Ives South. Isles of Scilly. |
 | ||
| South East Cornwall | 71,071 | 16,995 | Sheryll Murray† | Phil Hutty¤ | Caradon District Council: Callington, Calstock, Deviock and Sheviock, Dobwalls and District, Duloe, Lansallos and Pelynt, Landrake and St Dominick, Lanteglos and St Veep, Liskeard North, Liskeard South, Looe and St Martin, Lynher, Menheniot and St Ive, Millbrook, Rame Peninsula, St Cleer and St Neot, St Germans, Saltash Burraton, Saltash Essa, Saltash Pill, Saltash St Stephens, Torpoint East, Torpoint West. Restormel Borough Council: Lostwithiel. | 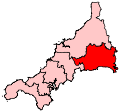 | ||
| Truro and Falmouth | 73,601 | 14,000 | Sarah Newton† | Simon Rix¤ | Carrick District Council: Arwenack, Boscawen, Boslowick, Carland, Feock and Kea, Kenwyn and Chacewater, Moresk, Mylor, Newlyn and Goonhavern, Penryn, Penwerris, Perranporth, Probus, Roseland, St Agnes, Tregolls, Trehaverne and Gloweth, Trescobeas. | 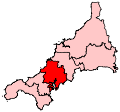 | ||
Results
| 1983 | 1987 | 1992 | 1997 |
|---|---|---|---|
 |
|
 |
 |
| 2001 | 2005 | 2010 | 2015 |
| |
 |
 |
 |
Party breakdown
| Year | Conservative Party[4] | Labour Party | Liberal Democrats[5] | Total |
|---|---|---|---|---|
| 2015 | 6 (100%) | 0 (0%) | 0 (0%) | 6 |
| 2010 | 3 (50%) | 0 (0%) | 3 (50%) | 6 |
| 2005 | 0 (0%) | 0 (0%) | 5 (100%) | 5 |
| 2001 | 0 (0%) | 1 (20%) | 4 (80%) | 5 |
| 1997 | 0 (0%) | 1 (20%) | 4 (80%) | 5 |
| 1992 | 3 (60%) | 0 (0%) | 2 (40%) | 5 |
| 1987 | 4 (80%) | 0 (0%) | 1 (20%) | 5 |
| 1983 | 4 (80%) | 0 (0%) | 1 (20%) | 5 |
| 1979 | 4 (80%) | 0 (0%) | 1 (20%) | 5 |
| 1974 (Oct) | 3 (60%) | 0 (20%) | 2 (40%) | 5 |
| 1974 (Feb) | 3 (60%) | 0 (20%) | 2 (40%) | 5 |
| 1970 | 4 (80%) | 0 (0%) | 1 (20%) | 5 |
| 1966 | 2 (40%) | 1 (20%) | 2 (40%) | 5 |
| 1964 | 3 (60%) | 1 (20%) | 1 (20%) | 5 |
| 1959 | 4 (80%) | 1 (20%) | 0 (0%) | 5 |
| 1955 | 4 (80%) | 1 (20%) | 0 (0%) | 5 |
| 1951 | 4 (80%) | 1 (20%) | 0 (0%) | 5 |
| 1950 | 4 (80%) | 1 (20%) | 0 (0%) | 5 |
| 1945 | 3 | 1 | 1 | 5 |
| 1935 | 4 | 0 | 1 | 5 |
| 1931 | 3 | 0 | 2 | 5 |
| 1929 | 5 | |||
| 1924 | 5 | |||
| 1923 | 5 | |||
| 1922 | 5 | |||
| 1918 | 5 | |||
Historical results by party
1885 to 1918 (7 MPs)
| Constituency | 1885 | 1886 | 87 | 1892 | 1895 | 98 | 1900 | 03 | 04 | 1906 | 06 | 08 | Jan 1910 | Dec 1910 | 15 | 16 |
|---|---|---|---|---|---|---|---|---|---|---|---|---|---|---|---|---|
| Bodmin | Courtney | --> | Molesworth | Agar-Robartes | Freeman-Thomas | Grenfell | Pole-Carew | Hanson | ||||||||
| Camborne | Conybeare | Strauss | Caine | Lawson | Dunn | Dyke Acland | ||||||||||
| Launceston | Dyke-Acland | Owen | Moulton | Marks | ||||||||||||
| Penryn and Falmouth | Jenkins | Cavendish-Bentinck | Horniman | Barker | Goldman | |||||||||||
| St Austell | Borlase | McArthur | Agar-Robartes | Layland-Barratt | ||||||||||||
| St Ives | St Aubyn | --> | Bolitho | Hain | --> | Cory | ||||||||||
| Truro | Bickford-Smith | --> | Williams | Durning-Lawrence | Morgan | |||||||||||
1918 to 1950 (5 MPs)
| Constituency | 1918 | 1922 | 1923 | 1924 | 28 | 1929 | 1931 | 32 | 1935 | 37 | 39 | 41 | 1945 | 47 |
|---|---|---|---|---|---|---|---|---|---|---|---|---|---|---|
| Bodmin | Hanson | Foot | Harrison | Foot | Rathbone | B. Rathbone | Marshall | |||||||
| Camborne | Dyke Acland | Moreing | Jones | Moreing | Jones | Agnew | ||||||||
| Cornwall North | Marks | --> | --> | Williams | Maclean | Dyke Acland | Horabin | --> | ||||||
| Penryn and Falmouth | Nicholl | Shipwright | Mansel | Pilcher | Walters | Petherick | King | |||||||
| St Ives | Cory | Hawke | Cory | Hawke | H. Runciman | W. Runciman | --> | Beechman | ||||||
1950 to 2010 (5 MPs)
| Constituency | 1950 | 1951 | 1955 | 1959 | 1964 | 1966 | 1970 | Feb 1974 | Oct 1974 | 1979 | 1983 | 87 | 1987 | 1992 | 1997 | 2001 | 2005 |
|---|---|---|---|---|---|---|---|---|---|---|---|---|---|---|---|---|---|
| Cornwall North | Roper | Scott-Hopkins | Pardoe | Neale | Tyler | Rogerson | |||||||||||
| Bodmin (50-83) / Cornwall South East (83-10) | Marshall | Bessell | Hicks | Tyler | Hicks | Breed | |||||||||||
| Falmouth and Camborne | Hayman | Dunwoody | Mudd | Coe | Atherton | Goldsworthy | |||||||||||
| St Ives | Howard | Nott | --> | Harris | George | ||||||||||||
| Truro1 | Wilson | Dixon | Penhaligon | Taylor | --> | ||||||||||||
1name changed to Truro and St Austell in 1997
2010 to present (6 MPs)
| Constituency | 2010 | 2015 |
|---|---|---|
| Camborne and Redruth | Eustice | |
| North Cornwall | Rogerson | Mann |
| St Ives | George | Thomas |
| South East Cornwall | Murray | |
| St Austell and Newquay | Gilbert | Double |
| Truro and Falmouth | Newton | |
Changes proposed in 2016
As part of the Sixth Periodic Review of Westminster constituencies published in 2016 the Boundary Commission for England proposed the following constituencies to be fought at the Next United Kingdom general election:[6]
- Bideford, Bude and Launceston
- Bodmin and St Austell
- Falmouth and Camborne
- South East Cornwall
- St Ives
- Truro and Newquay
Party vote throughout history
| 1918 | 1922 | 1923 | 1924 | 1929 | 1931 | 1935 | 1945 | 1950 | 1951 | 1955 | 1959 | 1964 | 1966 | 1970 | 1974F | 1974O | 1979 | 1983 | 1987 | 1992 | 1997 | 2001 | 2005 | 2010 | 2015 | |
|---|---|---|---|---|---|---|---|---|---|---|---|---|---|---|---|---|---|---|---|---|---|---|---|---|---|---|
| Conservative | 28.1% | 32.8% | 35.0% | 40.9% | 38.4% | 33.6% | 41.6% | 33.8% | 35.9% | 41.1% | 39.5% | 35.7% | 33.9% | 34.3% | 47.9% | 42.0% | 43.6% | 50.6% | ||||||||
| Labour | 16.7% | 8.6% | 2.3% | 9.7% | 18.1% | 8.5% | 14.8% | 25.4% | 29.6% | 33.3% | 30.7% | 27.5% | 25.9% | 27.8% | 24.6% | 19.6% | 20.0% | 12.6% | ||||||||
| Liberal | 43.7% | 29.7% | 52.6% | 41.7% | 42.4% | 40.8% | 32.9% | 32.6% | 26.2% | 16.2% | 20.8% | 28.7% | 32.8% | 30.9% | 27.0% | 38.4% | 35.2% | 34.2% | ||||||||
| Nat. Liberal | 10.9% | 28.9% | 11.3% | 10.3% | 8.2% | 8.3% | 9.4% | 9.0% | 8.1% | 7.3% | 7.0% | |||||||||||||||
| Ind. Liberal | 10.0% | 1.0% | ||||||||||||||||||||||||
| Others | 0.6% | 7.7% | 1.2% | 5.8% | 0.4% | 0.4% | 0.1% | 0.4% | 0.3% | 2.6% | ||||||||||||||||
| Total vote | 79,176 | 104,845 | 117,782 | 123,435 | 166,379 | 141,556 | 155,113 | 174,410 | 201,524 | 201,337 | 189,947 | 193,333 | 193,325 | 203,529 | 217,841 | 241,708 | 232,610 | 257,059 |
Footnotes
- ↑ The majority is the number of votes the winning candidate receives more than their nearest rival.
References
- ↑ "2015 Electorates".
- ↑ "The Parliamentary Constituencies (England) Order 2007". Office of Public Sector Information. Crown copyright. 13 June 2007. Retrieved 7 November 2009.
- ↑ Boundary Commission for England pp. 1004–1007
- ↑ National Liberal Party took the Party whip
- ↑ Formerly the Liberal Party
- ↑ "2018 Review - Intital proposals for South West England". Boundary Commission for England. Retrieved 19 September 2016.
This article is issued from Wikipedia - version of the 11/29/2016. The text is available under the Creative Commons Attribution/Share Alike but additional terms may apply for the media files.