List of sovereign states in Europe by GDP (PPP) per capita
This is map and list of European countries by GDP (PPP) per capita for year 2015 from World Bank.
Map of sovereign states in Europe by GDP per capita based on international dollars (PPP) 2015
The map data is for year 2015 from the World Bank, using GDP based on international dollars (data with asterisk* are from 2013).[1] An international dollar would buy in the cited country a comparable amount of goods and services a U.S. dollar would buy in the United States.[2]
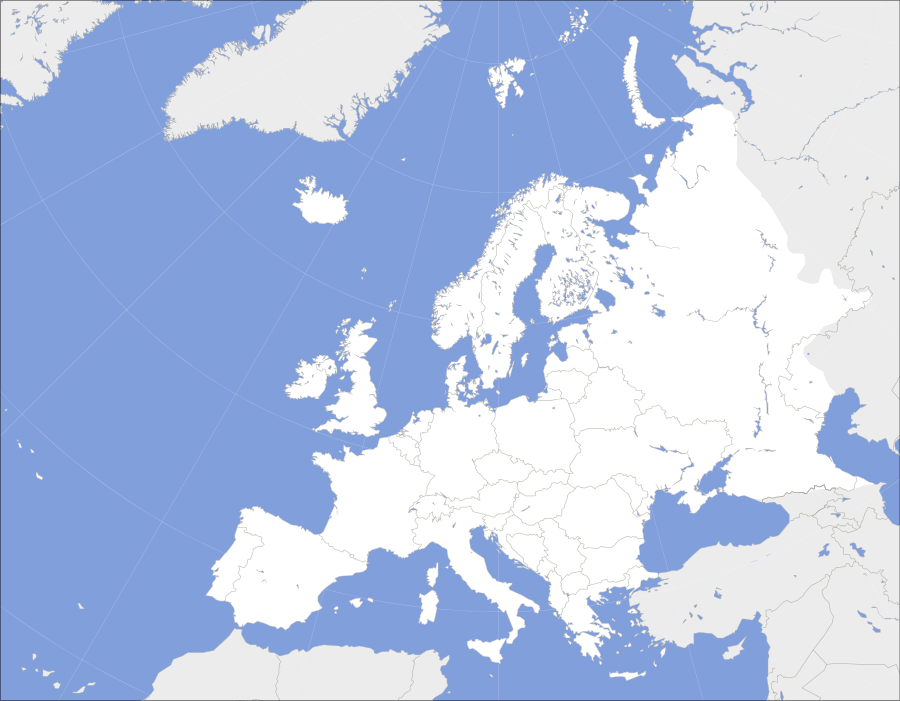
Table of sovereign states in Europe by GDP per capita based on international dollars (PPP)
The table data uses a five-year interval from the World Bank, with GDP based on international dollars.[3]
| Country | 2010 | 2011 | 2012 | 2013 | 2014 | 2015 |
|---|---|---|---|---|---|---|
| | 9 297 | 9 640 | 9 666 | 9 925 | 10 428 | 11 305.4 |
| | 41 804 | 44 028 | 44 872 | 45 081 | 46 164 | 47 824.2 |
| | 15 627 | 15 754 | 16 173 | 17 142 | 17 515 | 17 740.0 |
| | 15 385 | 16 603 | 17 210 | 17 650 | 18 184 | 17 660.9 |
| | 39 211 | 40 945 | 41 397 | 41 572 | 42 725 | 43 991.6 |
| | 8 746 | 9 248 | 9 356 | 9 535 | 9 904 | 10 509.7 |
| | 14 690 | 15 278 | 15 671 | 15 731 | 16 323 | 17 511.8 |
| | 18 968 | 20 571 | 21 113 | 21 350 | 21 252 | 21 880.5 |
| | 33 934 | 32 983 | 32 553 | 31 198 | 30 873 | 30 734.2 |
| | 27 051 | 28 603 | 28 674 | 29 017 | 30 444 | 32 167.1 |
| | 41 806 | 43 314 | 43 560 | 43 782 | 44 862 | 46 635.2 |
| | 21 085 | 23 575 | 24 735 | 25 823 | 26 355 | 28 094.8 |
| | 38 296 | 40 251 | 40 209 | 39 869 | 39 754 | 40 600.9 |
| | 35 868 | 37 327 | 37 258 | 37 594 | 38 850 | 39 678.0 |
| | 39 553 | 42 079 | 43 522 | 43 887 | 45 615 | 47 268.4 |
| | 28 900 | 26 675 | 25 462 | 25 666 | 26 098 | 26 680.1 |
| | 21 477 | 22 523 | 22 494 | 23 336 | 24 498 | 25 581.5 |
| | 38 659 | 39 619 | 40 606 | 42 035 | 43 392 | 46 547.0 |
| | 42 900 | 44 912 | 45 242 | 45 677 | 47 804 | 54 654.4 |
| | 34 716 | 35 901 | 35 524 | 35 075 | 34 757 | 35 896.5 |
| | 19 204 | 20 772 | 21 891 | 23 213 | 24 204 | 25 876.5 |
| | N/A | N/A | N/A | 8 884 | N/A | 9 712.0 |
| | 17 488 | 19 405 | 21 176 | 22 533 | 23 337 | 24 286.1 |
| | 20 052 | 22 530 | 24 083 | 25 714 | 26 642 | 27 729.8 |
| | 84 200 | 91 469 | 91 849 | 91 047 | N/A | 101 926.4 |
| | 11 449 | 11 431 | 11 669 | 12 263 | 12 937 | 13 907.9 |
| | 26 671 | 28 177 | 28 276 | 29 126 | N/A | N/A |
| | 3 845 | 4 179 | 4 225 | 4 692 | 4 982 | 5 038.5 |
| | 13 339 | 14 081 | 13 588 | 14 135 | 14 323 | 15 485.8 |
| | 44 743 | 46 388 | 46 053 | 46 162 | 47 130 | 48 458.9 |
| | 58 772 | 62 736 | 66 363 | 65 640 | 64 893 | 61 471.6 |
| | 20 757 | 22 333 | 23 151 | 23 994 | 24 882 | 26 135.3 |
| | 26 924 | 26 932 | 27 000 | 27 509 | 28 326 | 29 214.3 |
| | 16 252 | 17 362 | 18 136 | 18 972 | 19 401 | 21 403.1 |
| | 20 498 | 22 569 | 24 063 | 25 032 | 25 635 | 24 451.4 |
| | 11 805 | 12 571 | 12 805 | 13 019 | 13 577 | 13 481.9 |
| | 24 432 | 25 066 | 25 718 | 26 496 | 27 584 | 28 877.3 |
| | 27 563 | 28 491 | 28 450 | 28 858 | 29 917 | 31 122.4 |
| | 32 350 | 32 674 | 32 769 | 33 092 | 33 763 | 34 526.5 |
| | 41 727 | 43 709 | 43 869 | 44 646 | 45 143 | 46 420.4 |
| | 51 321 | 54 550 | 55 915 | 56 939 | N/A | 60 535.2 |
| | 16 193 | 17 908 | 18 221 | 18 808 | 19 250 | 19 618.2 |
| | 7 685 | 8 281 | 8 468 | 8 614 | 8 665 | 7 915.9 |
| | 35 920 | 36 549 | 37 385 | 38 255 | 39 136 | 41 324.6 |
See also
- International organisations in Europe
- List of European countries by budget revenues
- List of European countries by budget revenues per capita
- List of European countries by GDP (nominal) per capita
- List of European countries by GNI (nominal) per capita
- List of European countries by GNI (PPP) per capita
- List of sovereign states in Europe by net average wage
- List of countries by GDP (nominal) per capita
- List of countries by GDP (PPP) per capita
- List of countries by GDP (nominal)
- List of countries by GDP (PPP)
References
- ↑ "World Bank GDP per capita - international dollars". The World Bank. Retrieved 12 August 2015.
- ↑ "What is an international dollar?". World Bank. Retrieved 20 June 2015.
- ↑ "World Bank GDP per capita - international dollars". The World Bank. Retrieved 11 August 2015.
External links
- Eurostat - Statistics Explained: GDP per capita, consumption per capita and price level indices (data Dec. 2011)
This article is issued from Wikipedia - version of the 11/17/2016. The text is available under the Creative Commons Attribution/Share Alike but additional terms may apply for the media files.