Lincolnshire County Council elections
Lincolnshire County Council in England is elected every four years.
Political control
Since 1973 political control of the council has been held by the following parties:[1]
| Party in control | Years |
|---|---|
| No overall control | 1973 - 1977 |
| Conservative | 1977 - 1993 |
| No overall control | 1993 - 1997 |
| Conservative | 1997 - 2013 |
| No overall control | 2013 - present |
Council elections
- Lincolnshire County Council election, 1973
- Lincolnshire County Council election, 1977
- Lincolnshire County Council election, 1981 (boundary changes)
- Lincolnshire County Council election, 1985
- Lincolnshire County Council election, 1989
- Lincolnshire County Council election, 1993
- Lincolnshire County Council election, 1997
- Lincolnshire County Council election, 2001 (boundary changes increased the number of seats by 1)[2]
- Lincolnshire County Council election, 2005
- Lincolnshire County Council election, 2009
- Lincolnshire County Council election, 2013
County result maps
-
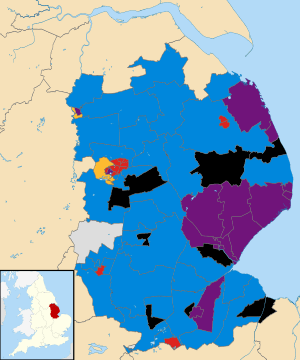
2013 results map
-

2009 results map
-

2005 results map
-

2001 results map
-

1997 results map
-

1993 results map
-

1989 results map
-

1985 results map
-

1981 results map
By-election results
1997-2001
| Party | Candidate | Votes | % | ± | |
|---|---|---|---|---|---|
| Conservative | 449 | 46.8 | -19.2 | ||
| Liberal Democrat | 354 | 36.9 | +36.9 | ||
| Labour | 156 | 16.3 | -17.7 | ||
| Majority | 95 | 9.9 | |||
| Turnout | 959 | 13.0 | |||
| Conservative hold | Swing | ||||
| Party | Candidate | Votes | % | ± | |
|---|---|---|---|---|---|
| Liberal Democrat | 296 | 46.9 | +11.5 | ||
| Conservative | 212 | 33.6 | +7.0 | ||
| Labour | 105 | 16.6 | -18.5 | ||
| Independent | 18 | 2.9 | +2.9 | ||
| Majority | 84 | 13.3 | |||
| Turnout | 631 | 13.5 | |||
| Liberal Democrat hold | Swing | ||||
2001-2005
| Party | Candidate | Votes | % | ± | |
|---|---|---|---|---|---|
| Labour | 524 | 45.9 | -17.4 | ||
| Independent | 339 | 29.7 | +17.3 | ||
| Conservative | 235 | 20.6 | +0.0 | ||
| Green | 44 | 3.9 | +3.9 | ||
| Majority | 185 | 16.2 | |||
| Turnout | 1,142 | 20.6 | |||
| Labour hold | Swing | ||||
2005-2009
| Party | Candidate | Votes | % | ± | |
|---|---|---|---|---|---|
| Conservative | Peter Bedford | 800 | 57.9 | +10.3 | |
| UKIP | Sue Ransome | 217 | 15.7 | -8.8 | |
| Labour | Paul Kenny | 205 | 14.8 | -13.2 | |
| Liberal Democrat | Albert Tebbs | 160 | 11.6 | +11.6 | |
| Majority | 583 | 42.2 | |||
| Turnout | 1,382 | 25.0 | |||
| Conservative hold | Swing | ||||
| Party | Candidate | Votes | % | ± | |
|---|---|---|---|---|---|
| Conservative | Charlotte Farquharson | 657 | 44.6 | -2.5 | |
| Labour | Trevor Holmes | 435 | 29.5 | +2.6 | |
| Liberal Democrat | Timothy Fitzgerald | 255 | 17.3 | -8.7 | |
| UKIP | Jamie Corney | 127 | 8.6 | +8.6 | |
| Majority | 222 | 15.1 | |||
| Turnout | 1,474 | 23.5 | |||
| Conservative hold | Swing | ||||
| Party | Candidate | Votes | % | ± | |
|---|---|---|---|---|---|
| Conservative | Clive Oxby | 877 | 61.8 | +14.5 | |
| Labour | Darren Hopewell | 206 | 14.5 | -26.9 | |
| Liberal Democrat | Roy Harris | 137 | 9.7 | +9.7 | |
| BNP | Michael Clayton | 126 | 8.9 | +8.9 | |
| UKIP | Steven Pearson | 52 | 3.7 | -7.6 | |
| Independent | Victor Sahunta | 21 | 1.5 | +1.5 | |
| Majority | 671 | 47.3 | |||
| Turnout | 1,419 | 26.2 | |||
| Conservative hold | Swing | ||||
| Party | Candidate | Votes | % | ± | |
|---|---|---|---|---|---|
| Conservative | Hugo Marfleet | 1,013 | 49.9 | +13.5 | |
| Independent | Daniel Simpson | 361 | 17.8 | -0.6 | |
| Liberal Democrat | Eric Needham | 304 | 15.0 | -18.4 | |
| BNP | Robert West | 219 | 10.8 | +10.8 | |
| Labour | Michael Preen | 75 | 3.7 | +3.7 | |
| UKIP | Barry Gleeson | 59 | 2.9 | -9.0 | |
| Majority | 652 | 32.1 | |||
| Turnout | 2,031 | 31.9 | |||
| Conservative hold | Swing | ||||
| Party | Candidate | Votes | % | ± | |
|---|---|---|---|---|---|
| Conservative | Sue Woolley | 760 | 41.4 | -12.9 | |
| Independent | Helen Powell | 355 | 19.3 | +19.3 | |
| BNP | David Owens | 239 | 13.0 | +13.0 | |
| Labour | Roberta Britton | 202 | 11.0 | -34.7 | |
| Liberal Democrat | Peter Morris | 198 | 10.8 | +10.8 | |
| Green | Ashley Baxter | 42 | 2.3 | +2.3 | |
| UKIP | Peter Oldham | 41 | 2.2 | +2.2 | |
| Majority | 405 | 22.1 | |||
| Turnout | 1,837 | 21.0 | |||
| Conservative hold | Swing | ||||
2009-2013
| Party | Candidate | Votes | % | ± | |
|---|---|---|---|---|---|
| Conservative | Andrea Jenkyns | 597 | 38.7 | +13.2 | |
| BNP | David Owens | 581 | 37.7 | +17.1 | |
| Labour | Pam Kenny | 204 | 13.2 | +1.9 | |
| Liberal Democrat | Michael Shriden-Shinn | 160 | 10.4 | +3.2 | |
| Majority | 16 | 1.0 | |||
| Turnout | 1,542 | 21.3 | |||
| Conservative hold | Swing | ||||
References
- ↑ "Lincolnshire". BBC News Online. BBC. 5 June 2009. Retrieved 2009-06-11.
- ↑ "Lincolnshire". BBC News Online. BBC. Retrieved 2009-09-03.
- ↑ "Boston Coastal electoral division". Boston borough council. Retrieved 2009-09-03.
- ↑ "Declaration of result of poll" (PDF). South Kesteven District Council. Retrieved 2009-09-03.
- ↑ "Declaration of result of poll" (PDF). Lincolnshire County Council. Retrieved 2009-09-03.
- ↑ "Tories win by-election but BNP beat Labour". Louth Leader. 2008-08-01. Retrieved 2009-09-03.
- ↑ "Conservatives win county seat in Bourne by-election.". Spaldingtoday. 2008-10-03. Retrieved 2009-09-03.
- ↑ "BNP narrowly beaten in by-election". Boston Standard. 2009-10-16. Retrieved 2009-10-17.
External links
| Lincolnshire County Council | |||||||||||||||||||||||||||||||||||||||
|---|---|---|---|---|---|---|---|---|---|---|---|---|---|---|---|---|---|---|---|---|---|---|---|---|---|---|---|---|---|---|---|---|---|---|---|---|---|---|---|
| Boston Borough Council | |||||||||||||||||||||||||||||||||||||||
| East Lindsey District Council |
| ||||||||||||||||||||||||||||||||||||||
| City of Lincoln Council | |||||||||||||||||||||||||||||||||||||||
| North East Lincolnshire Council | |||||||||||||||||||||||||||||||||||||||
| North Kesteven District Council |
| ||||||||||||||||||||||||||||||||||||||
| North Lincolnshire Council | |||||||||||||||||||||||||||||||||||||||
| South Holland District Council |
| ||||||||||||||||||||||||||||||||||||||
| South Kesteven District Council | |||||||||||||||||||||||||||||||||||||||
| West Lindsey District Council | |||||||||||||||||||||||||||||||||||||||
| |||||||||||||||||||||||||||||||||||||||
| |||||||||||||||||||||||||||||||||||||||
This article is issued from Wikipedia - version of the 10/7/2016. The text is available under the Creative Commons Attribution/Share Alike but additional terms may apply for the media files.