Life-cycle greenhouse-gas emissions of energy sources
Measurement of life-cycle greenhouse gas emissions involves calculating the global-warming potential of electrical energy sources through life-cycle assessment of each energy source. The findings are presented in units of global warming potential per unit of electrical energy generated by that source. The scale uses the global warming potential unit, the carbon dioxide equivalent (CO2e), and the unit of electrical energy, the kilowatt hour (kWh). The goal of such assessments is to cover the full life of the source, from material and fuel mining through construction to operation and waste management.
In 2014, the Intergovernmental Panel on Climate Change harmonized the carbon dioxide equivalent (CO2e) findings of the major electricity generating sources in use worldwide. This was done by analyzing the findings of hundreds of individual scientific papers assessing each energy source.[1]
For all technologies, advances in efficiency, and therefore reductions in CO2e since the time of publication, have not been included. For example, the total life cycle emissions from wind power may have lessened since publication. Similarly, due to the time frame over which the studies were conducted, nuclear Generation II reactor's CO2e results are presented and not the global warming potential of Generation III reactors, presently under construction in the United States and China. Other limitations of the data include: a) missing life cycle phases, and, b) uncertainty as to where to define the cut-off point in the global warming potential of an energy source. The latter is important in assessing a combined electrical grid in the real world, rather than the established practice of simply assessing the energy source in isolation.
2014 IPCC, Global warming potential of selected electricity sources
| Technology | Min | Median | Max |
|---|---|---|---|
| Currently commercially available technologies | |||
| Coal – PC | 740 | 820 | 910 |
| Biomass – cofiring with coal | 620 | 740 | 890 |
| Gas – combined cycle | 410 | 490 | 650 |
| Biomass – dedicated | 130 | 230 | 420 |
| Solar PV – utility scale | 18 | 48 | 180 |
| Solar PV – rooftop | 26 | 41 | 60 |
| Geothermal | 6.0 | 38 | 79 |
| Concentrated solar power | 8.8 | 27 | 63 |
| Hydropower | 1.0 | 24 | 2200 |
| Wind offshore | 8.0 | 12 | 35 |
| Nuclear | 3.7 | 12 | 110 |
| Wind onshore | 7.0 | 11 | 56 |
| Pre‐commercial technologies | |||
| CCS – Coal – PC | 190 | 220 | 250 |
| CCS – Coal – IGCC | 170 | 200 | 230 |
| CCS – Gas – combined cycle | 94 | 170 | 340 |
| CCS – Coal – oxyfuel | 100 | 160 | 200 |
| Ocean (tidal and wave) | 5.6 | 17 | 28 |
2012 Yale University systematic review and harmonization of nuclear power data
A Yale University review of hundreds of prior papers, as published in the Journal of Industrial Ecology analyzing CO2 life cycle assessment(LCA) emissions from nuclear power determined that: "The collective LCA literature indicates that life cycle GHG emissions from nuclear power are only a fraction of traditional fossil sources and comparable to renewable technologies."[4] The study also noted that for the most common category of reactors, the Light water reactor: "Harmonization decreased the median estimate for all LWR technology categories so that the medians of BWRs, PWRs, and all LWRs are similar, at approximately 12 g CO2-eq/kWh.
Speaking of the numerous assumptions and therefore wide results returned by authors of previous individual studies, the Warner and Heath Yale paper states: "the difference between nuclear power life cycle GHG emissions constructed in an electric system dominated by nuclear (or renewables) and a system dominated by coal can be fairly large (in the range of 4 to 22 g CO2-eq/kWh compared to 30 to 110 g CO2-eq/kWh, respectively)". The already established electric grid being a necessary input to drive the uranium enrichment systems.
With Figure 4 of the paper,[4] expanding on these figures, displaying the median result returned from these other papers as approximately 35 g CO2-eq/kWh when a nation's background electricity "energy mix" is "high carbon" that is, primarily coal powered, combined with a slightly lower than typical uranium ore grade input in the range of 0.01% U3O8. For perspective, average grade ores are between 0.05% to 0.40% U3O8.[5] The high rate of near 110 grams of GHGs mentioned in this Yale paper, as shown in Figure 4 and discussed in the body of the article, is derived from what they consider to be a "worst-case scenario" that is not "considered very robust". As it is inclusive of a combination of unrealistic factors not seen in any country. This is, a high coal usage in the electricity energy-mix combined with the terrestrial mining by conventional methods, of ultra low-grade "uranium ore" with a "0.0001%" concentration of U3O8.[4]
As a way to put this "ore" concentration into perspective, vast quantities of presently uneconomical uranium in many lignite coal ashes have uranium concentrations five times greater than this.[6] On the other hand, the 4 g CO2-eq/kWh rate mentioned in the body of the paper is, again as Figure 4 shows, a result of an electricity energy-mix that is already low-carbon combined with a more typical, but still low, uranium ore grade of 0.01% U3O8. This combination is considerably different than the hypothetical "worse-case scenario" of 110 grams, as this latter combination is seen in some select countries. Namely Sweden, Switzerland and the French electricity grid as the most prominent. With this close to 4 gram value, reported by the Swedish Vattenfall study discussed below.
In the most common and pertinent case of GHG data from countries with a "medium carbon" intensity electric grid and input ores of about 0.01%. The median value of GHG emissions was determined to be about 9 grams, as depicted in figure 4 of the Yale paper, when the now world-standard "centrifuge" enrichment approach alone, is assessed.[4] In 2013 the other less economic approach of "diffusion" enrichment, that is similarly depicted in figure 4 was retired worldwide. When it operated the median GHG value that the Yale analyst's depict for this old technology was about 15 grams under the same "medium carbon" grid conditions.[4]
The authors of the Yale paper also note that a "similar but less extreme dynamic relationship between ore grades and fossil energy consumption could apply to rare earth materials used in some renewable technologies."
Lastly, although the paper primarily dealt with data derived from legacy Generation II reactors, it did also summarize the Life Cycle Assessment literature of more advanced reactor designs, of which presently only small numbers are in operation. "Fast Breeder Reactors have been evaluated in the LCA literature. The limited literature that evaluates this potential future technology reports median life cycle GHG emissions ... similar to or lower than LWRs and purports to consume little or no uranium ore.[4]
2011 IPCC aggregated results of the available literature
A literature review conducted by the Intergovernmental Panel on Climate Change in 2011, of numerous energy sources CO2 emissions per unit of electricity generated, found that the CO2 emission values that fell within the 50th percentile of all total life cycle emissions studies were as follows.[7]
| Technology | Description | 50th percentile (g CO2/kWhe) |
|---|---|---|
| Hydroelectric | reservoir | 4 |
| Wind | onshore | 12 |
| Nuclear | various generation II reactor types | 16 |
| Biomass | various | 18 |
| Solar thermal | parabolic trough | 22 |
| Geothermal | hot dry rock | 45 |
| Solar PV | Polycrystaline silicon | 46 |
| Natural gas | various combined cycle turbines without scrubbing | 469 |
| Coal | various generator types without scrubbing | 1001 |
| Technology | Description | Minimum estimate (g CO2/kWhe | Maximum estimate (g CO2/kWhe |
|---|---|---|---|
| Natural gas | with CCS | 65 | 245 |
| Coal | with CCS | 98 | 396 |
2008 Benjamin K. Sovacool survey of nuclear power.
A meta analysis of 103 nuclear power life-cycle studies by Benjamin K. Sovacool found that nuclear power plants produce electricity with a mean of 66 g equivalent life-cycle carbon dioxide emissions per kWh, compared to renewable power generators, which produce electricity with 9.5 to 38 g carbon dioxide per kWh, and fossil-fuel power stations, which produce electricity with about 443 to 1,050 g equivalent life cycle carbon dioxide emissions per kWh.[8][9][10] Sovacool thus concludes that nuclear energy technologies are seven to sixteen times more effective at fighting climate change than fossil fuel power plants on a per-kWh basis. Renewable electricity technologies are "two to seven times more effective than nuclear power plants on a per kWh basis at fighting climate change." Sovacool has said that his estimates already include all conceivable emissions associated with the manufacturing, construction, installation and decommissioning of renewable power plants.[11]
Sovacool has been criticized by his peers, as it was noted that his paper was overly based on data from Jan Willem Storm van Leeuwen.[12] Beerten et al. state:
"Most recently, Sovacool(2008) calculated a mean value for the overall emissions by averaging the global results of 19 LCA [Life-Cycle Analysis] studies forming a subset of, as stated by the author, 'the most current, original and transparent studies' out of 103 studies. However, a critical assessment reveals that a majority of the studies representing the upper part of the spectrum are studies that can be traced back to the same input data and performed by the same author, namely Storm van Leeuwen. After careful analysis, it must be concluded that the mix of selected LCAs results in a skewed and distorted collection of different results available in the literature. Furthermore, since many studies use different energy mixes and other assumptions, averaging GHG emissions of those studies is no sound method to calculate an overall emission coefficient, as it gives no site specific information needed for policy makers to base their decisions."[12]
| Technology | Description | Estimate (g CO2/kWhe) |
|---|---|---|
| Wind | 2.5 MW offshore | 9 |
| Hydroelectric | 3.1 MW reservoir | 10 |
| Wind | 1.5 MW onshore | 10 |
| Biogas | Anaerobic digestion | 11 |
| Hydroelectric | 300 kW run-of-river | 13 |
| Solar thermal | 80 MW parabolic trough | 13 |
| Biomass | various | 14-35 |
| Solar PV | Polycrystaline silicon | 32 |
| Geothermal | 80 MW hot dry rock | 38 |
| Nuclear | various reactor types | 66 |
| Natural gas | various combined cycle turbines | 443 |
| Fuel Cell | hydrogen from gas reforming | 664 |
| Diesel | various generator and turbine types | 778 |
| Heavy oil | various generator and turbine types | 778 |
| Coal | various generator types with scrubbing | 960 |
| Coal | various generator types without scrubbing | 1050 |
Beerten, et al., proceed to discuss reasons why LCA analysis for nuclear power plants can give such widely varying estimates. For example, life-cycle greenhouse-gas emissions of nuclear power depend on the enrichment method, the carbon intensity of the electricity used for enrichment, the efficiency of the plant, as well as on chosen mining technologies. Averages and means from multiple sources can be skewed by inharmonious data, clustering bias, by outliers and so on.[13]
There have been responses to these criticisms, particularly in reference to Sovacool applying his methodology to nuclear power but using other researchers' results, from different methodologies, as the source of the above-tabled Wind and Solar energy figures. For example, Beerten and his colleague Daniel Nugent embarked on studying these other energy sources. Their paper reports that wind energy has a mean value of 34.11 grams of CO2-eq/kWh and solar PV a mean value of 49.91 grams of CO2-eq/kWh, with the minimum for wind being 0.4 g and the maximum 364.8 g and a minimum for Solar PV of 1 g and a maximum of 218 g.[14]
Missing life cycle phases
Although the life cycle assessments of each energy source should attempt to cover the full life cycle of the source from cradle-to-grave, they are generally limited to the construction and operation phase. The most rigorously studied phases are those of material and fuel mining, construction, operation, and waste management. However, missing life cycle phases[4] exist for a number of energy sources. At times, assessments variably and sometimes inconsistently include the global warming potential that results from decommissioning the energy supplying facility, once it has reached its designed life-span. This includes the global warming potential of the process to return the power-supply site to greenfield status. For example, the process of hydroelectric dam removal is usually excluded as it is a rare practice with little practical data available. Dam removal however may become increasingly common as dams age. An example of this is the decommissioning of the Bull Run Hydroelectric Project, which was the largest concrete dam ever removed in the United States as of 2012.[15] Larger dams, such as the Hoover Dam, and the Three Gorges Dam are intended to last "forever" with the aid of maintenance, a period that is not quantified.[16] Therefore, decommissioning estimates are generally omitted for some energy sources, while other energy sources include a decommissioning phase in their assessments.
Along with the other prominent values of the paper, the median value presented of 12 g CO2-eq/kWhe for nuclear fission, found in the 2012 Yale University nuclear power review, a paper which also serves as the origin of the 2014 IPCC's nuclear value,[17] does however include the contribution of facility decommissioning with an "Added facility decommissioning" global warming potential in the full nuclear life cycle assessment.[4]
GHG from Utility-Scale Wind power
High electric grid penetration by Intermittent power sources (e.g. wind power) which have low capacity factors due to the weather, requires either: a) the construction of energy storage projects, which have their own emission intensity, or b) more frequent back up than the reserve requirements necessary to back up more dependable/baseload power sources, such as hydropower and nuclear energy. This higher dependence on back up/load following power plants to ensure a steady power grid output has the knock-on effect of more frequent inefficient(in CO2e g/kWh) throttling up and down of these other power sources in the grid to facilitate the intermittent, or variably output, of these energy supplying systems. When one includes the total effect of these intermittent sources as it pretains to the other power sources in the grid system, that is, including the inefficient start-up emissions of the backup power supplies to cater for wind energy; into wind energy's total system-wide life cycle, the result is a higher real-world wind energy emission intensity than the calculated and isolated wind energy g/kWh value. As these calculations look at the wind power source in isolation and exclude all down stream detrimental/inefficiency effects on the grid. In a 2012 paper in the Journal of Industrial Ecology, Dolan and Heath state:.[18]
"The thermal efficiency of fossil-based power plants is reduced when operated at fluctuating and suboptimal loads to supplement wind power, which may degrade, to a certain extent, the GHG benefits resulting from the addition of wind to the grid. A study conducted by Pehnt and colleagues (2008) reports that a moderate level of [grid] wind penetration (12%) would result in efficiency penalties of 3% to 8%, depending on the type of conventional power plant considered. Gross and colleagues (2006) report similar results, with efficiency penalties ranging from nearly 0% to 7% for up to 20% [of grid] wind penetration. Pehnt and colleagues (2008) conclude that the results of adding offshore wind power in Germany on the background power systems maintaining a level supply to the grid and providing enough reserve capacity amount to adding between 20 and 80 g CO2-eq/kWh to the life cycle GHG emissions profile of wind power."'
Other studies
Individual studies show a wide range of estimates for fuel sources arising from the different methodologies used. Those on the low end tend to leave parts of the life cycle out of their analysis, while those on the high end often make unrealistic assumptions about the amount of energy used in some parts of the life cycle.[19]
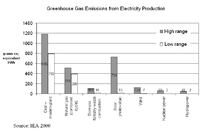
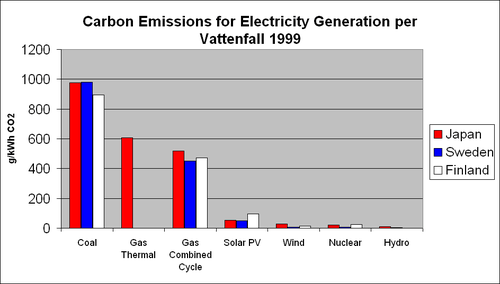
In 2007 the Intergovernmental Panel on Climate Change stated that total life-cycle GHG emissions per unit of electricity produced from nuclear power are below 40 g CO2-eq/kWh (10 g C-eq/kWh), similar to those for renewable energy sources.[20] The Swedish utility Vattenfall did a study in 1999 of full life cycle emissions of nuclear, hydro, coal, gas, solar cell, peat, and wind. All the energy sources that the electricity utility actively has experience using to generate electricity. The findings of their study showed that nuclear power produced 3.3 grams of carbon dioxide per kW-hr of produced power. This compares to 400 for natural gas and 700 for coal (according to this study). The study also concluded that nuclear power produced the smallest amount of CO2 of any of their electricity sources.[21]
Another report, "Life-Cycle Energy Balance and Greenhouse Gas Emissions of Nuclear Energy in Australia," conducted by the University of Sydney in 2008, produced the following results: nuclear = 60-65 g CO2/kWh; wind power = 20 g/kWh; solar PV = 106 g/kWh. The likely range of values from this study produced the following results: nuclear = 10-130 g CO2/kWh; wind power = 13-40 g CO2/kWh; solar PV = 53-217 g CO2/kWh. Furthermore, the study criticised the Vattenfall report: "it omits the energy and greenhouse gas impacts of many upstream [mining] contributions."[22] In a study conducted in 2006 by the UK's Parliamentary Office of Science and Technology (POST), which used figures from Torness Nuclear Power Station-an Advanced gas-cooled reactor,[23] nuclear power's life cycle was evaluated to emit the least amount of carbon dioxide (very close to wind power's life cycle emissions) when compared to the other alternatives (fossil fuel, coal, and some renewable energy including biomass and PV solar panels). [24]
A 2005 study,[25] by Jan Willem Storm van Leeuwen, reported that carbon dioxide emissions from nuclear power plants per kilowatt hour could range from 20% to 120% of those for natural gas-fired power stations depending on the availability of high grade ores.[25] Although the study was heavily criticized, the paper was used by anti-nuclear organizations to claim that nuclear power is not suitable for a warming world.[26]
Heat from thermal power plants
Thermal power plants, that is, those that produce thermal/heat energy, with common low carbon power examples such as biomass, nuclear and geothermal energy stations, directly add heat energy to the earth's global energy balance. According to David JC MacKay, assuming that all future energy is derived from these thermal power stations operating with their present thermal efficiency of ~30%, and that the world population is 10 billion in 100 years time(~2100) with each individual enjoying a per capita energy usage rate similar to that of the average European standard of living of 125 kWh per day, the extra power contributed by this thermal energy use to the planet would be a global surface area average of 0.1 Watt per square meter, which is one fortieth of the 4 W/m2 that is believed to be likely if a doubling of atmospheric CO2 concentrations occur, and a little smaller than the "0.25 W/m2 effect" of Solar variations. "Under these assumptions, human power production would just show up as a contributor to global climate change."[27]
Potential heating from wind turbines
An MIT peer-reviewed study suggested that using wind turbines to meet 10 percent of global energy demand in 2100 could have a warming effect, causing temperatures to rise by 1 °C (1.8 °F) in the regions on land where the wind farms are installed, including a smaller increase in areas beyond those regions. This is due to the effect of wind turbines on both horizontal and vertical atmospheric circulation. While turbines installed in water would have a cooling effect, the net impact on global surface temperatures would be an increase of 0.15 °C (0.27 °F). Author Ron Prinn said that the study hadn't conclusively proved this and cautioned against interpreting the study "as an argument against wind power." He urged instead that it guide future research.[28]
See also
- Climate change mitigation
- Carbon capture and storage
- Bio-energy with carbon capture and storage - costly but capable of having a large negative global warming potential.
- Efficient energy use
- Nuclear power proposed as renewable energy
References
- ↑ Nuclear Power Results – Life Cycle Assessment Harmonization, NREL Laboratory, Alliance For Sustainable Energy LLC website, U.S. Department Of Energy, last updated: January 24, 2013.
- ↑ "IPCC Working Group III – Mitigation of Climate Change, Annex III: Technology - specific cost and performance parameters" (PDF). IPCC. 2014. p. 10. Retrieved 1 August 2014.
- ↑ "IPCC Working Group III – Mitigation of Climate Change, Annex II Metrics and Methodology" (PDF). pp. 14–31.
- 1 2 3 4 5 6 7 8 Warner, Ethan S.; Heath, Garvin A. (2012). "Life Cycle Greenhouse Gas Emissions of Nuclear Electricity Generation: Systematic Review and Harmonization". Journal of Industrial Ecology. 16: S73–S92. doi:10.1111/j.1530-9290.2012.00472.x.
- ↑ In Situ Leach (ISL) Mining of Uranium
- ↑ McKay, A.D. & Meiitis, Y. (2001), Australia's uranium resources, geology and development of deposits. (PDF), AGSO-Geoscience Australia, Mineral Resources Report 1, ISBN 0-642-46716-1, retrieved February 12, 2009
- 1 2 3 Moomaw, W., P. Burgherr, G. Heath, M. Lenzen, J. Nyboer, A. Verbruggen, 2011: Annex II: Methodology. In IPCC Special Report on Renewable Energy Sources and Climate Change Mitigation (O. Edenhofer, R. Pichs-Madruga, Y. Sokona, K. Seyboth, P. Matschoss, S. Kadner, T. Zwickel, P. Eickemeier, G. Hansen, S. Schlömer, C. von Stechow (eds)) (ref. page 193), Cambridge University Press, Cambridge, United Kingdom and New York,NY, USA.
- 1 2 Sovacool, Benjamin K. (2008). "Valuing the greenhouse gas emissions from nuclear power: A critical survey" (PDF). Energy Policy. 36: 2950–2963. doi:10.1016/j.enpol.2008.04.017.
- ↑ "Valuing the Greenhouse Gas Emissions from Nuclear Power". JournalistsResource.org, retrieved 22 March 2012
- ↑ Edited by Frank Barnaby, James Kemp (2006). "Secure Energy? Civil Nuclear Power, Security and Global Warming" (PDF). Oxford Research Group. Retrieved 2007-07-13.
- ↑ Sovacool, Benjamin K. (2010). "A Critical Evaluation of Nuclear Power and Renewable Electricity in Asia". Journal of Contemporary Asia. 40 (3): 386.
- 1 2 Beerten, Jef; Laes, Erik; Meskens, Gaston; D’haeseleer, William (December 2009). "Greenhouse gas emissions in the nuclear life cycle: A balanced appraisal". Energy Policy. 37 (12): 5056–5068. doi:10.1016/j.enpol.2009.06.073. Retrieved 2 Mar 2012.
- ↑ Dolan, Stacey L.; Heath, Garvin A. (April 2012). "Life Cycle Greenhouse Gas Emissions of Utility-Scale Wind Power". Journal of Industrial Ecology. 16 (Supplement S1): S136–S154. doi:10.1111/j.1530-9290.2012.00464.x. Retrieved 4 May 2014.
- ↑ "Assessing the lifecycle greenhouse gas emissions from solar PV and wind energy: A critical meta-survey". Energy Policy. 65: 229–244. doi:10.1016/j.enpol.2013.10.048.
- ↑ McOmie, Grant (April 11, 2005). "2 the Outdoors - Marmot Dam Comes Down Soon". KATU news. Archived from the original on April 16, 2005. Retrieved June 11, 2008.
When the dam removal begins it will be the largest concrete dam in America to come down.
- ↑ How long are dams like Hoover Dam engineered to last? What's the largest dam ever to fail?. Straightdope.com (2006-08-11). Retrieved on 2013-02-19.
- ↑ http://srren.ipcc-wg3.de/report/IPCC_SRREN_Annex_II.pdf pg 40
- ↑ "Life Cycle Greenhouse Gas Emissions of Utility-Scale Wind Power Systematic Review and Harmonization Stacey L. Dolan and Garvin A. Heath Article first published online: 30 MAR 2012 DOI: 10.1111/j.1530-9290.2012.00464.x".
- ↑ "Nuclear energy: assessing the emissions". Nature. September 2008. Retrieved 18 May 2010.
- ↑ IPCC (2007). "Climate Change 2007: Working Group III: Mitigation of Climate Change".
- ↑ nuclearinfo.net. Greenhouse Emissions of Nuclear Power
- ↑ Lenzen, M.; Frank Barnaby; James Kemp; et al. (2008). "Life cycle energy and greenhouse gas emissions of nuclear energy: A review. Energy Conversion and Management 49, 2178-2199" (PDF). University of Sydney. Retrieved 2007-07-13.
- ↑ AEA Technology environment (May 2005). "Environmental Product Declaration of Electricity from Torness Nuclear Power Station". Retrieved 31 January 2010.
- ↑ Parliamentary Office of Science and Technology (2006). "Carbon Footprint of Electricity Generation" (PDF). Retrieved 2007-07-13.
- 1 2 Storm van Leeuwen and Philip Smith (2003). "Nuclear Power — The Energy Balance". Retrieved 2006-11-10.
- ↑ David Fleming (April 2006). "Why Nuclear Power Cannot be a Major Energy Source". Retrieved 2009-12-06.
- ↑ http://www.withouthotair.com/c24/page_170.shtml
- ↑ MIT analysis suggests generating electricity from large-scale wind farms could influence climate — and not necessarily in the desired way MIT, 2010.
External links
- National Renewable Energy Laboratory. LCA CO2 emissions of all present day energy sources.
- Wise uranium CO2 calculator
- Eddy Covariance Gas Emission Measurements for Scientific and Industrial Applications.