Lidar

Lidar (also called LIDAR, LiDAR, and LADAR) is a surveying method that measures distance to a target by illuminating that target with a laser light. The name lidar, sometimes considered an acronym of Light Detection And Ranging,[1] (sometimes Light Imaging, Detection, And Ranging), was originally a portmanteau of light and radar.[2][3] Lidar is popularly used to make high-resolution maps, with applications in geodesy, geomatics, archaeology, geography, geology, geomorphology, seismology, forestry, atmospheric physics,[4] laser guidance, airborne laser swath mapping (ALSM), and laser altimetry. Lidar sometimes is called laser scanning and 3D scanning, with terrestrial, airborne, and mobile applications.
History and etymology
Lidar originated in the early 1960s, shortly after the invention of the laser, and combined laser-focused imaging with radar's ability to calculate distances by measuring the time for a signal to return. Its first applications came in meteorology, where the National Center for Atmospheric Research used it to measure clouds.[5] The general public became aware of the accuracy and usefulness of lidar systems in 1971 during the Apollo 15 mission, when astronauts used a laser altimeter to map the surface of the moon.
Although some sources treat the word "lidar" as an acronym,[1] the term originated as a portmanteau of "light" and "radar". The first published mention of lidar, in 1963, makes this clear: "Eventually the laser may provide an extremely sensitive detector of particular wavelengths from distant objects. Meanwhile, it is being used to study the moon by 'lidar' (light radar) ..."[3] The Oxford English Dictionary supports this etymology.[2]
The interpretation of "lidar" as an acronym ("LIDAR" or "LiDAR") came later, beginning in 1970,[6] based on the assumption that since the base term "radar" originally started as an acronym for "RAdio Detection And Ranging", "LIDAR" must stand for "LIght Detection And Ranging",[7] or for "Laser Imaging, Detection and Ranging".[8] Although the English language no longer treats "radar" as an acronym and printed texts universally present the word uncapitalized, the word "lidar" became capitalized as "LIDAR" or "LiDAR" in some publications beginning in the 1980s. Currently no consensus exists on capitalization, reflecting uncertainty about whether or not "lidar" is an acronym, and if it is an acronym, whether it should appear in lower case, like "radar". Various publications refer to lidar as "LIDAR", "LiDAR", "LIDaR", or "Lidar". The USGS uses both "LIDAR" and "lidar", sometimes in the same document;[9] the New York Times uses both "lidar" and "Lidar".
General description
Lidar uses ultraviolet, visible, or near infrared light to image objects. It can target a wide range of materials, including non-metallic objects, rocks, rain, chemical compounds, aerosols, clouds and even single molecules.[4] A narrow laser-beam can map physical features with very high resolutions; for example, an aircraft can map terrain at 30 cm resolution or better.[10]
Lidar has been used extensively for atmospheric research and meteorology. Lidar instruments fitted to aircraft and satellites carry out surveying and mapping – a recent example being the U.S. Geological Survey Experimental Advanced Airborne Research Lidar.[11] NASA has identified lidar as a key technology for enabling autonomous precision safe landing of future robotic and crewed lunar-landing vehicles.[12]
Wavelengths vary to suit the target: from about 10 micrometers to the UV (approximately 250 nm). Typically light is reflected via backscattering. Different types of scattering are used for different lidar applications: most commonly Rayleigh scattering, Mie scattering, Raman scattering, and fluorescence. Based on different kinds of backscattering, the lidar can be accordingly called Rayleigh Lidar, Mie Lidar, Raman Lidar, Na/Fe/K Fluorescence Lidar, and so on.[4] Suitable combinations of wavelengths can allow for remote mapping of atmospheric contents by identifying wavelength-dependent changes in the intensity of the returned signal.
Design

In general there are two kinds of lidar detection schemes: "incoherent" or direct energy detection (which is principally an amplitude measurement) and coherent detection (which is best for Doppler, or phase sensitive measurements). Coherent systems generally use optical heterodyne detection, which, being more sensitive than direct detection, allows them to operate at a much lower power but at the expense of more complex transceiver requirements.
In both coherent and incoherent lidar, there are two types of pulse models: micropulse lidar systems and high energy systems. Micropulse systems have developed as a result of the ever-increasing amount of computer power available combined with advances in laser technology. They use considerably less energy in the laser, typically on the order of one microjoule, and are often "eye-safe," meaning they can be used without safety precautions. High-power systems are common in atmospheric research, where they are widely used for measuring many atmospheric parameters: the height, layering and densities of clouds, cloud particle properties (extinction coefficient, backscatter coefficient, depolarization), temperature, pressure, wind, humidity, trace gas concentration (ozone, methane, nitrous oxide, etc.).[4]
There are several major components to a lidar system:
- Laser — 600–1000 nm lasers are most common for non-scientific applications. They are inexpensive, but since they can be focused and easily absorbed by the eye, the maximum power is limited by the need to make them eye-safe. Eye-safety is often a requirement for most applications. A common alternative, 1550 nm lasers, are eye-safe at much higher power levels since this wavelength is not focused by the eye, but the detector technology is less advanced and so these wavelengths are generally used at longer ranges and lower accuracies. They are also used for military applications as 1550 nm is not visible in night vision goggles, unlike the shorter 1000 nm infrared laser. Airborne topographic mapping lidars generally use 1064 nm diode pumped YAG lasers, while bathymetric systems generally use 532 nm frequency doubled diode pumped YAG lasers because 532 nm penetrates water with much less attenuation than does 1064 nm. Laser settings include the laser repetition rate (which controls the data collection speed). Pulse length is generally an attribute of the laser cavity length, the number of passes required through the gain material (YAG, YLF, etc.), and Q-switch speed. Better target resolution is achieved with shorter pulses, provided the lidar receiver detectors and electronics have sufficient bandwidth.[4]
- Scanner and optics — How fast images can be developed is also affected by the speed at which they are scanned. There are several options to scan the azimuth and elevation, including dual oscillating plane mirrors, a combination with a polygon mirror, a dual axis scanner (see Laser scanning). Optic choices affect the angular resolution and range that can be detected. A hole mirror or a beam splitter are options to collect a return signal.
- Photodetector and receiver electronics — Two main photodetector technologies are used in lidars: solid state photodetectors, such as silicon avalanche photodiodes, or photomultipliers. The sensitivity of the receiver is another parameter that has to be balanced in a lidar design.
- Position and navigation systems — Lidar sensors that are mounted on mobile platforms such as airplanes or satellites require instrumentation to determine the absolute position and orientation of the sensor. Such devices generally include a Global Positioning System receiver and an Inertial Measurement Unit (IMU).
3D imaging can be achieved using both scanning and non-scanning systems. "3D gated viewing laser radar" is a non-scanning laser ranging system that applies a pulsed laser and a fast gated camera. Research has begun for virtual beam steering using DLP technology.
Imaging lidar can also be performed using arrays of high speed detectors and modulation sensitive detector arrays typically built on single chips using CMOS and hybrid CMOS/CCD fabrication techniques. In these devices each pixel performs some local processing such as demodulation or gating at high speed, downconverting the signals to video rate so that the array may be read like a camera. Using this technique many thousands of pixels / channels may be acquired simultaneously.[13] High resolution 3D lidar cameras use homodyne detection with an electronic CCD or CMOS shutter.[14]
A coherent imaging lidar uses synthetic array heterodyne detection to enable a staring single element receiver to act as though it were an imaging array.[15]
In 2014 Lincoln Laboratory announced a new imaging chip with more than 16,384 pixels, each able to image a single photon, enabling them to capture a wide area in a single image. An earlier generation of the technology with one-quarter as many pixels was dispatched by the U.S. military after the January 2010 Haiti earthquake; a single pass by a business jet at 3,000 meters (10,000 ft.) over Port-au-Prince was able to capture instantaneous snapshots of 600-meter squares of the city at 30 centimetres (12 in), displaying the precise height of rubble strewn in city streets. The new system is another 10x faster. The chip uses indium gallium arsenide (InGaAs), which operates in the infrared spectrum at a relatively long wavelength that allows for higher power and longer ranges. In many applications, such as self-driving cars, the new system will lower costs by not requiring a mechanical component to aim the chip. InGaAs uses less hazardous wavelengths than conventional silicon detectors, which operate at visual wavelengths.[16]
Types of applications
Lidar has a wide range of applications which can be divided into airborne and terrestrial types.[17] These different types of applications require scanners with varying specifications based on the data's purpose, the size of the area to be captured, the range of measurement desired, the cost of equipment, and more.
Airborne lidar
Airborne lidar (also airborne laser scanning) is when a laser scanner, while attached to a plane during flight, creates a 3D point cloud model of the landscape. This is currently the most detailed and accurate method of creating digital elevation models, replacing photogrammetry. One major advantage in comparison with photogrammetry is the ability to filter out reflections from vegetation from the point cloud model to create a digital surface model which represents ground surfaces such as rivers, paths, cultural heritage sites, etc., which are concealed by trees. Within the category of airborne lidar, there is sometimes a distinction made between high-altitude and low-altitude applications, but the main difference is a reduction in both accuracy and point density of data acquired at higher altitudes. Airborne lidar can also be used to create bathymetric models in shallow water.[18]
The main constituents of airborne lidar include all points, ground points, digital elevation models (DEM) and digital survey models (DSM). The points and ground points are the vectors of discrete points while DEM and DSM are interpolated raster grids of discrete points. The process also involves capturing of digital aerial photographs. In order to interpret deep seated landslides for example, under the cover of vegetation, scarps, tension cracks or tipped trees air borne lidar is used. Air borne lidar digital elevation models can see through the canopy of forest cover, perform detailed measurements of scarps, erosion and tilting of electric poles.[19]
Airborne lidar data is processed using a toolbox for lidar data filtering and terrain study software. The data is interpolated to digital terrain models using the software. The laser is directed at the region to be mapped and each point's height above the ground is calculated by subtracting the original z-coordinate from the corresponding digital terrain model elevation. Based on this height above the ground the non-vegetation data is obtained which may include objects such as buildings, electric power lines, flying birds etc. The rest of the points are treated as vegetation and used for modeling and mapping. Within each of these plots, lidar metrics are calculated by calculating statistics such as mean, standard deviation, skewness, percentiles, quadratic mean etc.[20]
Airborne lidar bathymetric technology
The airborne lidar bathymetric technological system involves the measurement of time of flight of a signal from a source to its return to the sensor. The data acquisition technique involves a sea floor mapping component and a ground truth component that includes video transects and sampling. It works using a near infrared laser beam. Two beams are projected onto a fast rotating mirror, which creates an array of points. One of the beams penetrates the water and also detects the bottom surface of the water under favorable conditions.
The data obtained shows the full extent of the land surface exposed above the sea floor. This technique is extremely useful as it will play an important role in the major sea floor mapping program. The mapping yields onshore topography as well as under water elevations. Sea floor reflectance imaging is another solution product from this system which can benefit mapping of underwater habitats. This technique has been used for three dimensional image mapping of California's waters using a hydrographic lidar.[21]
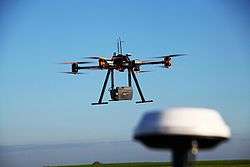
Drones are now being used with laser scanners, as well as other remote sensors, as a more economical method to scan smaller areas.[22] The possibility of drone remote sensing also eliminates any danger that crews of a manned aircraft may be subjected to in difficult terrain or remote areas.
Terrestrial lidar
Terrestrial applications of lidar (also terrestrial laser scanning) happen on the Earth's surface and can be both stationary or mobile. Stationary terrestrial scanning is most common as a survey method, for example in conventional topography, monitoring, cultural heritage documentation and forensics.[17] The 3D point clouds acquired from these types of scanners can be matched with digital images taken of the scanned area from the scanner's location to create realistic looking 3D models in a relatively short time when compared to other technologies. Each point in the point cloud is given the colour of the pixel from the image taken located at the same angle as the laser beam that created the point.
Mobile lidar (also mobile laser scanning) is when two or more scanners are attached to a moving vehicle to collect data along a path. These scanners are almost always paired with other kinds of equipment, including GNSS receivers and IMUs. One example application is surveying streets, where power lines, exact bridge heights, bordering trees, etc. all need to be taken into account. Instead of collecting each of these measurements individually in the field with a tachymeter, a 3D model from a point cloud can be created where all of the measurements needed can be made, depending on the quality of the data collected. This eliminates the problem of forgetting to take a measurement, so long as the model is available, reliable and has an appropriate level of accuracy.
Terrestrial lidar mapping involves a process of occupancy grid map generation. The process involves an array of cells divided into grids which employs a process to store the height values when lidar data falls into the respective grid cell. A binary map is then created by applying a particular threshold to the cell values for further processing. The next step is to process the radial distance and z-coordinates from each scan to identify which 3D points correspond to each of the specified grid cell leading to the process of data formation.[23]
Data Formation
For the autonomous applications a lidar with 3D scanner is used for obstacle detention and collision avoidance .The scanner measures radial distance at different angular resolutions. The lidar emits a single laser ray and uses an interior rotating mirror to distribute the laser ray covering a large field of view.[23]
Object Detection
The object detection procedure consists of three steps: Laser point feature calculation and prior filtering, 3D segmentation, Object classification and 2D position calculation. The features for segmentation are calculated in the vicinity of a fixed radial distance in 2D and 3D.These include:[23]
Amplitude density
This involves the percentage of points in the vicinity with amplitude values below a particular threshold. Points with a density lower than the threshold are removed from segmentation and further processing.[23]
Height above local minimum in 2D search radius
In this case the points which have a height lower than a certain threshold are removed. On segmentation of the point cloud, all the segments satisfying the object based criteria are included to individual objects.[23][23]
In transportation system to ensure vehicle and passenger safety and develop electronic systems that deliver driver assistance vehicle environment detection is essential. LIDAR system plays an important role in safety of transportation systems. Lots of electronic systems which add to the driver assistance and vehicle safety such as Adaptive Cruise Control (ACC), Emergency Brake Assist, Anti-lock Braking System (ABS) depend on detection of the vehicle environment to act autonomously or semi-autonomously. This is achieved by LIDAR mapping and estimation. Current LIDAR systems use rotating hexagonal mirrors which split the laser beam. The upper three beams are used for vehicle and obstacles ahead and the lower beams are used to detect lane markings and road features.[24] The major advantage of using LIDAR is that the spatial structure is obtained and this data can be fused with other sensors like RADAR etc. to get a better picture of the vehicle environment in terms of static and dynamic properties of the objects present in the environment.
Applications
There are a wide variety of applications for lidar, in addition to the applications listed below, as it is often mentioned in National lidar dataset programs.
Agriculture
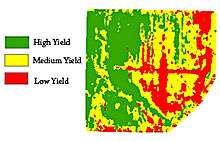
Lidar also can be used to help farmers determine which areas of their fields to apply costly fertilizer. Lidar can create a topographical map of the fields and reveals the slopes and sun exposure of the farm land. Researchers at the Agricultural Research Service blended this topographical information with the farmland yield results from previous years. From this information, researchers categorized the farm land into high-, medium-, or low-yield zones.[25] This technology is valuable to farmers because it indicates which areas to apply the expensive fertilizers to achieve the highest crop yield.
Another application of lidar beyond crop health and terrain mapping is crop mapping in orchards and vineyards. Vehicles equipped with lidar sensors can detect foliage growth to determine if pruning or other maintenance needs to take place, detect variations in fruit production, or perform automated tree counts.
Lidar is useful in GPS-denied situations, such as in nut and fruit orchards where GPS signals to farm equipment featuring precision agriculture technology or a driverless tractor may be partially or completely blocked by overhanging foliage. Lidar sensors can detect the edges of rows so that farming equipment can continue moving until GPS signal can be reestablished.
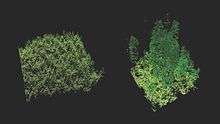
Plant species classification using a 3D Lidar sensor and machine learning.
This is a methodology for differentiating plant species using a 3d lidar sensor and machine learning. The procedure involves the application of logistic regression functions, support vector machines and neural networks.[26]
Algorithm Overview
The input to the system are 3D point clouds with range and reflectance values from a 3d laser sensor .The species of the plant is known by applying preprocessing techniques to provide the point cloud for further processing. If the species is already known then the extracted features are added as new data. The particular plant species is labeled and its features are initially stored as an example to identify the particular plant species in the real environment.[26]
Pre-processing
In this process, there are three steps. The first step is to identify the ground plane and the points returning from the ground plane are eliminated. In the second step the remaining points are grouped as one and the individual points are detected. The third step involves the identification of the plant species. An individual coordinate system is developed for each plant. The x and y coordinates are placed on the ground while the z-axis is along the center of the plant. In this way individual plants in row cultivations are separated. The next step is to identify the plant space.[26]
Feature extraction
To understand a set of features to identify the appearance of the plant species the criteria of size and rotation invariance of the 3D laser senior is used. It is divided into two groups: Reflectance and geometrical features[26]
Reflectance features
Plant species have different variations based on their reflectance values. It is an important tool for plant classification. The reflectance value encodes information about the leaf size and shape. For each of the measuring points a reflectance value between 0 and 1 are determined.[26]
Geometrical Features
The laser sensor also provides a range of data which can be transformed into 3d coordinates. Using the coordinates the shape, dimension and structure of the plant can be characterized.[26]
Classification
Classification of the plants is based on machine learning. For the learning process a training set is generated with known samples. Machine learning toolbox WEKA is used for this purpose.[26]
Tested plants
The training set is generated with the help of potted plants available in common nurseries. Different plant species is chosen and the corresponding plant cloud is developed. Besides the plant the ground coordinate system is also sensed to determine the plant coordinate system that is essential for feature calculation.[26]
Archaeology
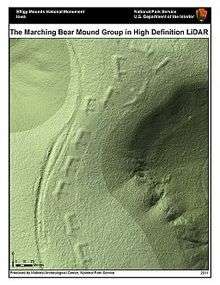
Lidar has many applications in the field of archaeology including aiding in the planning of field campaigns, mapping features beneath forest canopy, and providing an overview of broad, continuous features that may be indistinguishable on the ground.[27] Lidar can also provide archaeologists with the ability to create high-resolution digital elevation models (DEMs) of archaeological sites that can reveal micro-topography that are otherwise hidden by vegetation. Lidar-derived products can be easily integrated into a Geographic Information System (GIS) for analysis and interpretation. For example, at Fort Beauséjour - Fort Cumberland National Historic Site, Canada, previously undiscovered archaeological features below forest canopy have been mapped that are related to the siege of the Fort in 1755. Features that could not be distinguished on the ground or through aerial photography were identified by overlaying hillshades of the DEM created with artificial illumination from various angles. With lidar, the ability to produce high-resolution datasets quickly and relatively cheaply can be an advantage. Beyond efficiency, its ability to penetrate forest canopy has led to the discovery of features that were not distinguishable through traditional geo-spatial methods and are difficult to reach through field surveys, as in work at Caracol by Arlen Chase and his wife Diane Zaino Chase.[28] The intensity of the returned signal can be used to detect features buried under flat vegetated surfaces such as fields, especially when mapping using the infrared spectrum. The presence of these features affects plant growth and thus the amount of infrared light reflected back.[29] In 2012, lidar was used by a team attempting to find the legendary city of La Ciudad Blanca in the Honduran jungle. During a seven-day mapping period, they found evidence of extensive man-made structures that had eluded ground searches for hundreds of years.[30] In June 2013 the rediscovery of the city of Mahendraparvata was announced.[31] In another study, lidar was used to reveal stone walls, building foundations, abandoned roads, and other features of the landscape in southern New England, USA that had been obscured in aerial photography by the region's dense forest canopy.[32][33][34] In May 2012, lidar was used to locate a previously unknown ruined city in the La Mosquitia region of Honduras.[35]
Autonomous vehicles

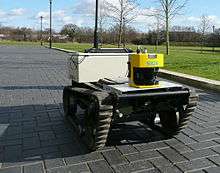
Autonomous vehicles use lidar for obstacle detection and avoidance to navigate safely through environments, using rotating laser beams.[36] Cost map or point cloud outputs from the lidar sensor provide the necessary data for robot software to determine where potential obstacles exist in the environment and where the robot is in relation to those potential obstacles. Singapore's Singapore-MIT Alliance for Research and Technology (SMART) is actively developing technologies for autonomous lidar vehicles.[37] Examples of companies that produce lidar sensors commonly used in robotics or vehicle automation are Sick[38] and Hokuyo.[39] Examples of obstacle detection and avoidance products that leverage lidar sensors are the Autonomous Solution, Inc. Forecast 3D Laser System[40] and Velodyne HDL-64E.[41]
The very first generations of automotive adaptive cruise control systems used only lidar sensors.
Description of existing approaches of LIDAR processing
Below mentioned are various approaches of processing LIDAR data and utilizing it along with data from other sensors through sensor fusion to detect the vehicle environment conditions.

GRID based processing using 3D LIDAR and fusion with RADAR measurement
In this method, proposed by Philipp Lindner and Gerd Wanielik,[42] a combination of 2 and 3-dimensional grid structure is tessellated in to several discrete cells. This way huge amount of raw measurement data can be handled effectively by collecting them in spatial containers, which are the cells of the evidence grid. Each cell is associated with a probability measure that identifies the cell occupation. A 2-dimensional grid cannot observe the space behind the object. That's why state of occupancy is unknown - it cannot be determined by this kind of sensor, whether another object is located behind the first one or not hence the unknown state is assigned a probability of 0.5. By introducing the third transferring them into the 3 dimensional grid the spatial configuration of an object could be mapped into the grid structure up to a certain complexity. The grid cells which are occupied will possess a probability greater than 0.5 and the cells which are not occupied will possess a probability less than 0.5. But for this method the grid profile must be defined. The grid cells touched by the laser beam when transmitted are calculated by applying Bresenham's line algorithm. To obtain the spatial extended structure a connected component analysis of these cells is performed. This information is then passed on to rotating caliper algorithm to obtain the spatial characteristics of the object.
In addition to the LIDAR detection, RADAR data obtained by using two short range radars is integrated to get the dynamic properties such as velocity of the object. The measurements are assigned to the object using potential distance function.
Fusion of 3D LIDAR and color camera for multiple object detection and tracking
The framework proposed in this method by Soonmin Hwang et al.,[43] is split into four steps. First, the data from camera and 3D LIDAR is given as input to the system. The first input is the 3D point cloud from LIDAR and the second input is the color image and to improve the efficiency, horizontal 3D point sampling is applied as pre-processing. Second, the segmentation stage is where the entire 3D points are divided into several groups per the distance from the sensor and local planes from close plane to far plane are sequentially estimated. The local planes are estimated using statistical analysis. Group of points closer to the sensor are used to compute initial plane. By using the current local plane, the next local plane is estimated by iterative update. The object proposal in 2D image is used to separate foreground objects from background. For faster and accurate detection and tracking Binarized Normed Gradients for Objectness Estimation at 300fps is used.[44] This is further grouped, 3D point clustering, to form objects. Clustering is done using DBSCAN (Density-Based Spatial Clustering of Applications with Noise) algorithm which could be robust due to its less-parametric characteristic. Using the clustered 3D points, i.e. 3D segment, more accurate region-of-interests (RoIs) by projecting them on the 2D image, are generated. The third step is detection, which is broadly divided into two parts. First is object detection in 2D image which is achieved using Fast R-CNN[45] as this method doesn’t need training and it also considers an image and several regions of interest. Second is object detection in 3D space which is done by using spin image method.[46] This method extracts local and global histograms to represent a certain object. To merge the results of 2D image and 3D space object detection, same 3D region is considered and two independent classifiers are applied. Scores calibration[47] is done to get a single confidence score from both detectors. This single score is obtained in the form of probability. The final step is tracking. This is done by associating moving objects in present and past frame. For object tracking, segment matching is adopted. Features such as mean, standard deviation, quantized color histograms, volume size and number of 3D points of a segment are computed. Euclidean distance is used to measure differences between segments. To judge the appearance and disappearance of an object, similar segments from two different frames are taken and the physical distance and dissimilarity scores are calculated. If the scores go beyond a range for every segment in previous frame, the object being tracked is disappeared.
Obstacle detection and road environment recognition using LIDAR
This method proposed by Kun Zhou et al.[48] not only focuses on object detection and tracking but also recognizes lane marking and road features. As mentioned earlier the LIDAR systems use rotating hexagonal mirrors which split the laser beam into 6 beams. The upper 3 layers are used to detect the forward objects such as vehicles and roadside objects. The data detected by LIDAR are clustered to several segments and tracked by Kalman filter. Data clustering here is done based on characteristics of each segment based on object model, which distinguish different objects such as vehicles, signboards etc. These characteristics are the dimensions of the object etc. The reflectors on the rear edges of vehicles are used to differentiate vehicles from other objects. Object tracking is done using 2-stage Kalman filter to this algorithm considering the stability of tracking and the accelerated motion of objects[24]
LIDAR reflective intensity data is also used for curb detection by making use of robust regression to deal with occlusions and the road marking is detected using modified Otsu method by distinguishing rough and shiny surfaces.[49]
Advantages
Spatial structure of the obstacles can be identified using LIDAR measurements. This helps distinguish objects based on size and estimate the impact of driving over it.[42]
LIDAR system provides better range and a large field of view which helps detecting obstacles on the curves. This is one major advantage over RADAR systems which has a narrow field of view.
Fusion of LIDAR measurement with different sensors makes the system robust and useful in real-time applications as LIDAR dependent system will not be able to estimate the dynamic information about the detected object.[42]
It has been shown that lidar can be manipulated, such that self-driving cars are tricked into taking evasive action.[50]
Biology and conservation
Lidar has also found many applications in forestry. Canopy heights, biomass measurements, and leaf area can all be studied using airborne lidar systems. Similarly, lidar is also used by many industries, including Energy and Railroad, and the Department of Transportation as a faster way of surveying. Topographic maps can also be generated readily from lidar, including for recreational use such as in the production of orienteering maps.[51]
In addition, the Save-the-Redwoods League is undertaking a project to map the tall redwoods on the Northern California coast. Lidar allows research scientists to not only measure the height of previously unmapped trees but to determine the biodiversity of the redwood forest. Stephen Sillett, who is working with the League on the North Coast lidar project, claims this technology will be useful in directing future efforts to preserve and protect ancient redwood trees.[52]
Geology and soil science
High-resolution digital elevation maps generated by airborne and stationary lidar have led to significant advances in geomorphology (the branch of geoscience concerned with the origin and evolution of the Earth surface topography). The lidar abilities to detect subtle topographic features such as river terraces and river channel banks, to measure the land-surface elevation beneath the vegetation canopy, to better resolve spatial derivatives of elevation, and to detect elevation changes between repeat surveys have enabled many novel studies of the physical and chemical processes that shape landscapes.[53] In 2005 the Tour Ronde in the Mont Blanc massif became the first high alpine mountain on which lidar was employed to monitor the increasing occurrence of severe rock-fall over large rock faces allegedly caused by climate change and degradation of permafrost at high altitude.[54]
In geophysics and tectonics, a combination of aircraft-based lidar and GPS has evolved into an important tool for detecting faults and for measuring uplift. The output of the two technologies can produce extremely accurate elevation models for terrain - models that can even measure ground elevation through trees. This combination was used most famously to find the location of the Seattle Fault in Washington, United States.[55] This combination also measures uplift at Mt. St. Helens by using data from before and after the 2004 uplift.[56] Airborne lidar systems monitor glaciers and have the ability to detect subtle amounts of growth or decline. A satellite-based system, the NASA ICESat, includes a lidar sub-system for this purpose. The NASA Airborne Topographic Mapper[57] is also used extensively to monitor glaciers and perform coastal change analysis. The combination is also used by soil scientists while creating a soil survey. The detailed terrain modeling allows soil scientists to see slope changes and landform breaks which indicate patterns in soil spatial relationships.
Atmospheric remote sensing and meteorology
Initially based on ruby lasers, lidar for meteorological applications was constructed shortly after the invention of the laser and represent one of the first applications of laser technology. Lidar technology has since expanded vastly in capability and lidar systems are used to perform a range of measurements that include profiling clouds, measuring winds, studying aerosols and quantifying various atmospheric components. Atmospheric components can in turn provide useful information including surface pressure (by measuring the absorption of oxygen or nitrogen), greenhouse gas emissions (carbon dioxide and methane), photosynthesis (carbon dioxide), fires (carbon monoxide) and humidity (water vapor). Atmospheric lidars can be either ground-based, airborne or satellite depending on the type of measurement.
Atmospheric lidar remote sensing works in two ways -
- by measuring backscatter from the atmosphere, and
- by measuring the scattered reflection off the ground (when the lidar is airborne) or other hard surface.
Backscatter from the atmosphere directly gives a measure of clouds and aerosols. Other derived measurements from backscatter such as winds or cirrus ice crystals require careful selecting of the wavelength and/or polarization detected. Doppler Lidar and Rayleigh Doppler Lidar are used to measure temperature and/or wind speed along the beam by measuring the frequency of the backscattered light. The Doppler broadening of gases in motion allows the determination of properties via the resulting frequency shift.[58][59] Scanning lidars, such as the conical-scanning NASA HARLIE LIDAR, have been used to measure atmospheric wind velocity.[60] The ESA wind mission ADM-Aeolus will be equipped with a Doppler lidar system in order to provide global measurements of vertical wind profiles.[61] A doppler lidar system was used in the 2008 Summer Olympics to measure wind fields during the yacht competition.[62]
Doppler lidar systems are also now beginning to be successfully applied in the renewable energy sector to acquire wind speed, turbulence, wind veer and wind shear data. Both pulsed and continuous wave systems are being used. Pulsed systems use signal timing to obtain vertical distance resolution, whereas continuous wave systems rely on detector focusing.
The term eolics has been proposed to describe the collaborative and interdisciplinary study of wind using computational fluid mechanics simulations and Doppler lidar measurements.[63]
The ground reflection of an airborne lidar gives a measure of surface reflectivity (assuming the atmospheric transmittance is well known) at the lidar wavelength. However, the ground reflection is typically used for making absorption measurements of the atmosphere. "Differential absorption lidar" (DIAL) measurements utilize two or more closely spaced (<1 nm) wavelengths to factor out surface reflectivity as well as other transmission losses, since these factors are relatively insensitive to wavelength. When tuned to the appropriate absorption lines of a particular gas, DIAL measurements can be used to determine the concentration (mixing ratio) of that particular gas in the atmosphere. This is referred to as an Integrated Path Differential Absorption (IPDA) approach, since it is a measure of the integrated absorption along the entire lidar path. IPDA lidars can be either pulsed[64][65] or CW[66] and typically use two or more wavelengths.[67] IPDA lidars have been used for remote sensing of carbon dioxide[64][65][66] and methane.[68]
Synthetic array lidar allows imaging lidar without the need for an array detector. It can be used for imaging Doppler velocimetry, ultra-fast frame rate (MHz) imaging, as well as for speckle reduction in coherent lidar.[15] An extensive lidar bibliography for atmospheric and hydrospheric applications is given by Grant.[69]
Scheimpflug principles
Another lidar technique for atmospheric remote sensing has emerged. It is based on Scheimpflug principles referred to as scheimpflug lidar (slidar).
"The implication of the Scheimpflug principle is that when a laser beam is transmitted into the atmosphere, the backscattering echo of the entire illuminating probe volume is still in focus simultaneously without diminishing the aperture as long as the object plane, image plane and the lens plane intersect with each other".[70] A two dimensional ccd/cmos camera is used to resolve the backscattering echo of the transmitted laser beam. Thus as in the case of conventional lidar technologies continuous wave light sources such as diode lasers can be employed for remote sensing instead of using complicated nano second pulse light sources.[70]
Law enforcement
Lidar speed guns are used by the police to measure the speed of vehicles for speed limit enforcement purposes.[71]
Military
Few military applications are known to be in place and are classified (like the lidar-based speed measurement of the AGM-129 ACM stealth nuclear cruise missile), but a considerable amount of research is underway in their use for imaging. Higher resolution systems collect enough detail to identify targets, such as tanks. Examples of military applications of lidar include the Airborne Laser Mine Detection System (ALMDS) for counter-mine warfare by Areté Associates.[72]
A NATO report (RTO-TR-SET-098) evaluated the potential technologies to do stand-off detection for the discrimination of biological warfare agents. The potential technologies evaluated were Long-Wave Infrared (LWIR), Differential Scattering (DISC), and Ultraviolet Laser Induced Fluorescence (UV-LIF). The report concluded that : Based upon the results of the lidar systems tested and discussed above, the Task Group recommends that the best option for the near-term (2008–2010) application of stand-off detection systems is UV LIF .[73] However, in the long-term, other techniques such as stand-off Raman spectroscopy may prove to be useful for identification of biological warfare agents.
Short-range compact spectrometric lidar based on Laser-Induced Fluorescence (LIF) would address the presence of bio-threats in aerosol form over critical indoor, semi-enclosed and outdoor venues like stadiums, subways, and airports. This near real-time capability would enable rapid detection of a bioaerosol release and allow for timely implementation of measures to protect occupants and minimize the extent of contamination.[74]
The Long-Range Biological Standoff Detection System (LR-BSDS) was developed for the US Army to provide the earliest possible standoff warning of a biological attack. It is an airborne system carried by a helicopter to detect man-made aerosol clouds containing biological and chemical agents at long range. The LR-BSDS, with a detection range of 30 km or more, was fielded in June 1997.[75] Five lidar units produced by the German company Sick AG were used for short range detection on Stanley, the autonomous car that won the 2005 DARPA Grand Challenge.
A robotic Boeing AH-6 performed a fully autonomous flight in June 2010, including avoiding obstacles using lidar.[76][77]
Mining
Lidar is used in the mining industry for various tasks. The calculation of ore volumes is accomplished by periodic (monthly) scanning in areas of ore removal, then comparing surface data to the previous scan.[78]
Lidar sensors may also be used for obstacle detection and avoidance for robotic mining vehicles such as in the Komatsu Autonomous Haulage System (AHS)[79] used in Rio Tinto's Mine of the Future.
Physics and astronomy
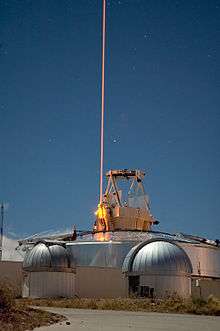
A worldwide network of observatories uses lidars to measure the distance to reflectors placed on the moon, allowing the position of the moon to be measured with mm precision and tests of general relativity to be done. MOLA, the Mars Orbiting Laser Altimeter, used a lidar instrument in a Mars-orbiting satellite (the NASA Mars Global Surveyor) to produce a spectacularly precise global topographic survey of the red planet.
In September, 2008, the NASA Phoenix Lander used lidar to detect snow in the atmosphere of Mars.[80]
In atmospheric physics, lidar is used as a remote detection instrument to measure densities of certain constituents of the middle and upper atmosphere, such as potassium, sodium, or molecular nitrogen and oxygen. These measurements can be used to calculate temperatures. Lidar can also be used to measure wind speed and to provide information about vertical distribution of the aerosol particles.[81]
At the JET nuclear fusion research facility, in the UK near Abingdon, Oxfordshire, lidar Thomson Scattering is used to determine Electron Density and Temperature profiles of the plasma.[82]
Rock mechanics
LiDAR has been widely used in rock mechanics for rock mass characterization and slope change detection. Some important geomechanical properties from the rock mass can be extracted from the 3D point clouds obtained by means of the LiDAR. Some of these properties are:
- Discontinuity orientation [83][84][85]
- Discontinuity spacing and RQD [85][86][87]
- Discontinuity aperture
- Discontinuity persistence [85][87]
- Discontinuity roughness [87]
- Water infiltration
Some of these properties have be used to assess the geomechanical quality of the rock mass through the RMR index. Moreover, as the orientations of discontinuities can be extracted using the existing methodologies, it is possible to assess the geomechanical quality of a rock slope through the SMR index.[88] In addition to this, the comparison of different 3D point clouds from a slope acquired at different times allows to study the changes produced on the scene during this time interval as a result of rockfalls or any other landsliding processes.[89][90]
Robotics
Lidar technology is being used in robotics for the perception of the environment as well as object classification.[91] The ability of lidar technology to provide three-dimensional elevation maps of the terrain, high precision distance to the ground, and approach velocity can enable safe landing of robotic and manned vehicles with a high degree of precision.[92] Refer to the Military section above for further examples.
Spaceflight
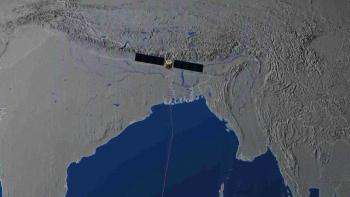
Lidar is increasingly being utilized for rangefinding and orbital element calculation of relative velocity in proximity operations and stationkeeping of spacecraft. Lidar has also been used for atmospheric studies from space. Short pulses of laser light beamed from a spacecraft can reflect off of tiny particles in the atmosphere and back to a telescope aligned with the spacecraft laser. By precisely timing the lidar 'echo,' and by measuring how much laser light is received by the telescope, scientists can accurately determine the location, distribution and nature of the particles. The result is a revolutionary new tool for studying constituents in the atmosphere, from cloud droplets to industrial pollutants, that are difficult to detect by other means."[93][94]
Surveying

Airborne lidar sensors are used by companies in the remote sensing field. They can be used to create a DTM (Digital Terrain Model) or DEM (Digital Elevation Model); this is quite a common practice for larger areas as a plane can acquire 3–4 km wide swaths in a single flyover. Greater vertical accuracy of below 50 mm can be achieved with a lower flyover, even in forests, where it is able to give the height of the canopy as well as the ground elevation. Typically, a GNSS receiver configured over a georeferenced control point is needed to link the data in with the WGS (World Geodetic System).[95]
Transport
LiDAR has been used in the railroad industry to generate asset health reports for asset management and by departments of transportation to assess their road conditions. CivilMaps.com is a leading company in the field.[96] Lidar has been used in adaptive cruise control (ACC) systems for automobiles. Systems such as those by Siemens and Hella use a lidar device mounted on the front of the vehicle, such as the bumper, to monitor the distance between the vehicle and any vehicle in front of it.[97] In the event the vehicle in front slows down or is too close, the ACC applies the brakes to slow the vehicle. When the road ahead is clear, the ACC allows the vehicle to accelerate to a speed preset by the driver. Refer to the Military section above for further examples.
Wind farm optimization
Lidar can be used to increase the energy output from wind farms by accurately measuring wind speeds and wind turbulence.[98][99] Experimental lidar systems[100][101] can be mounted on the nacelle[102] of a wind turbine or integrated into the rotating spinner[103] to measure oncoming horizontal winds,[104] winds in the wake of the wind turbine,[105] and proactively adjust blades to protect components and increase power. Lidar is also used to characterise the incident wind resource for comparison with wind turbine power production to verify the performance of the wind turbine[106] by measuring the wind turbine's power curve.[107] Wind farm optimization can be considered a topic in applied eolics.
Solar photovoltaic deployment optimization
Lidar can also be used to assist planners and developers in optimizing solar photovoltaic systems at the city level by determining appropriate roof tops[108][109] and for determining shading losses.[110] Recent works focus on buildings' facades solar potential estimation,[111] or by incorporating more detailed shading losses by considering the influence from vegetation and larger surrounding terrain.[112]
Video games
Racing game iRacing features scanned tracks, resulting in bumps with millimeter precision in the in-game 3D mapping environment.
Other uses
The video for the song "House of Cards" by Radiohead was believed to be the first use of real-time 3D laser scanning to record a music video. The range data in the video is not completely from a lidar, as structured light scanning is also used.[113]
Alternative technologies
Recent development of Structure From Motion (SFM) technologies allows delivering 3D images and maps based on data extracted from visual and IR photography. The elevation or 3D data is extracted using multiple parallel passes over mapped area, yielding both visual light image and 3D structure from the same sensor, which is often a specially chosen and calibrated digital camera.
See also
- Atomic line filter
- CLidar
- Laser rangefinder
- libLAS, a BSD-licensed C++ library for reading/writing ASPRS LAS LiDAR data
- Lidar detector
- List of laser articles
- National lidar dataset (all countries)
- National Lidar Dataset (United States)
- Optech
- Optical time-domain reflectometer
- Range imaging
- Satellite laser ranging
- SODAR
- Sonar
- Time-domain reflectometry
- TopoFlight
References
- 1 2 "LIDAR—Light Detection and Ranging—is a remote sensing method used to examine the surface of the Earth". NOAA. Archived from the original on June 4, 2013. Retrieved June 4, 2013.
- 1 2 Oxford English Dictionary. 2013. p. Entry for "lidar".
- 1 2 James Ring, "The Laser in Astronomy." p. 672–673, New Scientist Jun 20, 1963
- 1 2 3 4 5 Cracknell, Arthur P.; Hayes, Ladson (2007) [1991]. Introduction to Remote Sensing (2 ed.). London: Taylor and Francis. ISBN 0-8493-9255-1. OCLC 70765252.
- ↑ Goyer, G. G.; R. Watson (September 1963). "The Laser and its Application to Meteorology". Bulletin of the American Meteorological Society. 44 (9): 564–575 [568].
- ↑ "New Artillery Against Smog: TV and Lidar" Popular Mechanics, April 1970, p. 104.
- ↑ "Light Detection and Ranging". Ngs.noaa.gov. 2011-04-15. Retrieved 2016-02-22.
- ↑ US 20090273770 patent
- ↑ "CLICK". Lidar.cr.usgs.gov. 2015-09-16. Retrieved 2016-02-22.
- ↑ Carter, Jamie; Keil Schmid; Kirk Waters; Lindy Betzhold; Brian Hadley; Rebecca Mataosky; Jennifer Halleran (2012). "Lidar 101: An Introduction to Lidar Technology, Data, and Applications." (NOAA) Coastal Services Center" (PDF). Coast.noaaa.gov. p. 14. Retrieved 2016-02-22.
- ↑ 'Experimental Advanced Advanced Research Lidar', USGS.gov. Retrieved 8 August 2007.
- ↑ Amzajerdian, Farzin; Pierrottet, Diego F.; Petway, Larry B.; Hines, Glenn D.; Roback, Vincent E. "Lidar Systems for Precision Navigation and Safe Landing on Planetary Bodies". Langel Research Center. NASA. Retrieved May 24, 2011.
- ↑ Medina, Antonio. "Three Dimensional Camera and Rangefinder". January 1992. United States Patent 5081530.
- ↑ Medina A, Gayá F, Pozo F (2006). "Compact laser radar and three-dimensional camera". J. Opt. Soc. Am. A. 23: 800–805. Bibcode:2006JOSAA..23..800M. doi:10.1364/josaa.23.000800.
- 1 2 Strauss, C. E. M. (1994). "Synthetic-array heterodyne detection: a single-element detector acts as an array". Opt. Lett. 19: 1609–1611. Bibcode:1994OptL...19.1609S. doi:10.1364/ol.19.001609.
- ↑ Talbot, David (2014-02-13). "New Optical Chip Will Sharpen Military and Archeological Aerial Imaging | MIT Technology Review". Technologyreview.com. Retrieved 2014-02-17.
- 1 2 Vosselman, George; Maas, Hans-Gerd (2012). Airborne and terrestrial laser scanning. Whittles Publishing. ISBN 978-1-904445-87-6.
- ↑ Doneus, M.; Miholjek, I.; Mandlburger, G.; Doneus, N.; Verhoeven, G.; Briese, Ch.; Pregesbauer, M. "Airborne laser bathymetry for documentation of submerged archaeological sites in shallow water". ISPRS - International Archives of the Photogrammetry, Remote Sensing and Spatial Information Sciences. XL-5/W5: 99–107. Bibcode:2015ISPArXL55...99D. doi:10.5194/isprsarchives-xl-5-w5-99-2015.
- ↑ Chiu, Cheng-Lung; Fei, Li-Yuan; Liu, Jin-King; Wu, Ming-Chee. "National Airborne Lidar Mapping and Examples for applications in deep seated landslides in Taiwan". Geoscience and Remote Sensing Symposium (IGARSS), 2015 IEEE International. ISSN 2153-7003.
- ↑ Yuan, Zeng; Yujin, Zhao; Dan, Zhao; Bingfang, Wu. "Forest Biodiversity mapping using airborne and hyper-spectral data". Geoscience and Remote Sensing Symposium (IGARSS), 2016 IEEE International,. ISSN 2153-7003.
- ↑ C. Wilson, Jerry. "Using Airborne hydrographic lidar to support mapping of California's waters". OCEANS 2008 - MTS/IEEE Kobe Techno-Ocean, ISBN 978-1-4244-2126-8.
- ↑ Tang, Lina; Shao, Guofan (2015-06-21). "Drone remote sensing for forestry research and practices". Journal of Forestry Research. 26 (4): 791–797. doi:10.1007/s11676-015-0088-y. ISSN 1007-662X.
- 1 2 3 4 5 6 Lee, Sang-Mook; Joon Im, Jeong; Lee, Bo-Hee; Leonessa, Alexander; Kurdila, Andrew. "A real time grid-map generation and object classification for ground based 3D lidar data using image analysis techniques". Image Processing (ICIP), 2010 17th IEEE International Conference on image processing,. ISSN 1522-4880.
- 1 2 Takagi, Kiyokazu; Morikawa, Katsuhiro; Ogawa, Takashi; Saburi, Makoto (2006). "Road Environment Recognition Using On-vehicle LIDAR". IEEE Intelligent Vehicles Symposium. ISBN 4-901122-86-X.
- ↑ "ARS Study Helps Farmers Make Best Use of Fertilizers". USDA Agricultural Research Service. June 9, 2010.
- 1 2 3 4 5 6 7 8 Weiss, Ulrich; Biber, Peter; Laible, Stefan; Bohlmann, Karsten; Zell, Andreas (2010). "Plant Species Classification using a 3D LIDAR Sensor and Machine Learning". Ninth International Conference on Machine Learning and Applications (ICMLA). ISBN 978-1-4244-9211-4.
- ↑ "EID; crater beneath canopy". Unb.ca. 2013-02-18. Retrieved 2013-05-06.
- ↑ John Nobel Wilford (2010-05-10). "Mapping Ancient Civilization, in a Matter of Days". New York Times. Retrieved 2010-05-11.
- ↑ The Light Fantastic: Using airborne lidar in archaeological survey. English Heritage. 2010. p. 45.
- ↑ Stephanie Pappas (May 15, 2013). "Ruins of Lost City May Lurk Deep in Honduras Rain Forest". Live Science. Retrieved May 15, 2013.
- ↑ "Jungle surrenders its lost city". Smh.com.au. Retrieved 2016-02-22.
- ↑ "Rediscovering the lost archaeological landscape of southern New England using airborne light detection and ranging (LiDAR)". Journal of Archaeological Science. 43: 9–20. doi:10.1016/j.jas.2013.12.004. Retrieved 2016-02-22.
- ↑ Edwin Cartlidge. "Lasers Unearth Lost 'Agropolis' of New England | Science | AAAS". News.sciencemag.org. Retrieved 2016-02-22.
- ↑ ""Lost" New England Revealed by High-Tech Archaeology". News.nationalgeographic.com. 2014-01-03. Retrieved 2016-02-22.
- ↑ Douglas Preston (2 Mar 2015). "Lost City Discovered in the Honduran Rain Forest". National Geographic. Retrieved 3 March 2015.
- ↑ By Steve Taranovich, EDN. "Autonomous automotive sensors: How processor algorithms get their inputs." July 5, 2016. Retrieved August 9, 2016.
- ↑ "Filipino turns ordinary car into autonomous vehicle - Motioncars | Motioncars". Motioncars.inquirer.net. 2015-05-25. Retrieved 2016-02-22.
- ↑ "Sick Senor Intelligence product portfolio". 2014-11-12. Retrieved 2014-11-12.
- ↑ "Hokuyo scanning range finder". 2014-11-12. Retrieved 2014-11-12.
- ↑ "Autonomous Solutions Forecast 3D Laser System". 2013-01-24. Retrieved 2013-05-06.
- ↑ "Products". Velodynelidar.com. Retrieved 2016-02-22.
- 1 2 3 Lindner, Philipp; Wanielik, Gerd (2009). "3D LIDAR Processing for Vehicle Safety and Environment Recognition". IEEE Workshop on Computational Intelligence in Vehicles and Vehicular Systems. ISBN 978-1-4244-2770-3.
- ↑ Hwang, Soonmin; Kim, Namil; Choi, Yukyung; Lee, Seokju; So Kweon, In (2016). "Fast Multiple Objects Detection and Tracking Fusing Color Camera and 3D LIDAR for Intelligent Vehicles". 13th International Conference on Ubiquitous Robots and Ambient Intelligence (URAI). ISBN 978-1-5090-0821-6.
- ↑ Cheng, Ming-Ming; Zhang, Ziming; Lin, Wen-Yan; Torr, Philip (2014). "BING: Binarized normed gradients for objectness estimation at 300fps". IEEE Conference on Computer Vision and Pattern Recognition (CVPR). ISBN 978-1-4799-5118-5.
- ↑ Girshick, Ross (2015). "Fast R-CNN". IEEE International Conference on Computer Vision (ICCV). ISBN 978-1-4673-8391-2.
- ↑ E. Johnson, Andrew; Hebert, Martial (1999). "Using spin images for efficient object recognition in cluttered 3D scenes". IEEE Transactions on Pattern Analysis and Machine Intelligence (TPAMI). ISSN 0162-8828.
- ↑ Xu, Philippe; Davoine, Franck; Denoeux, Thierry (September 2014). "Evidential combination of pedestrian detectors". Proceedings British Machine Vision Conference, BMVA Press.
- ↑ Zhou, Kun; Wang, Xiqin; Tomizukat, Masayoshi; Zhang, Wei-Bin; Chant, Ching-Yao (2002). "A New Manoeuvring Target Tracking Algorithm with Input Estimation". Proceedings of the 2002 American Control Conference. ISBN 0-7803-7298-0.
- ↑ Y. Hata, Alberto; F. Wolf, Denis. "Feature Detection for Vehicle Localization in Urban Environments Using a Multilayer LIDAR". IEEE Transactilns on Intelligent Transportation Systems. 17 (2). ISSN 1558-0016.
- ↑ https://www.theguardian.com/technology/2015/sep/07/hackers-trick-self-driving-cars-lidar-sensor
- ↑ "Lidar Links of Use in Mapping". Lidarbasemaps.org. Retrieved 2016-02-22.
- ↑ Councillor Quarterly, Summer 2007 Volume 6 Issue 3
- ↑ Hughes, M. W.; Quigley, M. C; van Ballegooy, S.; Deam, B. L.; Bradley, B. A.; Hart, D. E. (2015). "The sinking city: Earthquakes increase flood hazard in Christchurch, New Zealand". GSA Today. 25 (3): 4–10. Retrieved 2016-02-22.
- ↑ Rabatel, Antoine; Deline, Philip; Jaillet, Ste'phane; Ravanel, Ludovic (28 May 2008). "Rock falls in high-alpine rock walls quantified by terrestrial lidar measurements: A case study in the Mont Blanc area". Geophysical Research Letters. 35. Bibcode:2008GeoRL..3510502R. doi:10.1029/2008GL033424. Retrieved 4 December 2015.
- ↑ "LIDAR shows where earthquake risks are highest". Seattlepi.com. 2001-04-17. Retrieved 2016-02-22.
- ↑ 'Mount Saint Helens LIDAR Data', Washington State Geospatial Data Archive (September 13, 2006). Retrieved 8 August 2007.
- ↑ 'Airborne Topographic Mapper', NASA.gov. Retrieved 8 August 2007.
- ↑ "Lecture 14 : Principles of active remote sensing: Lidars and lidar sensing of aerosols, gases and clouds." (PDF). Laser-distance-measurer.com. Retrieved 2016-02-22.
- ↑ Li,, T. (2011). "Middle atmosphere temperature trend and solar cycle revealed by long-term Rayleigh lidar observations". J. Geophys. Res. 116. Bibcode:2011JGRD..116.0P05L. doi:10.1029/2010jd015275.
- ↑ Thomas D. Wilkerson, Geary K. Schwemmer, and Bruce M. Gentry. LIDAR Profiling of Aerosols, Clouds, and Winds by Doppler and Non-Doppler Methods, NASA International H2O Project (2002).
- ↑ 'Earth Explorers: ADM-Aeolus', ESA.org (European Space Agency, 6 June 2007). Retrieved 8 August 2007.
- ↑ 'Doppler lidar gives Olympic sailors the edge', Optics.org (3 July, 2008). Retrieved 8 July 2008.
- ↑ Clive, P. J. M., The emergence of eolics, TEDx University of Strathclyde (2014). Retrieved 9 May 2014.
- 1 2 Koch, Grady J.; Barnes, Bruce W; Petros, Mulugeta; Beyon, Jeffrey Y; Amzajerdian, Farzin; Yu, Jirong; Davis, Richard E; Ismail, Syed; Vay, Stephanie; Kavaya, Michael J; Singh, Upendra N. "Coherent Differential Absorption Lidar Measurements of CO2". Applied Optics. 43 (26): 5092–5099. Bibcode:2004ApOpt..43.5092K. doi:10.1364/AO.43.005092.
- 1 2 Abshire, James B.; Ramanathan, Anand; Riris, Haris; Mao, Jianping; Allan, Graham R.; Hasselbrack, William E.; Weaver, Clark J.; Browell, Edward V. (2013-12-30). "Airborne Measurements of CO2 Column Concentration and Range Using a Pulsed Direct-Detection IPDA Lidar". Remote Sensing. 6 (1): 443–469. doi:10.3390/rs6010443.
- 1 2 Campbell, Joel F. "Nonlinear swept frequency technique for CO2 measurements using a CW laser system". Applied Optics. 52 (13): 3100–3107. arXiv:1303.4933
 . Bibcode:2013ApOpt..52.3100C. doi:10.1364/AO.52.003100.
 - ↑ Dobler, Jeremy T.; Harrison, F. Wallace; Browell, Edward V.; Lin, Bing; McGregor, Doug; Kooi, Susan; Choi, Yonghoon; Ismail, Syed. "Atmospheric CO2 column measurements with an airborne intensity-modulated continuous wave 1.57 μm fiber laser lidar". Applied Optics. 52 (12): 2874–2892. Bibcode:2013ApOpt..52.2874D. doi:10.1364/AO.52.002874.
- ↑ Riris, Haris; Numata, Kenji; Li, Steve; Wu, Stewart; Ramanathan, Anand; Dawsey, Martha; Mao, Jianping; Kawa, Randolph; Abshire, James B. (2012-12-01). "Airborne measurements of atmospheric methane column abundance using a pulsed integrated-path differential absorption lidar". Applied Optics. 51 (34): 8296. Bibcode:2012ApOpt..51.8296R. doi:10.1364/AO.51.008296. ISSN 1539-4522.
- ↑ Grant, W. B., Lidar for atmospheric and hydrospheric studies, in Tunable Laser Applications, 1st Edition, Duarte, F. J. Ed. (Marcel Dekker, New York, 1995) Chapter 7.
- 1 2 Mei, Liang. "Remote sensing of atmospheric aerosol and gas using scheimpflug lidar based on diode lasers". Progress in Electromagnetic Research Symposium (PIERS),. ISBN 978-1-5090-6094-8.
- ↑ Gonglach, Matt. "How Police Laser Guns Work".
- ↑ Archived September 4, 2011, at the Wayback Machine.
- ↑ "NATO Laser Based Stand-Off Detection of biological Agents". Rta.nato.int. Retrieved 2013-05-06.
- ↑ "Short-Range Bioaerosol Threat Detection Sensor (SR-BioSpectra)". Ino.ca. Retrieved 2013-05-06.
- ↑ "Defense & Security Intelligence & Analysis: IHS Jane's | IHS". Articles.janes.com. Retrieved 2016-02-22.
- ↑ Spice, Byron. Researchers Help Develop Full-Size Autonomous Helicopter Carnegie Mellon, 6 July 2010. Retrieved: 19 July 2010.
- ↑ Koski, Olivia. In a First, Full-Sized Robo-Copter Flies With No Human Help Wired, 14 July 2010. Retrieved: 19 July 2010.
- ↑ "Volume Measuring". 3dlasermapping.com. Retrieved 2014-02-17.
- ↑ Modular Mining Systems#Autonomous Haulage Systems
- ↑ NASA. 'NASA Mars Lander Sees Falling Snow, Soil Data Suggest Liquid Past' NASA.gov (29 September 2008). Retrieved 9 November 2008.
- ↑ "Cloud-Aerosol Lidar with Orthogonal Polarization (CALIOP)". NASA. Retrieved 16 August 2015.
- ↑ CW Gowers. ' Focus On : Lidar-Thomson Scattering Diagnostic on JET' JET.EFDA.org (undated). Retrieved 8 August 2007. Archived September 18, 2007, at the Wayback Machine.
- ↑ Riquelme, A.J., Abellán, A., Tomás, R. & Jaboyedoff, M. 2014. A new approach for semi-automatic rock mass joints recognition from 3D point clouds. Computers & Geosciences, 68, 38–52, doi: 10.1016/j.cageo.2014.03.014.
- ↑ Gigli, G. & Casagli, N. 2011. Semi-automatic extraction of rock mass structural data from high resolution LIDAR point clouds. International Journal of Rock Mechanics and Mining Sciences, 48, 187–198, doi:10.1016/j.ijrmms.2010.11.009.
- 1 2 3 Slob, S. 2010. Automated rock mass characterization using 3D terrestrial laser scanner, Technical University of Delf.
- ↑ Riquelme, A.J., Abellán, A. & Tomás, R. 2015. Discontinuity spacing analysis in rock masses using 3D point clouds. Engineering Geology, 195, 185–195, doi: http://dx.doi.org/10.1016/j.enggeo.2015.06.009.
- 1 2 3 Sturzenegger, M. & Stead, D. 2009. Close-range terrestrial digital photogrammetry and terrestrial laser scanning for discontinuity characterization on rock cuts. Engineering Geology, 106, 163–182, doi:10.1016/j.enggeo.2009.03.004.
- ↑ Riquelme, Adrián J.; Tomás, Roberto; Abellán, Antonio (2016-04-01). "Characterization of rock slopes through slope mass rating using 3D point clouds". International Journal of Rock Mechanics and Mining Sciences. 84: 165–176. doi:10.1016/j.ijrmms.2015.12.008.
- ↑ Abellán, A., Oppikofer, T., Jaboyedoff, M., Rosser, N.J., Lim, M. & Lato, M.J. 2014. Terrestrial laser scanning of rock slope instabilities. Earth Surface Processes and Landforms, 39, 80–97, doi: 10.1002/esp.3493.
- ↑ Abellán, A., Vilaplana, J.M. & Martínez, J. 2006. Application of a long-range Terrestrial Laser Scanner to a detailed rockfall study at Vall de Núria (Eastern Pyrenees, Spain). Engineering Geology, 88, 136–148, doi:10.1016/j.enggeo.2006.09.012.
- ↑ "IfTAS". Iftas.de. Retrieved 2013-05-06.
- ↑ Amzajerdian, Farzin; Pierrottet, Diego F.; Petway, Larry B.; Hines, Glenn D.; Roback, Vincent E. "Lidar Systems for Precision Navigation and Safe Landing on Planetary Bodies". Langley Research Center. NTRS. Retrieved May 24, 2011.
- ↑ "NASA - Lidar In-space Technology Experiment (LITE)". Nasa.gov. 2011-08-25. Retrieved 2013-05-06.
- ↑ D.M. Winker ; R.H. Couch ; M.P. McCormick (2011-09-27). "IEEE Xplore - An overview of LITE: NASA's Lidar In-space Technology Experiment" (PDF). Ieeexplore.ieee.org. doi:10.1109/5.482227. Retrieved 2013-05-06.
- ↑ Szulwic, Jakub; Burdziakowski, Paweł; Janowski, Artur; Przyborski, Marek; Tysiąc, Paweł; Wojtowicz, Aleksander; Kholodkov, Arthem; Matysik, Krzysztof; Matysik, Maciej. "Maritime Laser Scanning as the Source for Spatial Data". Polish Maritime Research. 22 (4). doi:10.1515/pomr-2015-0064.
- ↑ "CivilMaps.com accelerating road and pavement condition surveys". Civil Maps. 2015-03-15. Retrieved 2015-03-15.
- ↑ "Bumper-mounted lasers". Sciencedaily.com. 2007-02-27. Retrieved 2013-05-06.
- ↑ Clive, P. J. M., Windpower 2.0: technology rises to the challenge Environmental Research Web, 2008. Retrieved: 9 May 2014.
- ↑ Mikkelsen, Torben; et al. (October 2007). "12MW Horns Rev Experiment" (PDF). Risoe. Retrieved 2010-04-25.
- ↑ "Smarting from the wind". The Economist. 2010-03-04. Retrieved 2010-04-25.
- ↑ "The world's first control of a wind turbine with a nacelle-based Lidar system". Corporate Communications University of Stuttgart. 2012-06-05. Retrieved 2014-04-12.
- ↑ Andrew K. Scholbrock et al. Field Testing LIDAR Based Feed-Forward Controls on the NREL Controls Advanced Research Turbine National Renewable Energy Laboratory Data Base, 12 April 2014. Retrieved: 12 April 2014.
- ↑ Mikkelsen, Torben & Hansen, Kasper Hjorth et al. Lidar wind speed measurements from a rotating spinner Danish Research Database & Danish Technical University, 20 April 2010. Retrieved: 25 April 2010.
- ↑ Asimakopolous, M., Clive, P. J. M., More, G., and Boddington, R., Offshore compression zone measurement and visualisation European Wind Energy Association Annual Conference, 2014. Retrieved: 9 May 2014.
- ↑ Gallacher, D., and More, G., Lidar measurements and visualisation of turbulence and wake decay length European Wind Energy Association Annual Conference, 2014. Retrieved: 9 May 2014.
- ↑ Clive, P. J. M., et al., Offshore power curve tests for onshore costs: a real world case study European Wind Energy Association Annual Conference, 2014. Retrieved: 9 May 2014.
- ↑ Clive, P. J. M., Offshore power performance assessment for onshore costs DEWEK (Deutsche Windenergie Konferenz), 2012. Retrieved: 9 May 2014.
- ↑ Jochem, Andreas; Höfle Bernhard; Rutzinger Martin; Pfeifer Norbert (2009). "Automatic roof plane detection and analysis in airborne lidar point clouds for solar potential assessment". Sensors. 9 (7): 5241–5262. doi:10.3390/s90705241.
- ↑ Nguyen, Ha T.; Pearce, Joshua M.; Harrap, Rob; Barber, Gerald (2012). "The Application of LiDAR to Assessment of Rooftop Solar Photovoltaic Deployment Potential on a Municipal District Unit". Sensors. 12: 4534–4558. doi:10.3390/s120404534.
- ↑ Nguyen, Ha T.; Pearce, Joshua M. (2012). "Incorporating shading losses in solar photovoltaic potential assessment at the municipal scale". Solar Energy. 86 (5): 1245–1260. Bibcode:2012SoEn...86.1245N. doi:10.1016/j.solener.2012.01.017.
- ↑ Jochem, Andreas; Höfle Bernhard; Rutzinger Martin (2011). "Extraction of vertical walls from mobile laser scanning data for solar potential assessment". Remote Sensing. 3 (4): 650–667. Bibcode:2011RemS....3..650J. doi:10.3390/rs3030650.
- ↑ Lukač, Niko; Žlaus Danijel; Seme Seme; Žalik Borut; Štumberger Gorazd (2013). "Rating of roofs' surfaces regarding their solar potential and suitability for PV systems, based on LiDAR data". Applied Energy. 102: 803–812. doi:10.1016/j.apenergy.2012.08.042.
- ↑ Nick Parish (2008-07-13). "From OK Computer to Roll computer: Radiohead and director James Frost make a video without cameras". Creativity.
Further reading
- Heritage, E. (2011). 3D laser scanning for heritage. Advice and guidance to users on laser scanning in archaeology and architecture. Available at www.english-heritage.org.uk.
- Heritage, G., & Large, A. (Eds.). (2009). Laser scanning for the environmental sciences. John Wiley & Sons. ISBN 1-4051-5717-8
- Maltamo, M., Næsset, E., & Vauhkonen, J. (2014). Forestry Applications of Airborne Laser Scanning: Concepts and Case Studies (Vol. 27). Springer Science & Business Media. ISBN 94-017-8662-3
- Shan, J., & Toth, C. K. (Eds.). (2008). Topographic laser ranging and scanning: principles and processing. CRC press. ISBN 1-4200-5142-3
- Vosselman, G., & Maas, H. G. (Eds.). (2010). Airborne and terrestrial laser scanning. Whittles Publishing. ISBN 1-4398-2798-2
External links
| Wikimedia Commons has media related to LIDAR. |
- The USGS Center for LIDAR Information Coordination and Knowledge (CLICK) - A website intended to "facilitate data access, user coordination and education of lidar remote sensing for scientific needs."
- LiDAR Research Group (LRG), University of Heidelberg
- Free online lidar data viewer
- Lidar Industry News and Education