Les Coteaux, Quebec
| Les Coteaux | |
|---|---|
| Municipality | |
 Location within Vaudreuil-Soulanges RCM. | |
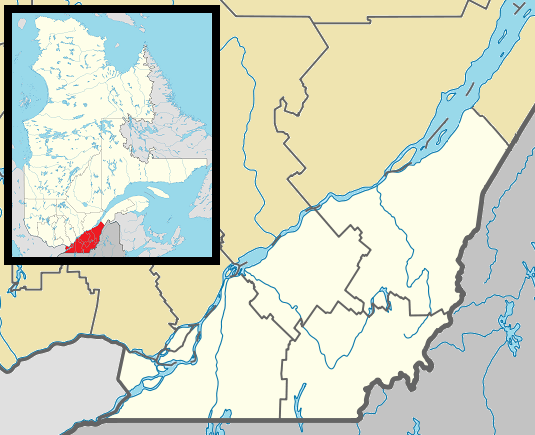 Les Coteaux Location in southern Quebec. | |
| Coordinates: 45°17′N 74°14′W / 45.283°N 74.233°WCoordinates: 45°17′N 74°14′W / 45.283°N 74.233°W[1] | |
| Country |
|
| Province |
|
| Region | Montérégie |
| RCM | Vaudreuil-Soulanges |
| Constituted | 18 May 1994 |
| Government[2][3] | |
| • Mayor | Réal Boisvert |
| • Federal riding | Salaberry—Suroît |
| • Prov. riding | Soulanges |
| Area[2][4] | |
| • Total | 14.50 km2 (5.60 sq mi) |
| • Land | 11.62 km2 (4.49 sq mi) |
| Population (2011)[4] | |
| • Total | 4,568 |
| • Density | 393.2/km2 (1,018/sq mi) |
| • Pop 2006-2011 |
|
| • Dwellings | 1,931 |
| Time zone | EST (UTC−5) |
| • Summer (DST) | EDT (UTC−4) |
| Postal code(s) | J7X 1A2 |
| Area code(s) | 450 and 579 |
| Highways |
|
| Website |
www |
Les Coteaux is a municipality in Vaudreuil-Soulanges Regional County Municipality in the Montérégie region of Quebec. It is located north of the Saint Lawrence River and Salaberry-de-Valleyfield.
It was formed from the merger in 1994 of Coteau-Station (north of Autoroute 20) and Coteau-Landing (south of Autoroute 20); prior to 1985 Coteau-Station had been known as Station-du-Coteau.[5]
Demographics
Population
| Canada census – Les Coteaux, Quebec community profile | |||
|---|---|---|---|
| 2011 | 2006 | 2001 | |
| Population: | 4,568 (+21.4% from 2006) | 3,764 (+25.0% from 2001) | 3,010 (+5.9% from 1996) |
| Land area: | 11.62 km2 (4.49 sq mi) | 11.62 km2 (4.49 sq mi) | 11.62 km2 (4.49 sq mi) |
| Population density: | 393.2/km2 (1,018/sq mi) | 324.0/km2 (839/sq mi) | 259.1/km2 (671/sq mi) |
| Median age: | 35.7 (M: 35.3, F: 36.2) | 36.2 (M: 34.8, F: 37.3) | 36.4 (M: 35.9, F: 36.7) |
| Total private dwellings: | 1,931 | 1,509 | 1,211 |
| Median household income: | $60,437 | $53,665 | $42,070 |
| References: 2011[4] 2006[6] 2001[7] | |||
| Historical Census Data - Les Coteaux, Quebec[8] | ||||||||||||||||||||||||||
|---|---|---|---|---|---|---|---|---|---|---|---|---|---|---|---|---|---|---|---|---|---|---|---|---|---|---|
|
|
| ||||||||||||||||||||||||
Language
| Canada Census Mother Tongue - Les Coteaux, Quebec[8] | ||||||||||||||||||
|---|---|---|---|---|---|---|---|---|---|---|---|---|---|---|---|---|---|---|
| Census | Total | French |
English |
French & English |
Other | |||||||||||||
| Year | Responses | Count | Trend | Pop % | Count | Trend | Pop % | Count | Trend | Pop % | Count | Trend | Pop % | |||||
| 2011 |
4,530 |
4,215 | |
93.05% | 220 | |
4.86% | 50 | |
1.10% | 45 | |
0.99% | |||||
| 2006 |
3,730 |
3,450 | |
92.49% | 180 | |
4.83% | 60 | |
1.61% | 40 | |
1.07% | |||||
| 2001 |
2,960 |
2,845 | |
96.11% | 90 | |
3.04% | 10 | |
0.34% | 15 | |
0.51% | |||||
| 1996 |
2,740 |
2,605 | n/a | 95.07% | 125 | n/a | 4.56% | 0 | n/a | 0.00% | 10 | n/a | 0.37% | |||||
See also
References
- ↑ Reference number 289307 of the Commission de toponymie du Québec (French)
- 1 2 Ministère des Affaires Municipales et Regions Quebec Ministère des Affaires municipales, des Régions et de l'Occupation du territoire: Les Coteaux
- ↑ Parliament of Canada Federal Riding History: VAUDREUIL--SOULANGES (Quebec)
- 1 2 3 2011 Statistics Canada Census Profile: Les Coteaux, Quebec
- ↑ Isabelle Lord (1 October 2008). "Les Coteaux". L'Étoile. Retrieved 26 January 2012.
- ↑ "2006 Community Profiles". Canada 2006 Census. Statistics Canada. March 30, 2011. Retrieved 6 February 2014.
- ↑ "2001 Community Profiles". Canada 2001 Census. Statistics Canada. February 17, 2012. Retrieved 6 February 2014.
- 1 2 Statistics Canada: 1996, 2001, 2006, 2011 census
 |
Saint-Polycarpe | | ||
| Saint-Zotique | |
Coteau-du-Lac | ||
| ||||
| | ||||
| Saint Lawrence River Saint-Stanislas-de-Kostka |
Saint Lawrence River Salaberry-de-Valleyfield |
| Cities & Towns | |
|---|---|
| Municipalities | |
| Villages | |
| |
This article is issued from Wikipedia - version of the 2/28/2016. The text is available under the Creative Commons Attribution/Share Alike but additional terms may apply for the media files.