Leflore County, Mississippi
| Leflore County, Mississippi | |
|---|---|
 Leflore County Courthouse | |
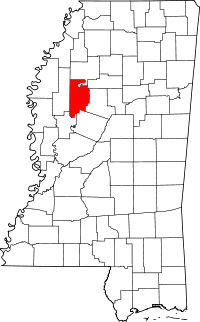 Location in the U.S. state of Mississippi | |
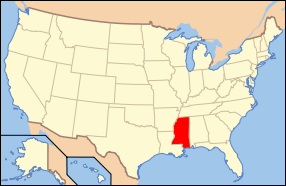 Mississippi's location in the U.S. | |
| Founded | 1871 |
| Named for | Greenwood LeFlore |
| Seat | Greenwood |
| Largest city | Greenwood |
| Area | |
| • Total | 606 sq mi (1,570 km2) |
| • Land | 593 sq mi (1,536 km2) |
| • Water | 14 sq mi (36 km2), 2.3% |
| Population | |
| • (2010) | 32,317 |
| • Density | 55/sq mi (21/km²) |
| Congressional district | 2nd |
| Time zone | Central: UTC-6/-5 |
| Website |
www |
Leflore County is a county located in the U.S. state of Mississippi. As of the 2010 census, the population was 32,317.[1] The county seat is Greenwood.[2] The county is named for Choctaw leader Greenwood LeFlore, who signed a treaty to cede his people's land to the United States in exchange for land in Indian Territory. LeFlore stayed in Mississippi, settling on land reserved for him in Tallahatchie County.
Leflore County is part of the Greenwood, MS Micropolitan Statistical Area. It is located in the Mississippi Delta region, with its southern border formed by the Yazoo River. Its riverfront lands were developed before the Civil War as cotton plantations. More inland areas were developed in the later 19th century.
Leflore County, which is still largely rural, is noted for having the highest level of child poverty of any county in the United States. Mechanization of agriculture reduced jobs available for many workers in the 20th century, and there are few opportunities.[3] The population has declined dramatically since its peak in 1930 as people continue to leave for opportunities elsewhere.
History
Leflore County was formed in 1871 during the Reconstruction era from portions of Carroll, Sunflower and Tallahatchie counties. It was named for Greenwood Leflore,[4] a Choctaw chief. During the period of Indian Removal in the 1830s, he was one of the chiefs who signed the Treaty of 1830, by the terms of which the Choctaw sold to the US their remaining lands east of the Mississippi River. Most Choctaw migrated to the Indian Territory (now Oklahoma), but Leflore and some others remained in Mississippi. He became a state and US citizen, a planter owning African-American slaves, and at times served as a politician.
Following the American Civil War, during Reconstruction the majority-black population of freedmen in the county gained emancipation and suffrage, participating for the first time in formal politics. They supported the Republican Party, as President Abraham Lincoln had gained their freedom. In the mid-1870s, the paramilitary Red Shirts developed chapters in Mississippi. They worked to disrupt Republican meetings, suppress the black vote, and turn Republicans out of office so that white Democrats could regain control of the state legislature.
In 1890 the state legislature passed a new constitution that had a variety of devices to disenfranchise blacks; they developed ways around court cases that tried to dismantle these, and kept blacks excluded from the political system and racially segregated into the 1960s. In the first half of the 20th century, many blacks left rural counties such as Leflore, in the Great Migration to northern and midwestern industrial cities in search of jobs and education: many people went north by train to Chicago, taking their music with them and changing the big city forever.
As with other parts of the majority-black Delta, Leflore County was a major site of activism and violence during the African-American Civil Rights Movement (1955–1968). In 1963, the county had more than 13,000 blacks of legal voting age, and fewer than 270 were registered because of discrimination and suppression by whites. Blacks had been essentially disfranchised since implementation of Mississippi's new constitution in 1890, establishing poll taxes, literacy tests and other registration barriers. Meanwhile, 95% of eligible white voters were registered.[5]
The Student Nonviolent Coordinating Committee had moved its headquarters to Greenwood in early 1963, and by late March of that year, eight SNCC members were arrested while trying to register voters. The United States Department of Justice Civil Rights Division filed suit against the city of Greenwood and Leflore county to obtain their release. The petition was denied by a local court, but the city of Greenwood entered into a voluntary agreement to release the students. In June 1963, 45 residents of Itta Bena were arrested in Leflore County while protesting an attack on churches where voter registration drives were being held. The Civil Rights Division filed suit against the county to obtain their release as well, but to no avail.[6] Passage of civil rights legislation by Congress in 1964 and 1965 began to change the ground rules.
Organizers and marchers returned in 1966 to the county as part of the March Against Fear, initiated by James Meredith, who was shot and wounded by a white man two days into the march. Major civil rights leaders and marchers from a variety of organizations vowed to continue his march of more than 220 miles from Memphis, Tennessee to Jackson, Mississippi. By the time they reached Greenwood, several hundred persons were in the group. They worked to organize and register voters, as most blacks in the county still lived in fear and had not registered. After previous attempts, the white county board had cut off federal commodity subsidies to the black community, threatening the survival of numerous poor families. SNCC helped organize a national gathering of food for county residents to overcome the boycott.
In 1966, Stokley Carmichael, a new leader of SNCC, spoke in Greenwood for "Black Power", saying that blacks had to build their own bases of political and economic power, as had Irish, Italian and Jewish immigrants to the United States.
Geography
According to the U.S. Census Bureau, the county has a total area of 606 square miles (1,570 km2), of which 593 square miles (1,540 km2) is land and 14 square miles (36 km2) (2.3%) is water.[7]
Major highways
Adjacent counties
- Tallahatchie County (north)
- Grenada County (northeast)
- Carroll County (east)
- Holmes County (southeast)
- Humphreys County (southwest)
- Sunflower County (west)
National protected area
Demographics
| Historical population | |||
|---|---|---|---|
| Census | Pop. | %± | |
| 1880 | 10,246 | — | |
| 1890 | 16,869 | 64.6% | |
| 1900 | 23,834 | 41.3% | |
| 1910 | 36,290 | 52.3% | |
| 1920 | 37,256 | 2.7% | |
| 1930 | 53,506 | 43.6% | |
| 1940 | 53,406 | −0.2% | |
| 1950 | 51,813 | −3.0% | |
| 1960 | 47,142 | −9.0% | |
| 1970 | 42,111 | −10.7% | |
| 1980 | 41,525 | −1.4% | |
| 1990 | 37,341 | −10.1% | |
| 2000 | 37,947 | 1.6% | |
| 2010 | 32,317 | −14.8% | |
| Est. 2015 | 30,999 | [8] | −4.1% |
| U.S. Decennial Census[9] 1790-1960[10] 1900-1990[11] 1990-2000[12] 2010-2013[1] | |||
As of the 2010 United States Census, there were 32,317 people residing in the county. 72.2% were Black or African American, 24.9% White, 0.6% Asian, 0.2% Native American, 1.5% of some other race and 0.6% of two or more races. 2.3% were Hispanic or Latino (of any race).
As of the census[13] of 2000, there were 37,947 people, 12,956 households, and 8,887 families residing in the county. The population density was 64 people per square mile (25/km²). There were 14,097 housing units at an average density of 24 per square mile (9/km²). The racial makeup of the county was 30.00% White, 67.73% Black or African American, 0.11% Native American, 0.65% Asian, 0.04% Pacific Islander, 0.98% from other races, and 0.50% from two or more races. 1.90% of the population were Hispanic or Latino of any race.
According to the census[13] of 2000, the largest ancestry groups in Leflore County were African 67.73%, English 19%, and Scots-Irish 9.4%
There were 12,956 households out of which 35.40% had children under the age of 18 living with them, 36.00% were married couples living together, 27.60% had a female householder with no husband present, and 31.40% were non-families. 28.20% of all households were made up of individuals and 11.60% had someone living alone who was 65 years of age or older. The average household size was 2.70 and the average family size was 3.33.
In the county the population was spread out with 29.70% under the age of 18, 13.10% from 18 to 24, 27.00% from 25 to 44, 18.20% from 45 to 64, and 11.90% who were 65 years of age or older. The median age was 30 years. For every 100 females there were 92.50 males. For every 100 females age 18 and over, there were 87.50 males.
The median income for a household in the county was $21,518, and the median income for a family was $26,059. Males had a median income of $25,959 versus $18,497 for females. The per capita income for the county was $12,553. About 29.10% of families and 34.80% of the population were below the poverty line, including 48.00% of those under age 18 and 24.50% of those age 65 or over.
Government and infrastructure
The Delta Correctional Facility, operated by the Corrections Corporation of America on behalf of the Mississippi Department of Corrections, is located in Greenwood in Leflore County.[14][15]
Education
- Colleges and Universities
- Mississippi Valley State University
- It is located 1 mile (1.6 km) northwest of Itta Bena in an unincorporated area.[16]
- Mississippi Valley State University
- Public School Districts
- Private Schools
- Pillow Academy — formerly a segregation academy.[17]
Communities
Cities
Towns
Unincorporated communities
Ghost town
See also
References
- 1 2 "State & County QuickFacts". United States Census Bureau. Retrieved September 4, 2013.
- ↑ "Find a County". National Association of Counties. Retrieved 2011-06-07.
- ↑ "Table 1: 2011 Poverty and Median Income Estimates - Counties". Small Area Income and Poverty Estimates. U.S. Census Bureau. 2011.
- ↑ Gannett, Henry (1905). The Origin of Certain Place Names in the United States. U.S. Government Printing Office. p. 184.
- ↑ Hendrickson, Paul (2003). Sons of Mississippi. New York: Alfred A. Knopf. ISBN 0-375-40461-9.
- ↑ John Doar (1997). "The Work of the Civil Rights Division in Enforcing Voting Rights Under the Civil Rights Acts of 1957 and 1960". Florida State University Law Review. 25 (1). (available online)
- ↑ "2010 Census Gazetteer Files". United States Census Bureau. August 22, 2012. Retrieved November 6, 2014.
- ↑ "County Totals Dataset: Population, Population Change and Estimated Components of Population Change: April 1, 2010 to July 1, 2015". Retrieved July 2, 2016.
- ↑ "U.S. Decennial Census". United States Census Bureau. Retrieved November 6, 2014.
- ↑ "Historical Census Browser". University of Virginia Library. Retrieved November 6, 2014.
- ↑ "Population of Counties by Decennial Census: 1900 to 1990". United States Census Bureau. Retrieved November 6, 2014.
- ↑ "Census 2000 PHC-T-4. Ranking Tables for Counties: 1990 and 2000" (PDF). United States Census Bureau. Retrieved November 6, 2014.
- 1 2 "American FactFinder". United States Census Bureau. Retrieved 2008-01-31.
- ↑ "Private Prisons." Mississippi Department of Corrections. Retrieved on August 12, 2010.
- ↑ "Ward Map." City of Greenwood. Retrieved on August 12, 2010.
- ↑ "Location." Mississippi Valley State University. Retrieved on April 5, 2012.
- ↑ Lynch, Adam (18 November 2009). "Ceara's Season". Jackson Free Press. Retrieved 19 August 2011.
External links
 |
Tallahatchie County | Grenada County | | |
| Sunflower County | |
Carroll County | ||
| ||||
| | ||||
| Humphreys County | Holmes County |
Municipalities and communities of Leflore County, Mississippi, United States | ||
|---|---|---|
| Cities | | |
| Towns | ||
| CDP | ||
| Unincorporated communities | ||
| Ghost town | ||
| Footnotes | ‡This populated place also has portions in an adjacent county or counties | |
.svg.png)
Coordinates: 33°33′N 90°18′W / 33.55°N 90.30°W