Leeds—Grenville—Thousand Islands and Rideau Lakes
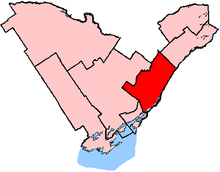 Leeds–Grenville shown within the Eastern Ontario region | |||
| Federal electoral district | |||
| Legislature | House of Commons | ||
| MP |
| ||
| District created | 1976 | ||
| First contested | 1979 | ||
| Last contested | 2015 | ||
| District webpage | profile, map | ||
| Demographics | |||
| Population (2011)[1] | 99,306 | ||
| Electors (2015) | 78,225 | ||
| Area (km²)[2] | 3,383.93 | ||
| Pop. density (per km²) | 29.3 | ||
| Census divisions | Leeds and Grenville | ||
| Census subdivisions | Athens, Augusta, Brockville, Edwardsburgh/Cardinal, Elizabethtown–Kitley, Front of Yonge, Gananoque, Leeds and the Thousand Islands, Merrickville–Wolford, North Grenville, Prescott, Rideau Lakes, Westport | ||
Leeds—Grenville—Thousand Islands and Rideau Lakes (French: Leeds—Grenville—Thousand Islands et Rideau Lakes) is a federal electoral district in Ontario, Canada, that has been represented in the House of Commons since 1979. Prior to the 2015 election, the riding was known as Leeds—Grenville.[3]
Geography
The riding consists of the entirety of the United Counties of Leeds and Grenville.
History
The federal district was created in 1976 from parts of Grenville–Carleton and Leeds ridings.
It consisted initially of the County of Grenville and the County of Leeds, excluding the Town of Smiths Falls. Since 1987, it has consisted of the United Counties of Leeds and Grenville.
With the 2012 electoral redistribution, this district lost a small portion of territory to Lanark—Frontenac—Kingston, and renamed Leeds—Grenville—Thousand Islands and Rideau Lakes.
Members of Parliament
This riding has elected the following Members of Parliament:
| Parliament | Years | Member | Party | |
|---|---|---|---|---|
| Leeds—Grenville Riding created from Grenville—Carleton and Leeds |
||||
| 31st | 1979–1980 | Thomas Cossitt | Progressive Conservative | |
| 32nd | 1980–1982 | |||
| 1982–1984 | Jennifer Cossitt | |||
| 33rd | 1984–1988 | |||
| 34th | 1988–1993 | Jim Jordan | Liberal | |
| 35th | 1993–1997 | |||
| 36th | 1997–2000 | Joe Jordan | ||
| 37th | 2000–2004 | |||
| 38th | 2004–2006 | Gord Brown | Conservative | |
| 39th | 2006–2008 | |||
| 40th | 2008–2011 | |||
| 41st | 2011–2015 | |||
| Leeds—Grenville—Thousand Islands and Rideau Lakes | ||||
| 42nd | 2015–Present | Gord Brown | Conservative | |
Riding associations
Riding associations are the local branches of the national political parties:
| Party | Association Name | CEO | HQ Address | HQ City | |
| Conservative Party of Canada | Leeds—Grenville Conservative Association | Michael Barrett | PO Box 265 | Brockville, Ontario | |
| Green | Leeds—Grenville Federal Green Party Association | Greg Philliban | PO Box 246 | Spencerville | |
| Liberal Party of Canada | Leeds—Grenville Federal Liberal Association | Ross Howard | P.O. Box 50010 | Brockville | |
| New Democratic Party | Leeds—Grenville Federal NDP Riding Association | Brockville | |||
Election results
| Canadian federal election, 2015 | ||||||||
|---|---|---|---|---|---|---|---|---|
| Party | Candidate | Votes | % | ∆% | Expenditures | |||
| Conservative | Gord Brown | 26,738 | 47.38 | -13.43 | – | |||
| Liberal | Mary Jean McFall | 22,888 | 40.56 | +24.66 | – | |||
| New Democratic | Margaret Andrade | 4,722 | 8.37 | -9.95 | – | |||
| Green | Lorraine A. Rekmans | 2,088 | 3.70 | -1.29 | – | |||
| Total valid votes/Expense limit | 56,434 | 100.00 | $212,627.66 | |||||
| Total rejected ballots | 189 | 0.33 | – | |||||
| Turnout | 56,625 | 71.50 | – | |||||
| Eligible voters | 79,195 | |||||||
| Conservative hold | Swing | -19.04 | ||||||
| Source: Elections Canada[4][5] | ||||||||
| 2011 federal election redistributed results[6] | |||
|---|---|---|---|
| Party | Vote | % | |
| Conservative | 29,989 | 60.80 | |
| New Democratic | 9,032 | 18.31 | |
| Liberal | 7,839 | 15.89 | |
| Green | 2,460 | 4.99 | |
| Canadian federal election, 2011 | ||||||||
|---|---|---|---|---|---|---|---|---|
| Party | Candidate | Votes | % | ∆% | Expenditures | |||
| Conservative | Gordon Brown | 29,991 | 60.81 | +2.36 | $69,695 | |||
| New Democratic | Matthew Gabriel | 9,033 | 18.31 | +4.46 | $5,092 | |||
| Liberal | Marjory Loveys | 7,839 | 15.89 | -1.29 | $52,628 | |||
| Green | Mary Slade | 2,460 | 4.99 | -4.63 | $17,743 | |||
| Total valid votes/Expense limit | 49,323 | 100.00 | $145,158 | |||||
| Total rejected ballots | 156 | 0.32 | -0.08 | |||||
| Turnout | 49,479 | 65.10 | +3.24 | |||||
| Eligible voters | 76,001 | – | – | |||||
| Canadian federal election, 2008 | ||||||||
|---|---|---|---|---|---|---|---|---|
| Party | Candidate | Votes | % | ∆% | Expenditures | |||
| Conservative | Gord Brown | 27,473 | 58.44 | +3.78 | $55,637 | |||
| Liberal | Marjory Loveys | 8,075 | 17.18 | -7.14 | $31,418 | |||
| New Democratic | Steve Armstrong | 6,511 | 13.85 | -1.41 | $6,532 | |||
| Green | Jeanie Warnock | 4,522 | 9.62 | +3.85 | $10,790 | |||
| Progressive Canadian | John McCrea | 426 | 0.91 | * | $291 | |||
| Total valid votes/Expense limit | 47,007 | 100.00 | $104,668 | |||||
| Rejected ballots | 186 | 0.39 | – | |||||
| Turnout | 47,193 | 62.86 | -7.65 | |||||
| Canadian federal election, 2006 | ||||||||
|---|---|---|---|---|---|---|---|---|
| Party | Candidate | Votes | % | ∆% | Expenditures | |||
| Conservative | Gord Brown | 28,447 | 54.66 | +4.20 | $69,350 | |||
| Liberal | Bob Eaton | 12,661 | 24.32 | -8.61 | $28,806 | |||
| New Democratic | Steve Armstrong | 7,945 | 15.26 | +3.94 | $7,043 | |||
| Green | David Lee | 3,003 | 5.77 | +0.49 | $450 | |||
| Total valid votes | 52,056 | 100.00 | ||||||
| Canadian federal election, 2004 | ||||||||
|---|---|---|---|---|---|---|---|---|
| Party | Candidate | Votes | % | ∆% | Expenditures | |||
| Conservative | Gord Brown | 26,002 | 50.46 | -5.81 | $69,173 | |||
| Liberal | Joe Jordan | 16,967 | 32.93 | -6.58 | $60,373 | |||
| New Democratic | Steve Armstrong | 5,834 | 11.32 | +9.22 | $10,009 | |||
| Green | Chris Bradshaw | 2,722 | 5.28 | +3.55 | $532 | |||
| Total valid votes | 51,525 | 100.00 | ||||||
Note: Conservative vote is compared to the total of the Canadian Alliance vote and Progressive Conservative vote in 2000 election.
| Canadian federal election, 2000 | ||||||||
|---|---|---|---|---|---|---|---|---|
| Party | Candidate | Votes | % | ∆% | Expenditures | |||
| Liberal | Joseph Louis Jordan | 18,594 | 39.51 | +0.04 | $52,586 | |||
| Alliance | Gord Brown | 18,539 | 39.39 | +17.77 | $61,645 | |||
| Progressive Conservative | John Johnston | 7,940 | 16.87 | -15.40 | $55,627 | |||
| New Democratic | Martin Hanratty | 990 | 2.10 | -1.53 | $1,764 | |||
| Green | Jerry Heath | 816 | 1.73 | -0.54 | $3,302 | |||
| Canadian Action | Jane Pamela Scharf | 181 | 0.38 | * | $0 | |||
| Total valid votes | 47,060 | 100.00 | ||||||
Note: Canadian Alliance vote is compared to the Reform vote in 1997 election.
| Canadian federal election, 1997 | ||||||||
|---|---|---|---|---|---|---|---|---|
| Party | Candidate | Votes | % | ∆% | Expenditures | |||
| Liberal | Joseph Louis Jordan | 19,123 | 39.47 | -13.02 | $48,446 | |||
| Progressive Conservative | Sandra Lawn | 15,636 | 32.27 | +5.16 | $58,733 | |||
| Reform | Doug Aldridge | 10,476 | 21.62 | +5.72 | $18,190 | |||
| New Democratic | Jennifer Breakspear | 1,757 | 3.63 | +1.64 | $3,522 | |||
| Green | Peter Bevan-Baker | 1,102 | 2.27 | +1.22 | $1,427 | |||
| Christian Heritage | Donny F. Platt | 241 | 0.50 | * | $544 | |||
| Natural Law | Wayne Foster | 119 | 0.25 | * | $0 | |||
| Total valid votes | 48,454 | 100.00 | ||||||
| Canadian federal election, 1993 | ||||||||
|---|---|---|---|---|---|---|---|---|
| Party | Candidate | Votes | % | ∆% | Expenditures | |||
| Liberal | Jim Jordan | 26,324 | 52.49 | +9.10 | $49,114 | |||
| Progressive Conservative | Sandra Lawn | 13,595 | 27.11 | -11.78 | $53,521 | |||
| Reform | Paul West | 7,975 | 15.90 | * | $8,164 | |||
| New Democratic | Mary Ann Greenwood | 999 | 1.99 | -9.09 | $6,686 | |||
| Green | Peter Bevan-Baker | 527 | 1.05 | * | $0 | |||
| National | Holly Baker | 481 | 0.96 | * | $490 | |||
| Natural Law | Richard Beecroft | 196 | 0.39 | * | $0 | |||
| Abolitionist | Christine Richardson | 56 | 0.11 | * | $200 | |||
| Total valid votes | 50,153 | 100.00 | ||||||
| Canadian federal election, 1988 | ||||||||
|---|---|---|---|---|---|---|---|---|
| Party | Candidate | Votes | % | ∆% | ||||
| Liberal | Jim Jordan | 20,141 | 43.39 | +20.07 | ||||
| Progressive Conservative | Jennifer Cossitt | 18,053 | 38.89 | -22.61 | ||||
| New Democratic | Barry Grills | 5,141 | 11.08 | -2.88 | ||||
| Christian Heritage | David Butcher | 1,584 | 3.41 | |||||
| Confederation of Regions | Faye Garner | 1,497 | 3.23 | |||||
| Total valid votes | 46,416 | 100.00 | ||||||
| Canadian federal election, 1984 | ||||||||
|---|---|---|---|---|---|---|---|---|
| Party | Candidate | Votes | % | ∆% | ||||
| Progressive Conservative | Jennifer Cossitt | 26,961 | 61.50 | +4.50 | ||||
| Liberal | Chuck Anderson | 10,222 | 23.32 | +2.59 | ||||
| New Democratic | Jan Allen | 6,121 | 13.96 | +5.44 | ||||
| Green | Mike Nickerson | 348 | 0.79 | |||||
| Libertarian | Hans Wienhold | 190 | 0.43 | -13.01 | ||||
| Total valid votes | 43,842 | 100.00 | ||||||
| Canadian federal by-election, 12 October 1982 | ||||||||
|---|---|---|---|---|---|---|---|---|
| Party | Candidate | Votes | % | ∆% | ||||
| upon Tom Cossitt's death on 15 March 1982 | ||||||||
| Progressive Conservative | Jennifer Cossitt | 18,401 | 57.00 | +5.78 | ||||
| Liberal | Chuck Anderson | 6,693 | 20.73 | -10.98 | ||||
| Libertarian | Neil Reynolds | 4,337 | 13.44 | |||||
| New Democratic | Milred Smith | 2,751 | 8.52 | -8.55 | ||||
| Independent | Ray Turmel | 99 | 0.31 | |||||
| Total valid votes | 32,281 | 100.00 | ||||||
| Canadian federal election, 1980 | ||||||||
|---|---|---|---|---|---|---|---|---|
| Party | Candidate | Votes | % | ∆% | ||||
| Progressive Conservative | Tom Cossitt | 19,800 | 51.22 | -5.58 | ||||
| Liberal | Gerry McKee | 12,260 | 31.71 | +3.94 | ||||
| New Democratic | Mildred Smith | 6,600 | 17.07 | +1.65 | ||||
| Total valid votes | 38,660 | 100.00 | ||||||
| Canadian federal election, 1979 | ||||||||
|---|---|---|---|---|---|---|---|---|
| Party | Candidate | Votes | % | |||||
| Progressive Conservative | Tom Cossitt | 24,127 | 56.80 | |||||
| Liberal | Gerry McKee | 11,797 | 27.77 | |||||
| New Democratic | Mildred Smith | 6,551 | 15.42 | |||||
| Total valid votes | 42,475 | 100.00 | ||||||
See also
References
- "(Code 35041) Census Profile". 2011 census. Statistics Canada. 2012. Retrieved 2011-03-03.
Notes
- ↑ Stastistics Canada: 2011
- ↑ Stastistics Canada: 2011
- ↑ http://www.parl.gc.ca/HousePublications/Publication.aspx?Language=E&Mode=1&DocId=6654879&File=4
- ↑ Elections Canada – Confirmed candidates for Leeds—Grenville—Thousand Islands and Rideau Lakes, 30 September 2015
- ↑ Elections Canada – Preliminary Election Expenses Limits for Candidates
- ↑ Pundits' Guide to Canadian Elections
External links
- Federal riding history from the Library of Parliament
- 2011 Results from Elections Canada
- Leeds—Grenville profile at CBC News