Lambert cylindrical equal-area projection
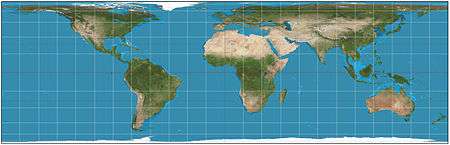

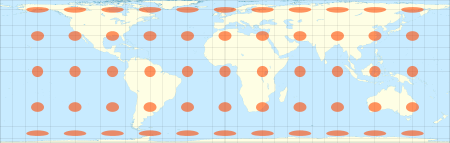

In cartography, the Lambert cylindrical equal-area projection, or Lambert cylindrical projection, is a cylindrical equal-area projection. This projection is undistorted along the equator, which is its standard parallel, but distortion increases rapidly towards the poles. Like any cylindrical projection, it stretches parallels increasingly away from the equator. The poles accrue infinite distortion, becoming lines instead of points.
History
The projection was invented by the Swiss mathematician Johann Heinrich Lambert and described in his 1772 treatise, Beiträge zum Gebrauche der Mathematik und deren Anwendung, part III, section 6: Anmerkungen und Zusätze zur Entwerfung der Land- und Himmelscharten, translated as, Notes and Comments on the Composition of Terrestrial and Celestial Maps.[1]
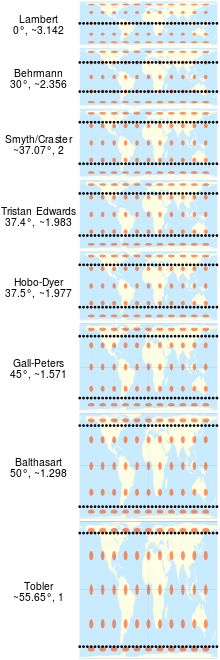
Lambert's projection is the basis for the cylindrical equal-area projection family. Lambert chose the equator as the parallel of no distortion.[2] By multiplying the projection's height by some factor and dividing the width by the same factor, the regions of no distortion can be moved to any desired pair of parallels north and south of the equator. These variations, particularly the Gall–Peters projection, are more commonly encountered in maps than Lambert’s original projection due to their lower distortion overall.[3]
Formulae

where φ is the latitude, λ is the longitude and λ0 is the central meridian.[1]
See also
References
- 1 2 Map Projections – A Working Manual, USGS Professional Paper 1395, John P. Snyder, 1987, pp. 76–85
- ↑ Ward, Matthew O.; Grinstein, Georges; Keim, Daniel (2015). Interactive Data Visualization: Foundations, Techniques, and Applications, Second Edition. CRC Press. pp. 226–227. ISBN 978-1-4822-5738-0.
- ↑ Snyder, John Parr (1987). Map Projections: a Working Manual. U.S. Government Printing Office. p. 76.
External links
- Table of examples and properties of all common projections, from radicalcartography.net
- An interactive Java Applet to study the metric deformations of the Lambert Cylindrical Equal-Area Projection.