Visualization (graphics)
Visualization or visualisation (see spelling differences) is any technique for creating images, diagrams, or animations to communicate a message. Visualization through visual imagery has been an effective way to communicate both abstract and concrete ideas since the dawn of humanity. Examples from history include cave paintings, Egyptian hieroglyphs, Greek geometry, and Leonardo da Vinci's revolutionary methods of technical drawing for engineering and scientific purposes.
Visualization today has ever-expanding applications in science, education, engineering (e.g., product visualization), interactive multimedia, medicine, etc. Typical of a visualization application is the field of computer graphics. The invention of computer graphics may be the most important development in visualization since the invention of central perspective in the Renaissance period. The development of animation also helped advance visualization.
Overview
.svg.png)
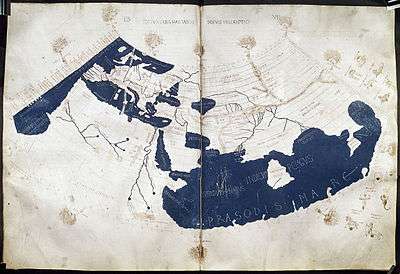
The use of visualization to present information is not a new phenomenon. It has been used in maps, scientific drawings, and data plots for over a thousand years. Examples from cartography include Ptolemy's Geographia (2nd Century AD), a map of China (1137 AD), and Minard's map (1861) of Napoleon's invasion of Russia a century and a half ago. Most of the concepts learned in devising these images carry over in a straightforward manner to computer visualization. Edward Tufte has written three critically acclaimed books that explain many of these principles.[1][2][3]
Computer graphics has from its beginning been used to study scientific problems. However, in its early days the lack of graphics power often limited its usefulness. The recent emphasis on visualization started in 1987 with the publication of Visualization in Scientific Computing, a special issue of Computer Graphics.[4] Since then, there have been several conferences and workshops, co-sponsored by the IEEE Computer Society and ACM SIGGRAPH, devoted to the general topic, and special areas in the field, for example volume visualization.it is the image processing
Most people are familiar with the digital animations produced to present meteorological data during weather reports on television, though few can distinguish between those models of reality and the satellite photos that are also shown on such programs. TV also offers scientific visualizations when it shows computer drawn and animated reconstructions of road or airplane accidents. Some of the most popular examples of scientific visualizations are computer-generated images that show real spacecraft in action, out in the void far beyond Earth, or on other planets. Dynamic forms of visualization, such as educational animation or timelines, have the potential to enhance learning about systems that change over time.
Apart from the distinction between interactive visualizations and animation, the most useful categorization is probably between abstract and model-based scientific visualizations. The abstract visualizations show completely conceptual constructs in 2D or 3D. These generated shapes are completely arbitrary. The model-based visualizations either place overlays of data on real or digitally constructed images of reality or make a digital construction of a real object directly from the scientific data.
Scientific visualization is usually done with specialized software, though there are a few exceptions, noted below. Some of these specialized programs have been released as open source software, having very often its origins in universities, within an academic environment where sharing software tools and giving access to the source code is common. There are also many proprietary software packages of scientific visualization tools.
Models and frameworks for building visualizations include the data flow models popularized by systems such as AVS, IRIS Explorer, and VTK toolkit, and data state models in spreadsheet systems such as the Spreadsheet for Visualization and Spreadsheet for Images.
Applications of visualization
As a subject in computer science, scientific visualization is the use of interactive, sensory representations, typically visual, of abstract data to reinforce cognition, hypothesis building, and reasoning. Data visualization is a related subcategory of visualization dealing with statistical graphics and geographic or spatial data (as in thematic cartography) that is abstracted in schematic form.[5]
Scientific visualization
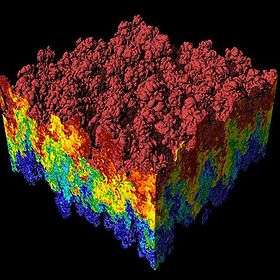
Scientific visualization is the transformation, selection, or representation of data from simulations or experiments, with an implicit or explicit geometric structure, to allow the exploration, analysis, and understanding of the data. Scientific visualization focuses and emphasizes the representation of higher order data using primarily graphics and animation techniques.[6][7] It is a very important part of visualization and maybe the first one, as the visualization of experiments and phenomena is as old as science itself. Traditional areas of scientific visualization are flow visualization, medical visualization, astrophysical visualization, and chemical visualization. There are several different techniques to visualize scientific data, with isosurface reconstruction and direct volume rendering being the more common.
Educational visualization
Educational visualization is using a simulation not usually normally created on a computer to create an image of something so it can be taught about. This is very useful when teaching about a topic that is difficult to otherwise see, for example, atomic structure, because atoms are far too small to be studied easily without expensive and difficult to use scientific equipment.
Information visualization
Information visualization concentrates on the use of computer-supported tools to explore large amount of abstract data. The term "information visualization" was originally coined by the User Interface Research Group at Xerox PARC and included Jock Mackinlay. Practical application of information visualization in computer programs involves selecting, transforming, and representing abstract data in a form that facilitates human interaction for exploration and understanding. Important aspects of information visualization are dynamics of visual representation and the interactivity. Strong techniques enable the user to modify the visualization in real-time, thus affording unparalleled perception of patterns and structural relations in the abstract data in question.
Knowledge visualization
The use of visual representations to transfer knowledge between at least two persons aims to improve the transfer of knowledge by using computer and non-computer-based visualization methods complementarily.[8] Examples of such visual formats are sketches, diagrams, images, objects, interactive visualizations, information visualization applications, and imaginary visualizations as in stories. While information visualization concentrates on the use of computer-supported tools to derive new insights, knowledge visualization focuses on transferring insights and creating new knowledge in groups. Beyond the mere transfer of facts, knowledge visualization aims to further transfer insights, experiences, attitudes, values, expectations, perspectives, opinions, and predictions by using various complementary visualizations. See also: picture dictionary, visual dictionary
Product visualization
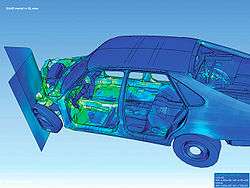
Product visualization involves visualization software technology for the viewing and manipulation of 3D models, technical drawing and other related documentation of manufactured components and large assemblies of products. It is a key part of product lifecycle management. Product visualization software typically provides high levels of photorealism so that a product can be viewed before it is actually manufactured. This supports functions ranging from design and styling to sales and marketing. Technical visualization is an important aspect of product development. Originally technical drawings were made by hand, but with the rise of advanced computer graphics the drawing board has been replaced by computer-aided design (CAD). CAD-drawings and models have several advantages over hand-made drawings such as the possibility of 3-D modeling, rapid prototyping, and simulation.
Visual communication
Visual communication is the communication of ideas through the visual display of information. Primarily associated with two dimensional images, it includes: alphanumerics, art, signs, and electronic resources. Recent research in the field has focused on web design and graphically-oriented usability.
Visual analytics
Visual analytics focuses on human interaction with visualization systems as part of a larger process of data analysis. Visual analytics has been defined as "the science of analytical reasoning supported by the interactive visual interface".[9]
Its focus is on human information discourse (interaction) within massive, dynamically changing information spaces. Visual analytics research concentrates on support for perceptual and cognitive operations that enable users to detect the expected and discover the unexpected in complex information spaces.
Technologies resulting from visual analytics find their application in almost all fields, but are being driven by critical needs (and funding) in biology and national security.
References
- ↑ Tufte, Edward R. (1990). Envisioning Information. ISBN 0961392118.
- ↑ Tufte, Edward R. (2001) [1st Pub. 1983]. The Visual Display of Quantitative Information (2nd ed.). ISBN 0961392142.
- ↑ Tufte, Edward R. (1997). Visual Explanations: Images and Quantities, Evidence and Narrative. ISBN 0961392126.
- ↑ http://www.evl.uic.edu/core.php?mod=4&type=3&indi=348
- ↑ Michael Friendly (2008). "Milestones in the history of thematic cartography, statistical graphics, and data visualization".
- ↑ "Scientific Visualization." sciencedaily.com. Science Daily, 2010. Retrieved from web http://www.sciencedaily.com/articles/s/scientific_visualization.htm. on 17 Nov 2011.
- ↑ "Scientific Visualization." Scientific Computing and Imaging Institute. Scientific Computing and Imaging Institute, University of Utah, n.d. Retrieved from web http://www.sci.utah.edu/research/visualization.html. on 17 Nov 2011.
- ↑ (Burkhard and Meier, 2004),
- ↑ Thomas, J.J., and Cook, K.A. (Eds) (2005). An Illuminated Path: The Research and Development Agenda for Visual Analytics, IEEE Computer Society Press, ISBN 0-7695-2323-4
Further reading
- Battiti, Roberto; Mauro Brunato (2011). Reactive Business Intelligence. From Data to Models to Insight. Trento, Italy: Reactive Search Srl. ISBN 978-88-905795-0-9.
- Bederson, Benjamin B., and Ben Shneiderman. The Craft of Information Visualization: Readings and Reflections, Morgan Kaufmann, 2003, ISBN 1-55860-915-6.
- Cleveland, William S. (1993). Visualizing Data.
- Cleveland, William S. (1994). The Elements of Graphing Data.
- Charles D. Hansen, Chris Johnson. Visualization Handbook, Academic Press (June, 2004).
- Kravetz, Stephen A. and David Womble. ed. Introduction to Bioinformatics. Totowa, N.J. Humana Press, 2003.
- Mackinlay, Jock D. (1999). Readings in information visualization: using vision to think. Card, S. K., Ben Shneiderman (eds.). Morgan Kaufmann Publishers Inc. p. 686. ISBN 1-55860-533-9.
- Will Schroeder, Ken Martin, Bill Lorensen. The Visualization Toolkit, by August 2004.
- Spence, Robert Information Visualization: Design for Interaction (2nd Edition), Prentice Hall, 2007, ISBN 0-13-206550-9.
- Edward R. Tufte (1992). The Visual Display of Quantitative Information
- Edward R. Tufte (1990). Envisioning Information.
- Edward R. Tufte (1997). Visual Explanations: Images and Quantities, Evidence and Narrative.
- Matthew Ward, Georges Grinstein, Daniel Keim. Interactive Data Visualization: Foundations, Techniques, and Applications. (May, 2010).
- Wilkinson, Leland. The Grammar of Graphics, Springer ISBN 0-387-24544-8
External links
- National Institute of Standards and Technology
- Scientific Visualization Tutorials, Georgia Tech
- Scientific Visualization Studio (NASA)