Jefferson County, Missouri
| Jefferson County, Missouri | ||
|---|---|---|
 County courthouse in Hillsboro | ||
| ||
 Location in the U.S. state of Missouri | ||
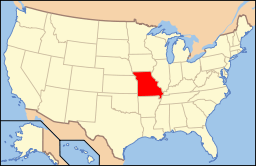 Missouri's location in the U.S. | ||
| Founded | 1818 | |
| Named for | Thomas Jefferson | |
| Seat | Hillsboro | |
| Largest city | Arnold | |
| Area | ||
| • Total | 664 sq mi (1,720 km2) | |
| • Land | 657 sq mi (1,702 km2) | |
| • Water | 7.7 sq mi (20 km2), 1.2% | |
| Population (est.) | ||
| • (2015) | 224,124 | |
| • Density | 333/sq mi (129/km²) | |
| Congressional districts | 2nd, 3rd, 8th | |
| Time zone | Central: UTC-6/-5 | |
| Website |
www | |

Jefferson County is a county located in the eastern portion of the state of Missouri. As of the 2010 census, the population was 218,733,[1] making it the sixth-most populous county in Missouri. Its county seat is Hillsboro.[2] The county was organized in 1818 and named in honor of former President Thomas Jefferson.[3][4]
In 1980, according to the U.S. census held that year, the county contained the mean center of U.S. population. Notably, this was the first census in which the center of population was located west of the Mississippi River.
Jefferson County is part of the St. Louis, MO-IL Metropolitan Statistical Area and encompasses many of the city's southern suburbs.
Geography
According to the U.S. Census Bureau, the county has a total area of 664 square miles (1,720 km2), of which 657 square miles (1,700 km2) is land and 7.7 square miles (20 km2) (1.2%) is water.[5] The county's eastern border is the Mississippi River, and on the other side is Illinois.
Much of Jefferson County will be in the totality path of the solar eclipse of August 21, 2017.
Adjacent counties
- St. Louis County (north)
- Monroe County, Illinois (east)
- Ste. Genevieve County (southeast)
- St. Francois County (south)
- Washington County (southwest)
- Franklin County (west)
Major highways
National protected area
Demographics
| Historical population | |||
|---|---|---|---|
| Census | Pop. | %± | |
| 1820 | 1,835 | — | |
| 1830 | 2,592 | 41.3% | |
| 1840 | 4,296 | 65.7% | |
| 1850 | 6,928 | 61.3% | |
| 1860 | 10,344 | 49.3% | |
| 1870 | 15,380 | 48.7% | |
| 1880 | 18,736 | 21.8% | |
| 1890 | 22,484 | 20.0% | |
| 1900 | 25,712 | 14.4% | |
| 1910 | 27,878 | 8.4% | |
| 1920 | 26,555 | −4.7% | |
| 1930 | 27,563 | 3.8% | |
| 1940 | 32,023 | 16.2% | |
| 1950 | 38,007 | 18.7% | |
| 1960 | 66,377 | 74.6% | |
| 1970 | 105,248 | 58.6% | |
| 1980 | 146,183 | 38.9% | |
| 1990 | 171,380 | 17.2% | |
| 2000 | 198,099 | 15.6% | |
| 2010 | 218,733 | 10.4% | |
| Est. 2015 | 224,124 | [6] | 2.5% |
| U.S. Decennial Census[7] 1790-1960[8] 1900-1990[9] 1990-2000[10] 2010-2015[1] | |||
As of the 2010 Census Jefferson County had a population of 218,733. The reported ethnic and racial make up of the population was 95.4% non-Hispanic white, 0.8% African-American, 0.3% Native American, 0.6% Asian, 0.4% reporting some other race, 1.3% reporting two or more races and 1.6% Hispanic or Latino of any race.[11]
As of the census[12] of 2000, there were 198,099 people, 71,499 households, and 54,553 families residing in the county. The population density was 302 inhabitants per square mile (117/km2). There were 75,586 housing units at an average density of 115 per square mile (44/km²). The racial makeup of the county was 97.48% White, 0.08% Black or African American, 0.29% Native American, 0.36% Asian, 0.01% Pacific Islander, 0.24% from other races, and 0.93% from two or more races. Approximately 1.01% of the population were Hispanic or Latino of any race.
There were 71,499 households out of which 38.90% had children under the age of 18 living with them, 61.00% were married couples living together, 10.40% had a female householder with no husband present, and 23.70% were non-families. 18.90% of all households were made up of individuals and 6.10% had someone living alone who was 65 years of age or older. The average household size was 2.74 and the average family size was 3.12.
In the county the population was spread out with 27.90% under the age of 18, 8.50% from 18 to 24, 31.80% from 25 to 44, 22.50% from 45 to 64, and 9.20% who were 65 years of age or older. The median age was 35 years. For every 100 females there were 98.90 males. For every 100 females age 18 and over, there were 95.90 males.
The median income for a household in the county was $60,636, and the median income for a family was $66,697. Males had a median income of $37,822 versus $25,440 for females. The per capita income for the county was $25,058. About 4.90% of families and 6.80% of the population were below the poverty line, including 8.10% of those under age 18 and 6.30% of those age 65 or over.
There were 146,316 registered voters in 2008.[13] As of Oct. 24, 2012, there were 148,011.[14]
Education
Public schools
- Crystal City School District 47 - Crystal City
- De Soto School District 73 - De Soto
- Early Childhood Center (PK)
- Athena Elementary School (K-06)
- Vineland Elementary School (K-06)
- De Soto Jr. High School (07-08)
- De Soto High School (09-12)
- Dunklin R-V School District - Herculaneum
- Festus R-VI School District - Festus
- Festus Elementary School (K-03)
- Festus Intermediate School (04-06)
- Festus Middle School (07-08)
- Festus High School (09-12)
- Fox C-6 School District - Arnold
- Grandview R-II School District - Hillsboro
- Grandview Elementary School (K-05) - Hillsboro
- Grandview Middle School (06-08) - Hillsboro
- Grandview High School (09-12) - Hillsboro
- Hillsboro R-III School District - Hillsboro
- Hillsboro Primary School (K-02)
- Hillsboro Elementary School (03-04)
- Hillsboro Middle School (05-06)
- Hillsboro Jr. High School (07-08)
- Hillsboro High School (09-12)
- Jefferson County R-VII School District - Festus
- Plattin Primary School (PK-02) - Festus
- Telegraph Intermediate School (03-05) - Festus
- Danby-Rush Tower Middle School (06-08) - Festus
- Jefferson High School- Festus
- Northwest R-I School District - High Ridge
- Brennan Woods Elementary School (K-05) - High Ridge
- Cedar Springs Elementary School (K-05) - House Springs
- High Ridge Elementary School (K-05) - High Ridge
- House Springs Elementary School (K-05) - House Springs
- Maple Grove Elementary School (K-05) - Dittmer
- Murphy Elementary School (K-05) - High Ridge
- Woodridge Middle School (06-08) - High Ridge
- Valley Middle School (06-08) - House Springs
- Northwest High School (09-12) - Cedar Hill
- Sunrise R-IX School District - De Soto
- Sunrise Elementary School (K-08) - De Soto
- Windsor C-1 School District - Imperial
Private schools
- Christian Outreach School (K-12) - Hillsboro - Nondenominational Christian
- People's Christian Academy (K-12) - Arnold - Assembly of God/Pentecostal
- St. Pius X High School (09-12) - Festus - Roman Catholic
- Twin City Christian Academy (PK-12) - Festus - Baptist
- Good Shepherd Catholic School - (K-08) - Hillsboro - Roman Catholic
- Holy Child Elementary & Middle School - Arnold - (K-08) - Roman Catholic
- Manna Christian Academy - De Soto - (K-12) - Southern Baptist
- Our Lady's Catholic School - Festus - (K-08) - Roman Catholic
- Our Lady Queen of Peace School - House Springs - (K-08) - Roman Catholic
- Sacred Heart Catholic School - Festus - (K-08) - Roman Catholic
- St. Anthony's Catholic School - High Ridge - (K-08) - Roman Catholic
- St. Joseph's Catholic School - Imperial - (K-08) - Roman Catholic
- St. Johns Lutheran School - Arnold - (PK-08) - Lutheran
- St. Johns School - Imperial - (K-08) - Nondenominational Christianity
- St. Rose of Lima Catholic School - De Soto - (K-08) - Roman Catholic
Post-secondary
ITT Technical Institute - Arnold
Jefferson College - Hillsboro A public, two-year community college.
Politics
Local
Historically, the Democratic Party has controlled politics at the local level in Jefferson County. Democrats hold all but two of the elected positions in the county. However, Republicans have made gains in recent years; they hold five of seven seats on the county council.
| Jefferson County, Missouri | ||||
|---|---|---|---|---|
| Elected countywide officials | ||||
| Assessor | Terry Roesch | Democratic | ||
| Circuit Clerk | Michael Reuter | Republican | ||
| County Clerk | Wes Wagner | Democratic | ||
| Collector | Beth Mahn | Democratic | ||
| Commissioner (Presiding) |
Ken Waller | Republican | ||
| Prosecuting Attorney | Forrest Wegge | Democratic | ||
| Public Administrator | Steve Farmer | Republican | ||
| Recorder | Debbie Dunnegan | Republican | ||
| Sheriff | Oliver Glenn Boyer | Democratic | ||
| Treasurer | Linda Nees | Democratic | ||
State
| Year | Republican | Democratic | Third Parties |
|---|---|---|---|
| 2012 | 41.75% 40,470 | 55.68% 53,971 | 2.56% 2,484 |
| 2008 | 34.42% 35,947 | 63.87% 66,697 | 1.71% 1,781 |
| 2004 | 49.23% 45,891 | 49.25% 45,909 | 1.52% 1,424 |
| 2000 | 47.05% 36,060 | 49.33% 37,808 | 3.62% 2,775 |
| 1996 | 43.90% 28,986 | 52.96% 34,970 | 3.14% 2,077 |
Jefferson County is divided into seven legislative districts in the Missouri House of Representatives; six of which are held by Republicans and one held by a Democrat.
- District 97 John McCaherty (R-High Ridge). Consists of Murphy and part of Arnold.
| Party | Candidate | Votes | % | ± | |
|---|---|---|---|---|---|
| Republican | John C. McCaherty | 4,681 | 66.98 | +15.83 | |
| Democratic | Tom Dohack | 2,308 | 33.02 | -15.83 | |
| Party | Candidate | Votes | % | ± | |
|---|---|---|---|---|---|
| Republican | John C. McCaherty | 6,946 | 51.15 | ||
| Democratic | Sam Komo | 6,633 | 48.85 | ||
- District 111 Shane Roden (R-Cedar Hill). Consists of Byrnes Mill, Cedar Hill, Cedar Hill Lakes, House Springs, and Scottsdale.
| Party | Candidate | Votes | % | ± | |
|---|---|---|---|---|---|
| Republican | Shane Roden | 4,834 | 52.98 | +3.66 | |
| Democratic | Michael Frame | 4,291 | 47.02 | -3.66 | |
| Party | Candidate | Votes | % | ± | |
|---|---|---|---|---|---|
| Democratic | Michael Frame | 8,052 | 50.68 | ||
| Republican | Derrick Good | 7,836 | 49.32 | ||
- District 112 Rob Vescovo (R-Arnold). Consists of areas near Arnold and Byrnes Mill.
| Party | Candidate | Votes | % | ± | |
|---|---|---|---|---|---|
| Republican | Rob Vescovo | 5,432 | 60.07 | +0.97 | |
| Democratic | Robert Butler | 3,611 | 39.93 | -0.97 | |
| Party | Candidate | Votes | % | ± | |
|---|---|---|---|---|---|
| Republican | Paul Wieland | 9,284 | 59.10 | ||
| Democratic | Daniel James | 6,425 | 40.90 | ||
- District 113 Dan Shaul (R-Imperial). Consists of most Arnold, all of Imperial and Kimmswick, and part of Barnhart.
| Party | Candidate | Votes | % | ± | |
|---|---|---|---|---|---|
| Republican | Dan Shaul | 4,749 | 59.98 | +13.21 | |
| Democratic | Sean Fauss | 3,168 | 40.02 | -13.21 | |
| Party | Candidate | Votes | % | ± | |
|---|---|---|---|---|---|
| Democratic | Jeff Roorda | 8,450 | 53.23 | ||
| Republican | Dan Smith | 7,225 | 46.77 | ||
- District 114 Becky Ruth (R-Festus). Consists of part of Barnhart, and all of Crystal City, Festus, Herculaneum, and Pevely.
| Party | Candidate | Votes | % | ± | |
|---|---|---|---|---|---|
| Republican | Becky Ruth | 4,791 | 53.26 | +3.53 | |
| Democratic | T. J. McKenna | 4,204 | 46.74 | -3.53 | |
| Party | Candidate | Votes | % | ± | |
|---|---|---|---|---|---|
| Democratic | T. J. McKenna | 7,772 | 50.27 | ||
| Republican | Becky Ruth | 7,688 | 49.73 | ||
- District 115 Elaine Gannon (R-De Soto). Consists of Olympian Village and areas near De Soto.
| Party | Candidate | Votes | % | ± | |
|---|---|---|---|---|---|
| Republican | Elaine Gannon | 3,285 | 63.64 | +12.75 | |
| Democratic | Dan Darian | 1,621 | 31.40 | -17.71 | |
| Constitution | Jerry Dollar, Jr. | 256 | 4.96 | +4.96 | |
| Party | Candidate | Votes | % | ± | |
|---|---|---|---|---|---|
| Republican | Elaine Gannon | 4,329 | 50.89 | ||
| Democratic | Rich McCane | 4,177 | 49.11 | ||
- District 118 Ben Harris (D-Hillsboro). Consists of De Soto and Hillsboro.
| Party | Candidate | Votes | % | ± | |
|---|---|---|---|---|---|
| Democratic | Ben Harris | 3,239 | 55.43 | -44.57 | |
| Republican | Michael McGirl | 2,604 | 44.57 | +44.57 | |
| Party | Candidate | Votes | % | ± | |
|---|---|---|---|---|---|
| Democratic | Ben Harris | 7,514 | 100.00 | ||
Jefferson County is also divided into two districts in the Missouri Senate.
- District 3 — Gary Romine (R-Farmington) Consists of De Soto, Hillsboro, and Olympian Village as well as part of Festus.
| Party | Candidate | Votes | % | ± | |
|---|---|---|---|---|---|
| Republican | Gary Romine | 10,069 | 49.85 | ||
| Democratic | Joseph Fallert, Jr. | 10,129 | 50.15 | ||
- District 22 — Paul Wieland (R-Imperial) Consists of the northern part of the county.
| Party | Candidate | Votes | % | ± | |
|---|---|---|---|---|---|
| Republican | Paul Wieland | 22,208 | 54.19 | ||
| Democratic | Jeff Roorda | 18,774 | 45.81 | ||
Federal
| Party | Candidate | Votes | % | ± | |
|---|---|---|---|---|---|
| Democratic | Claire McCaskill | 51,862 | 53.51 | ||
| Republican | Todd Akin | 38,745 | 39.97 | ||
| Libertarian | Jonathan Dine | 6,316 | 6.52 | ||
Jefferson County is divided among three congressional districts. Prior to the 2012 election all of it was included in Missouri's 3rd Congressional District, but now about half of it is in the 3rd District, while the northeastern portion is in the 2nd Congressional District and the southern portion is in the 8th Congressional District.
| Party | Candidate | Votes | % | ± | |
|---|---|---|---|---|---|
| Republican | Ann Wagner | 5,988 | 61.91 | +6.38 | |
| Democratic | Arthur Lieber | 3,247 | 33.57 | -7.41 | |
| Libertarian | Bill Slantz | 437 | 4.52 | +1.68 | |
| Party | Candidate | Votes | % | ± | |
|---|---|---|---|---|---|
| Republican | Ann Wagner | 9,976 | 55.53 | ||
| Democratic | Glenn Koenen | 7,361 | 40.98 | ||
| Libertarian | Bill Slantz | 511 | 2.84 | ||
| Constitution | Anatol Zorikova | 116 | 0.65 | ||
| Party | Candidate | Votes | % | ± | |
|---|---|---|---|---|---|
| Republican | Blaine Luetkemeyer | 16,558 | 60.12 | +7.09 | |
| Democratic | Courtney Denton | 9,637 | 34.99 | -7.29 | |
| Libertarian | Steven Hedrick | 1,345 | 4.88 | +0.19 | |
| Party | Candidate | Votes | % | ± | |
|---|---|---|---|---|---|
| Republican | Blaine Luetkemeyer | 25,898 | 53.03 | ||
| Democratic | Eric Mayer | 20,650 | 42.28 | ||
| Libertarian | Steven Wilson | 2,288 | 4.69 | ||
| Party | Candidate | Votes | % | ± | |
|---|---|---|---|---|---|
| Republican | Jason Smith | 8,060 | 52.23 | -5.47 | |
| Democratic | Barbara Stocker | 5,826 | 37.75 | -0.80 | |
| Libertarian | Rick Vandeven | 436 | 2.83 | +1.22 | |
| Constitution | Doug Enyart | 544 | 3.52 | +1.38 | |
| Independent | Terry Hampton | 567 | 3.67 | ||
| Party | Candidate | Votes | % | ± | |
|---|---|---|---|---|---|
| Republican | Jason Smith | 1,862 | 57.70 | +0.78 | |
| Democratic | Steve Hodges | 1,244 | 38.55 | -0.54 | |
| Libertarian | Bill Slantz | 52 | 1.61 | -2.38 | |
| Constitution | Doug Enyart | 69 | 2.14 | +2.14 | |
| Party | Candidate | Votes | % | ± | |
|---|---|---|---|---|---|
| Republican | Joann Emerson | 14,692 | 56.92 | ||
| Democratic | Jack Rushin | 10,090 | 39.09 | ||
| Libertarian | Rick Vandeven | 1,030 | 3.99 | ||
Political Culture
| Year | Republican | Democratic | Third Parties |
|---|---|---|---|
| 2012 | 55.30% 53,978 | 42.58% 41,564 | 2.12% 2,069 |
| 2008 | 47.91% 50,804 | 50.42% 53,467 | 1.67% 1,779 |
| 2004 | 49.99% 46,624 | 49.38% 46,057 | 0.63% 583 |
| 2000 | 47.62% 36,766 | 50.02% 38,616 | 2.36% 1,822 |
| 1996 | 36.12% 23,877 | 48.52% 32,073 | 15.36% 10,152 |
A predominantly suburban county, Jefferson County is fairly independent-leaning at the federal level but does have a tendency to tilt Democratic. Presidential elections in Jefferson County are almost always extremely close; George W. Bush just narrowly carried the county in 2004 by less than 600 votes and by just over a half of a percentage point. Al Gore and Barack Obama also just narrowly carried the county in 2000 and 2008, respectively. Bill Clinton, however, did manage to carry Jefferson County by double digits both times in 1992 and 1996. However, in 2012 the county swung hard to Mitt Romney, who carried it with 55 percent of the vote.
Typical of the suburban culture in most counties throughout the country, voters in Jefferson County tend to be rather centrist on social issues but more liberal on economic issues. In 2004, Missourians voted on a constitutional amendment to define marriage as the union between a man and a woman—it overwhelmingly passed Jefferson County with 72.56 percent of the vote. The initiative passed the state with 71 percent of support from voters as Missouri became the first state to ban same-sex marriage. In 2006, Missourians voted on a constitutional amendment to fund and legalize embryonic stem cell research in the state—it narrowly passed Jefferson County with 51.85 percent voting for the measure. The initiative narrowly passed the state with 51 percent of support from voters as Missouri became one of the first states in the nation to approve embryonic stem cell research. In 2006, Missourians voted on a proposition (Proposition B) to increase the minimum wage in the state to $6.50 an hour—it passed Jefferson County with 79.90 percent of the vote. The proposition strongly passed every single county in Missouri with 78.99 percent voting in favor as the minimum wage was increased to $6.50 an hour in the state. During the same election, voters in five other states also strongly approved increases in the minimum wage.
2008 Missouri Presidential Primary
- Republican
U.S. Senator John McCain (R-Arizona) won Jefferson County with 33.54% of the vote. Former Governor Mitt Romney (R-Massachusetts finished in second with 30.45% of the vote, while former Governor Mike Huckabee (R-Arkansas) came in third with 30.19% in Jefferson County. Libertarian-leaning U.S. Representative Ron Paul (R-Texas) finished a distant fourth place with 3.94% of the vote in Jefferson County. McCain received all of Missouri’s 58 delegates as the Republican Party utilizes the winner-takes-all system.
- Democratic
Former U.S. Senator and Secretary of State Hillary Clinton (D-New York) won Jefferson County over now President Barack Obama (D-Illinois) with 61.32% of the vote, while Obama received 35.02% of the vote. Although he withdrew from the race, former U.S. Senator John Edwards (D-North Carolina) still received 2.74% of the vote in Jefferson County. Jefferson County gave Clinton one of her strongest showings in a predominantly suburban county in the entire country.
Clinton had a large initial lead in Missouri at the beginning of the evening as the rural precincts began to report, leading several news organizations to call the state for her; however, Obama rallied from behind as the heavily African American precincts from St. Louis began to report and eventually put him over the top. In the end, Obama received 49.32 percent of the vote to Clinton’s 47.90% — a 1.42% difference. Both candidates split Missouri’s 72 delegates, as the Democratic Party utilizes proportional representation.
- Hillary Rodham Clinton received more votes, a total of 19,075, than any candidate from either party in Jefferson County during the 2008 Missouri Presidential Primaries. She also received more votes than the total number of votes cast in the entire Republican Primary in Jefferson County.
Recreation
|
|
Communities
Cities
Villages
Census-designated places
Unincorporated communities
See also
- List of counties in Missouri
- National Register of Historic Places listings in Jefferson County, Missouri
References
- 1 2 "State & County QuickFacts". United States Census Bureau. Retrieved September 9, 2013.
- ↑ "Find a County". National Association of Counties. Retrieved 2011-06-07.
- ↑ Eaton, David Wolfe (1916). How Missouri Counties, Towns and Streams Were Named. The State Historical Society of Missouri. p. 179.
- ↑ Gannett, Henry (1905). The Origin of Certain Place Names in the United States. Govt. Print. Off. p. 168.
- ↑ "2010 Census Gazetteer Files". United States Census Bureau. August 22, 2012. Retrieved November 16, 2014.
- ↑ "County Totals Dataset: Population, Population Change and Estimated Components of Population Change: April 1, 2010 to July 1, 2015". Retrieved July 2, 2016.
- ↑ "U.S. Decennial Census". United States Census Bureau. Retrieved November 16, 2014.
- ↑ "Historical Census Browser". University of Virginia Library. Retrieved November 16, 2014.
- ↑ "Population of Counties by Decennial Census: 1900 to 1990". United States Census Bureau. Retrieved November 16, 2014.
- ↑ "Census 2000 PHC-T-4. Ranking Tables for Counties: 1990 and 2000" (PDF). United States Census Bureau. Retrieved November 16, 2014.
- ↑ 2010 census report for Jefferson County, Missouri
- ↑ "American FactFinder". United States Census Bureau. Retrieved 2008-01-31.
- ↑ "Registered Voters in Missouri 2008".
- ↑ http://www.sos.mo.gov/elections/registeredvoters.asp?rvmID=0012 Retrieved on Jul. 9, 2013
- 1 2 3 4 5 6 7 8 9 10 11 "November 4, 2014 General Election Official Results" (PDF). Jefferson County Clerk. November 4, 2014. Retrieved March 31, 2016.
- 1 2 3 4 5 6 7 8 9 10 11 12 "Certification of Election Results" (PDF). Jefferson County Clerk. November 6, 2012. Retrieved March 31, 2016.
- ↑ "June 4, 2013 Special Election" (PDF). Jefferson County Clerk. June 4, 2013. Retrieved March 31, 2016.
External links
- Jefferson County MO Historical Society
- Jefferson County Online
- Jefferson County portion of Goodspeed's History (1888)
- Digitized 1930 Plat Book of Jefferson County from University of Missouri Division of Special Collections, Archives, and Rare Books
 |
St. Louis County | | ||
| Franklin County | |
Monroe County, Illinois | ||
| ||||
| | ||||
| Washington County | St. Francois County | Ste. Genevieve County |
| Topics |  | |
|---|---|---|
| Central city | ||
| Largest cities (over 50,000 in 2010) | ||
| Medium-sized cities (over 20,000 in 2010) | ||
| Largest towns and villages (over 10,000 in 2010) |
| |
| Missouri Counties | ||
| Illinois Counties | ||
| Subregions | ||
Municipalities and communities of Jefferson County, Missouri, United States | ||
|---|---|---|
| Cities | | |
| Villages | ||
| Townships | ||
| CDPs |
| |
| Unincorporated communities | ||
Coordinates: 38°16′N 90°32′W / 38.26°N 90.54°W