Isotopic labeling
Isotopic labeling (or isotopic labelling) is a technique used to track the passage of an isotope (an atom with a detectable variation) through a reaction, metabolic pathway, or cell. The reactant is 'labeled' by replacing specific atoms by their isotope. The reactant is then allowed to undergo the reaction. The position of the isotopes in the products is measured to determine the sequence the isotopic atom followed in the reaction or the cell's metabolic pathway. The nuclides used in isotopic labeling may be stable nuclides or radionuclides. In the latter case, the labeling is called radiolabeling.
In isotopic labeling, there are multiple ways to detect the presence of labeling isotopes; through their mass, vibrational mode, or radioactive decay. Mass spectrometry detects the difference in an isotope's mass, while infrared spectroscopy detects the difference in the isotope's vibrational modes. Nuclear magnetic resonance detects atoms with different gyromagnetic ratios. The radioactive decay can be detected through an ionization chamber or autoradiographs of gels.
An example of the use of isotopic labeling is the study of phenol (C6H5OH) in water by replacing common hydrogen (protium) with deuterium (deuterium labeling). Upon adding phenol to deuterated water (water containing D2O in addition to the usual H2O), the substitution of deuterium for the hydrogen is observed in phenol's hydroxyl group (resulting in C6H5OD), indicating that phenol readily undergoes hydrogen-exchange reactions with water. Only the hydroxyl group was affected, indicating that the other 5 hydrogen atoms did not participate in these exchange reactions.
Isotopic tracer
An isotopic tracer, (also "isotopic marker" or "isotopic label"), is used in chemistry and biochemistry to help understand chemical reactions and interactions. In this technique, one or more of the atoms of the molecule of interest is substituted for an atom of the same chemical element, but of a different isotope (like a radioactive isotope used in radioactive tracing). Because the labeled atom has the same number of protons, it will behave in almost exactly the same way as its unlabeled counterpart and, with few exceptions, will not interfere with the reaction under investigation. The difference in the number of neutrons, however, means that it can be detected separately from the other atoms of the same element.
Nuclear magnetic resonance (NMR) and mass spectrometry (MS) are used to investigate the mechanisms of chemical reactions. NMR and MS detects isotopic differences, which allows information about the position of the labeled atoms in the products' structure to be determined. With information on the positioning of the isotopic atoms in the products, the reaction pathway the initial metabolites utilize to convert into the products can be determined. Radioactive isotopes can be tested using the autoradiographs of gels in gel electrophoresis. The radiation emitted by compounds containing the radioactive isotopes darkens a piece of photographic film, recording the position of the labeled compounds relative to one another in the gel.
Isotope tracers are commonly used in the form of isotope ratios. By studying the ratio between two isotopes of the same element, we avoid effects involving the overall abundance of the element, which usually swamp the much smaller variations in isotopic abundances. Isotopic tracers are some of the most important tools in geology because they can be used to understand complex mixing processes in earth systems. Further discussion of the application of isotopic tracers in geology is covered under the heading of isotope geochemistry.
Isotopic tracers are usually subdivided into two categories: stable isotope tracers and radiogenic isotope tracers. Stable isotope tracers involve only non-radiogenic isotopes and usually are mass-dependent. In theory, any element with two stable isotopes can be used as an isotopic tracer. However, the most commonly used stable isotope tracers involve relatively light isotopes, which readily undergo fractionation in natural systems. See also isotopic signature. A radiogenic isotope tracer [2] involves an isotope produced by radioactive decay, which is usually in a ratio with a non-radiogenic isotope (whose abundance in the earth does not vary due to radioactive decay).
Stable isotope labeling

Stable isotope labeling involves the use of non-radioactive isotopes that can act as a tracers used to model several chemical and biochemical systems. The chosen isotope can act as a label on that compound that can be identified through nuclear magnetic resonance(NMR) and mass spectrometry(MS). Some of the most common stable isotopes are 2H, 13C, and 15N, which can further be produced into NMR solvents, amino acids, nucleic acids, lipids, common metabolites and cell growth media.[4] The compounds produced using stable isotopes are either specified by the percentage of labeled isotopes (i.e. 30% uniformly labeled 13C glucose contains a mixture that is 30% labeled with 13 carbon isotope and 70% naturally labeled carbon) or by the specifically labeled carbon positions on the compound (i.e. 1-13C glucose which is labeled at the first carbon position of glucose).
A network of reactions adopted from the glycolysis pathway and the pentose phosphate pathway is shown in which the labeled carbon isotope rearranges to different carbon positions throughout the network of reactions. The network starts with fructose 6-phosphate (F6P), which has 6 carbon atoms with a label 13C at carbon position 1 and 2. 1,2-13C F6P becomes two glyceraldehyde 3-phosphate (G3P), one 2,3-13C T3P and one unlabeled T3P. The 2,3-13C T3P can now be reacted with sedoheptulose 7-phosphate (S7P) to form an unlabeled erythrose 4-phosphate(E4P) and a 5,6-13C F6P. The unlabeled T3P will react with the S7P to synthesize unlabeled products.[3] The figure demonstrates the use of stable isotope labeling to discover the carbon atom rearrangement through reactions using position specific labeled compounds.
Metabolic flux analysis using stable isotope labeling

Metabolic flux analysis (MFA) using stable isotope labeling is an important tool for elucidating the flux of certain elements through the metabolic pathways and reactions within a cell. An isotopic label is fed to the cell, then the cell is allowed to grow utilizing the labeled feed. For stationary metabolic flux analysis the cell must reach a steady state (the isotopes entering and leaving the cell remain constant with time) or a quasi-steady state (steady state is reached for a given period of time).[5] The isotope pattern of the output metabolite is determined. The output isotope pattern provides valuable information, which can be used to find the magnitude of flux, rate of conversion from reactants to products, through each reaction.[6]
The figure demonstrates the ability to use different labels to determine the flux through a certain reaction. Assume the original metabolite, a three carbon compound, has the ability to either split into a two carbon metabolite and one carbon metabolite in one reaction then recombine or remain a three carbon metabolite. If the reaction is provided with two isotopes of the metabolite in equal proportion, one completely labeled (blue circles), commonly known as uniformly labeled, and one completely unlabeled (white circles). The pathway down the left side of the diagram does not display any change in the metabolites, while the right side shows the split and recombination. As shown, if the metabolite only takes the pathway down the left side, it remains in a 50–50 ratio of uniformly labeled to unlabeled metabolite. If the metabolite only takes the right side new labeling patterns can occur, all in equal proportion. Other proportions can occur depending on how much of the original metabolite follows the left side of the pathway versus the right side of the pathway. Here the proportions are shown for a situation in which half of the metabolites take the left side and half the right, but other proportions can occur.[7] These patterns of labeled atoms and unlabeled atoms in one compound represent isotopomers. By measuring the isotopomer distribution of the differently labeled metabolites, the flux through each reaction can be determined.[8]
MFA combines the data harvested from isotope labeling with the stoichiometry of each reaction, constraints, and an optimization procedure resolve a flux map. The irreversible reactions provide the thermodynamic constraints needed to find the fluxes. A matrix is constructed that contains the stoichiometry of the reactions. The intracellular fluxes are estimated by using an iterative method in which simulated fluxes are plugged into the stoichiometric model. The simulated fluxes are displayed in a flux map, which shows the rate of reactants being converted to products for each reaction.[6] In most flux maps, the thicker the arrow, the larger the flux value of the reaction.[9]
Isotope labeling measuring techniques
Any technique in measuring the difference between isotopomers can be used. The two primary methods, nuclear magnetic resonance (NMR) and mass spectrometry (MS), have been developed for measuring mass isotopomers in stable isotope labeling.
Proton NMR was the first technique used for 13C-labeling experiments. Using this method, each single protonated carbon position inside a particular metabolite pool can be observed separately from the other positions.[10] This allows the percentage of isotopomers labeled at that specific position to be known. The limit to proton NMR is that if there are n carbon atoms in a metabolite, there can only be at most n different positional enrichment values, which is only a small fraction of the total isotopomer information. Although the use of proton NMR labeling is limiting, pure proton NMR experiments are much easier to evaluate than experiments with more isotopomer information.
In addition to Proton NMR, using 13C NMR techniques will allow a more detailed view of the distribution of the isotopomers. A labeled carbon atom will produce different hyperfine splitting signals depending on the labeling state of its direct neighbors in the molecule.[10] A singlet peak emerges if the neighboring carbon atoms are not labeled. A doublet peak emerges if only one neighboring carbon atom is labeled. The size of the doublet split depends on the functional group of the neighboring carbon atom. If two neighboring carbon atoms are labeled, a doublet of doublets may degenerate into a triplet if the doublet splittings are equal.
The drawbacks to using NMR techniques for metabolic flux analysis purposes is that it is different from other NMR applications because it is a rather specialized discipline. An NMR spectrometer may not be directly available for all research teams. The optimization of NMR measurement parameters and proper analysis of peak structures requires a skilled NMR specialist. Certain metabolites also may require specialized measurement procedures to obtain additional isotopomer data. In addition, specially adapted software tools are needed to determine the precise quantity of peak areas as well as identifying the decomposition of entangled singlet, doublet, and triplet peaks.
As opposed to nuclear magnetic resonance, mass spectrometry (MS) is another method that is more applicable and sensitive to metabolic flux analysis experiments. MS instruments are available in different variants. Different from two-dimensional nuclear magnetic resonance (2D-NMR), the MS instruments work directly with hydrolysate.[10]
In gas chromatography-mass spectrometry (GC-MS), the MS is coupled to a gas chromatograph to separate the compounds of the hydrolysate. The compounds eluting from the GC column are then ionized and simultaneously fragmented. The benefit in using GC-MS is that not only are the mass isotopomers of the molecular ion measured but also the mass isotopomer spectrum of several fragments, which significantly increases the measured information.
In liquid chromatography-mass spectrometry (LC-MS), the GC is replaced with a liquid chromatograph.[11] The main difference is that chemical derivatization is not necessary. Applications of LC-MS to MFA, however, are rare.
In each case, MS instruments divide a particular isotopomer distribution by its molecular weight. All isotopomers of a particular metabolite that contain the same number of labeled carbon atoms are collected in one peak signal. Because every isotopomer contributes to exactly one peak in the MS spectrum, the percentage value can then be calculated for each peak, yielding the mass isotopomer fraction.[10] For a metabolite with n carbon atoms, n+1 measurements are produced. After normalization, exactly n informative mass isotopomer quantities remain.[10]
The drawback to using MS techniques is that for gas chromatography, the sample must be prepared by chemical derivatization in order to obtain molecules with charge. There are numerous amounts of compounds used to derivatize samples. N,N-Dimethylformamide dimethyl acetal (DMFDMA)[12] and N-(tert-butyldimethylsilyl)-N-methyltrifluoroacetamide (MTBSTFA) [13] are two examples of compounds that have been used to derivatize amino acids.
In addition, strong isotope effects observed affect the retention time of differently labeled isotopomers in the GC column. Overloading of the GC column also must be prevented.[13]
Lastly, the natural abundance of other atoms than carbon also leads to a disturbance in the mass isotopomer spectrum. For example, each oxygen atom in the molecule might also be present as a 17O isotope and as a 18O isotope. A more significant impact of the natural abundance of isotopes is the effect of silicon with a natural abundance of the isotopes 29Si and 30Si. Si is used in derivatizing agents for MS techniques.[10]
Radioisotopic labeling
Radioisotopic labeling is a technique for tracking the passage of a sample of substance through a system. The substance is "labeled" by including radionuclides in its chemical composition. When these decay, their presence can be determined by detecting the radiation emitted by them. Radioisotopic labeling is a special case of isotopic labeling.
For these purposes, a particularly useful type of radioactive decay is positron emission. When a positron collides with an electron, it releases two high-energy photons traveling in diametrically opposite directions. If the positron is produced within a solid object, it is likely to do this before traveling more than a millimeter. If both of these photons can be detected, the location of the decay event can be determined very precisely.
Strictly speaking, radioisotopic labeling includes only cases where radioactivity is artificially introduced by experimenters, but some natural phenomena allow similar analysis to be performed. In particular, radiometric dating uses a closely related principle.
Applications in proteomics
In proteomics, the study of the full set of proteins expressed by a genome, identifying diseases biomarkers can involve the usage of stable isotope labeling by amino acids in cell culture (SILAC), that provides isotopic labeled forms of amino acid used to estimate protein levels.[14] In protein recombinant, manipulated proteins are produced in large quantities and isotope labeling is a tool to test for relevant proteins. The method used to be about selectively enrich nuclei with 13C or 15N or deplete 1H from them. The recombinant would be expressed in E.coli with media containing 15N-ammonium chloride as a source of nitrogen.[15] The resulting 15N labeled proteins are then purified by immobilized metal affinity and their percentage estimated. In order to increase the yield of labeled proteins and cut down the cost of isotope labeled media, an alternative procedure primarily increases the cell mass using unlabeled media before introducing it in a minimal amount of labeled media.[16] Another application of isotope labeling would be in measuring DNA synthesis,that is cell proliferation in vitro. uses H3-thymidine labeling to compare pattern of synthesis (or sequence) in cells.[17]
Applications for ecosystem process analysis
Isotopic tracers are used to examine processes in natural systems, especially terrestrial and aquatic environments. In soil science 15N tracers are used extensively to study nitrogen cycling, whereas 13C and 14C, stable and radioisotopes of carbon respectively, are used for studying turnover of organic compounds and fixation of CO2 by autotrophs. For example, Marsh et al. (2005) used dual labeled (15N- and 14C) urea to demonstrate utilization of the compound by ammonia oxidizers as both an energy source (ammonia oxidation) and carbon source (chemoautotrophic carbon fixation).[18]
Applications for oceanography
Tracers are also used extensively in oceanography to study a wide array of processes. The isotopes used are typically naturally occurring with well-established sources and rates of formation and decay. However, anthropogenic isotopes may also be used with great success. The researchers measure the isotopic ratios at different locations and times to infer information about the physical processes of the ocean.
Particle transport
The ocean is an extensive network of particle transport. Thorium isotopes can help researchers decipher the vertical and horizontal movement of matter. 234Th has a constant, well-defined production rate in the ocean and a half-life of 24 days. This naturally occurring isotope has been shown to vary linearly with depth. Therefore, any changes in this linear pattern can be attributed to the transport of 234Th on particles. For example, low isotopic ratios in surface water with very high values a few meters down would indicate a vertical flux in the downward direction. Furthermore, the thorium isotope may be traced within a specific depth to decipher the lateral transport of particles.[19]
Circulation
Circulation within local systems, such as bays, estuaries, and groundwater, may be examined with radium isotopes. 223Ra has a half-life of 11 days and can occur naturally at specific locations in rivers and groundwater sources. The isotopic ratio of radium will then decrease as the water from the source river enters a bay or estuary. By measuring the amount of 223Ra at a number of different locations, a circulation pattern can be deciphered.[20] This same exact process can also be used to study the movement and discharge of groundwater.[21]
Various isotopes of lead can be used to study circulation on a global scale. Different oceans (i.e. the Atlantic, Pacific, Indian, etc.) have different isotopic signatures. This results from differences in isotopic ratios of sediments and rocks within the different oceans.[22] Because the different isotopes of lead have half-lives of 50–200 years, there is not enough time for the isotopic ratios to be homogenized throughout the whole ocean. Therefore, precise analysis of Pb isotopic ratios can be used to study the circulation of the different oceans.[23]
Tectonic processes and climate change
Isotopes with extremely long half-lives can be used to study multi-million year processes, such as tectonics and extreme climate change. The isotopic ratio of strontium (half-life ~2 Ma) can be analyzed within ice cores to examine changes over the earth’s lifetime. Differences in this ratio within the ice core would indicate significant alterations in the earth’s geochemistry.[23]
Isotopes related to nuclear weapons
The aforementioned processes can be measured using naturally occurring isotopes. Nevertheless, anthropogenic isotopes are also extremely useful for oceanographic measurements. Nuclear weapons tests released a plethora of uncommon isotopes into the world’s oceans. 3H, 129I, and 137Cs can be found dissolved in seawater, while 241Am and 238Pu are attached to particles. The isotopes dissolved in water are particularly useful in studying global circulation. For example, differences in lateral isotopic ratios within an ocean can indicate strong water fronts or gyres.[24] Conversely, the isotopes attached to particles can be used to study mass transport within water columns. For instance, high levels of Am or Pu can indicate downwelling when observed at great depths, or upwelling when observed at the surface.[25]
Methods for isotopic labeling
- Chemical synthesis
- Enzyme-mediated exchange
- Recombinant protein expression in isotopic labeled media.
See also
- Uses of radionuclides
- Radioactivity in biology
- Radioactive tracer
- Isotopomer
- Isotopologue
- Isobaric labeling
- Isotope dilution
- Infrared spectroscopy of metal carbonyls
References
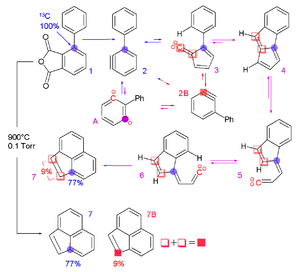
- ↑ Blake, Michael E.; Bartlett, Kevin L.; Jones, Maitland (2003). "Am-Benzyne too-Benzyne Conversion through a 1,2-Shift of a Phenyl Group". Journal of the American Chemical Society. 125 (21): 6485–6490. doi:10.1021/ja0213672. ISSN 0002-7863. PMID 12785789.
- ↑ Dickin, A. P., 2005. Radiogenic Isotope Geology, Cambridge University Press.
- 1 2 Kruger, Nicholas; Antje von Schaewen (2003). "The oxidative pentose phosphate pathway: structure and organisation" (PDF). Current Opinion in Plant Biology. 6: 236–246. doi:10.1016/s1369-5266(03)00039-6. Archived from the original (PDF) on April 15, 2012.
- ↑ Archived April 4, 2012, at the Wayback Machine.
- ↑ Wiechert, Wolfgang (2001). "13C Metabolic Flux Analysis". Metabolic Engineering. 3 (3): 195–206. doi:10.1006/mben.2001.0187. PMID 11461141.
- 1 2 Lee, Sang Yup; Park, Jong Myoung, and Kim, Tae Yong (2011). "Chapter Four: Application of Metabolic Flux Analysis in Metabolic Engineering". Methods in Enzymology. 498: 67–93. doi:10.1016/B978-0-12-385120-8.00004-8. PMID 21601674.
- ↑ Stephanopoulos, Gregory; Aristos A. Aristidou (1998). "Chapter 9: Methods for the Experimental Determination of Metabolic Fluxes by Isotope Labeling". Metabolic engineering: principles and methodologies. San Diego: Academic Press. pp. 356–404. ISBN 0-12-666260-6.
- ↑ Stephanopoulos, Gregory (1999). "Metabolic Fluxes and Metabolic Engineering". Metabolic Engineering. 1 (1): 1–11. doi:10.1006/mben.1998.0101.
- ↑ Klamt, Steffen; Jorg Stelling, Martin Ginkel, and Ernst Dieter Gilles (2003). "FluxAnalyzer: exploring structure, pathways, and flux distributions in metabolic networks on interactive flux maps" (PDF). Bioinformatics. 19 (2): 261–269. doi:10.1093/bioinformatics/19.2.261.
- 1 2 3 4 5 6 Wiechert, Wolfgang (2001). "13C Metabolic Flux Analysis". Metabolic Engineering. 3 (3): 195–206. doi:10.1006/mben.2001.0187. PMID 11461141.
- ↑ de Graaf, A. A. (2000c). Use of 13C labeling and NMR spectroscopy in metabolic flux analysis. In NMR in Biotechnology: Theory and Applications (J.-N. Barbotin and J.-C. Portais, Eds.), Horizon Scientific Press.
- ↑ Christensen, B., and Nielsen, J. (2000). Metabolic network analysis of Penicillium chrysogenum using 13C-labeled glucose. Biotechnol. Bioeng. 68, 652�659.
- 1 2 Dauner, M., and Sauer, U. (2000). GC-MS analysis of amino acids rapidly provides rich information for isotopomer balancing. Biotechnol. Prog. 16, 642-649.
- ↑ "Stable Isotope Labeling with Amino Acid in Cell Culture."SILAC. Paydey Lab, n.d. Web. 23 Nov 2011.
- ↑ Bunk, David.M. "Expression of Stable Isotopically Labeled Proteins for Use as Internal Standards for Mass Spectrometric Quantitation of Clinical Protein Biomarkers." NIST,material measurement laboratory. The National Institute of Standards and Technology (NIST) is an agency of the U.S. Department of Commerce, 30 Mar 2009. Web. 19 Nov 2011.
- ↑ Marley , Jonathan , Min Lu, and Clay Bracken. "A methode for efficient isotopic labeling and recombinent protein." Journal of Biomolecular labeling. 20 (2001): 71–75. Print.
- ↑ German, James. "The pattern of DNA synthesis in the chromosomes of human blood cells ." Rockefeller university press. 20.1 37–65. Print.
- ↑ Marsh, K. L., G. K. Sims, and R. L. Mulvaney. 2005. Availability of urea to autotrophic ammonia-oxidizing bacteria as related to the fate of 14C- and 15N-labeled urea added to soil. Biol. Fert. Soil. 42:137-145.
- ↑ Coppola, L.; Roy-Barman, M.; et al. (2006). "Thorium isotopes as tracers of particles dynamics and deep water circulation in the Indian sector of the Southern Ocean (ANTARES IV)". Marine Chemistry. 100: 299–313. doi:10.1016/j.marchem.2005.10.019.
- ↑ Hougham, A. L.; Moran, S. B.; et al. (2008). "Seasonal changes in submarine groundwater discharge to coastal salt ponds estimated using 226Ra and 228Ra as tracers". Marine Chemistry. 109: 268–278. doi:10.1016/j.marchem.2007.08.001.
- ↑ Swarzenski, P. W.; Reich, C.; et al. (2007). "Ra and Rn isotopes as natural tracers of submarine groundwater discharge in Tampa Bay, Florida". Marine Chemistry. 104: 69–84. doi:10.1016/j.marchem.2006.08.001.
- ↑ Hickey-Vargas, R.; Bizimis, M.; Deschamps, A. (2008). "Onset of the Indian Ocean isotopic signature in the Philippine Sea Plate: Hf and Pb isotope evidence from Early Cretaceous terranes". Earth and Planetary Science Letters. 268: 255–267. Bibcode:2008E&PSL.268..255H. doi:10.1016/j.epsl.2008.01.003.
- 1 2 Haley, B. A.; Frank, M.; et al. (2008). "Radiogenic isotope record of Arctic Ocean circulation and weathering inputs of the past 15 million years". Paleoceanography. 23: PA1S13. Bibcode:2008PalOc..23.1S13H. doi:10.1029/2007PA001486.
- ↑ Povinec, P. P.; Breier, R.; et al. (2011). "Tracing of water masses using a multi isotope approach in the southern Indian Ocean". Earth and Planetary Science Letters. 302: 14–26. Bibcode:2011E&PSL.302...14P. doi:10.1016/j.epsl.2010.11.026.
- ↑ Lee, S.-H.; Povinec, P. P.; et al. (2009). "Radionuclides as tracers of water fronts in the South Indian Ocean – ANTARES IV Results". Journal of Oceanography. 65: 397–406. doi:10.1007/s10872-009-0035-7.
External links
| Library resources about Isotopic labeling |