Isanti County, Minnesota
| Isanti County, Minnesota | |
|---|---|
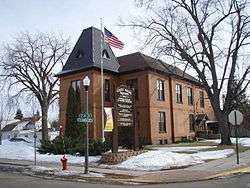 Isanti County Courthouse | |
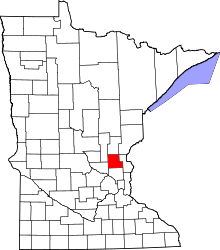 Location in the U.S. state of Minnesota | |
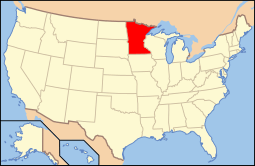 Minnesota's location in the U.S. | |
| Founded | February 13, 1857[1] |
| Named for | Izaty Indians, the ancient name for the Santee Indians, members of the Dakota alliance |
| Seat | Cambridge |
| Largest city | Cambridge |
| Area | |
| • Total | 452 sq mi (1,171 km2) |
| • Land | 436 sq mi (1,129 km2) |
| • Water | 16 sq mi (41 km2), 3.5% |
| Population (est.) | |
| • (2015) | 38,429 |
| • Density | 87/sq mi (34/km²) |
| Congressional district | 8th |
| Time zone | Central: UTC-6/-5 |
| Website |
www |
Isanti County (/aɪˈsæntiː/ eye-SAN-tee) is a county located in the U.S. state of Minnesota. As of the 2010 census, the population was 37,816.[2] Its county seat is Cambridge.[3] Isanti is derived from the Dakota word meaning "knife" and refers to the Santee tribe.[4]
Isanti County is included in the Minneapolis-St. Paul-Bloomington, MN Metropolitan Statistical Area.
Geography
According to the U.S. Census Bureau, the county has a total area of 452 square miles (1,170 km2), of which 436 square miles (1,130 km2) is land and 16 square miles (41 km2) (3.5%) is water.[5]

Major highways
 Minnesota State Highway 47
 Minnesota State Highway 65
 Minnesota State Highway 95
 Minnesota State Highway 107
- List of county roads
Adjacent counties
- Kanabec County (north)
- Pine County (northeast)
- Chisago County (east)
- Anoka County (south)
- Sherburne County (southwest)
- Mille Lacs County (northwest)
Demographics
| Historical population | |||
|---|---|---|---|
| Census | Pop. | %± | |
| 1860 | 284 | — | |
| 1870 | 2,035 | 616.5% | |
| 1880 | 5,063 | 148.8% | |
| 1890 | 7,607 | 50.2% | |
| 1900 | 11,675 | 53.5% | |
| 1910 | 12,615 | 8.1% | |
| 1920 | 13,278 | 5.3% | |
| 1930 | 12,081 | −9.0% | |
| 1940 | 12,950 | 7.2% | |
| 1950 | 12,123 | −6.4% | |
| 1960 | 13,530 | 11.6% | |
| 1970 | 16,560 | 22.4% | |
| 1980 | 23,600 | 42.5% | |
| 1990 | 25,921 | 9.8% | |
| 2000 | 31,287 | 20.7% | |
| 2010 | 37,816 | 20.9% | |
| Est. 2015 | 38,429 | [7] | 1.6% |
| U.S. Decennial Census[8] 1790-1960[9] 1900-1990[10] 1990-2000[11] 2010-2015[2] | |||

As of the census of 2000,[12] there were 37,816 people, 14,331 households, and 8,415 families residing in the county. The population density was 71 people per square mile (28/km²). There were 12,062 housing units at an average density of 28 per square mile (11/km²). The racial makeup of the county was 96.0% White, 0.6% Black or African American, 0..5% Native American, 0.8% Asian, 0% Pacific Islander, 1.6% from other races, and 0.94% from two or more races. 1.5% of the population were Hispanic or Latino of any race. 30.3% were of German, 21.3% Swedish, 12.7% Norwegian and 5.1% Irish ancestry.
There were 11,236 households out of which 38.10% had children under the age of 18 living with them, 62.10% were married couples living together, 8.40% had a female householder with no husband present, and 25.10% were non-families. 20.10% of all households were made up of individuals and 8.20% had someone living alone who was 65 years of age or older. The average household size was 2.74 and the average family size was 3.15.
In the county the population was spread out with 28.70% under the age of 18, 7.80% from 18 to 24, 30.40% from 25 to 44, 22.20% from 45 to 64, and 10.80% who were 65 years of age or older. The median age was 36 years. For every 100 females there were 100.50 males. For every 100 females age 18 and over, there were 98.80 males.
The median income for a household in the county was $50,127, and the median income for a family was $55,996. Males had a median income of $39,381 versus $26,427 for females. The per capita income for the county was $20,348. About 4.00% of families and 5.70% of the population were below the poverty line, including 5.70% of those under age 18 and 8.60% of those age 65 or over.
Politics
| Election results from statewide races[13] | ||||
|---|---|---|---|---|
| Year | Office | GOP | DEM | Others |
| 2016 | President | 64.9% | 27.0% | 8.2% |
| 2014 | Governor | 54.3% | 39.5% | 6.2% |
| Senator | 52.2% | 43.2% | 3.6% | |
| 2012 | President | 57.7% | 39.7% | 2.6% |
| Senator | 38.1% | 57.1% | 4.8% | |
| 2010 | Governor | 53.4% | 35.5% | 11.1% |
| 2008 | President | 56.6% | 41.1% | 2.3% |
| Senator | 48.0% | 32.9% | 19.1% | |
| 2006 | Governor | 53.4% | 39.9% | 6.7% |
| Senator | 45.2% | 50.9% | 3.9% | |
| 2004 | President | 57.9% | 40.8% | 1.3% |
| 2002 | Governor | 53.0% | 32.1% | 14.9% |
| Senator | 56.4% | 40.6% | 3.0% | |
| 2000 | President | 51.4% | 41.8% | 6.8% |
| Senator | 51.4% | 40.2% | 8.3% | |
| 1998 | Governor | 27.3% | 19.6% | 53.1% |
| 1996 | President | 34.3% | 46.6% | 19.1% |
| Senator | 40.9% | 47.8% | 11.3% | |
| 1994 | Governor | 61.0% | 36.0% | 3.0% |
| Senator | 53.2% | 38.7% | 8.1% | |
| 1992 | President | 29.8% | 40.3% | 29.9% |
This rural turned exurban county is much more conservative than the state as a whole. In 2008, John McCain won this county with almost 57% of the vote, when he lost the state with just 44% of the vote. Norm Coleman also did very well, obtaining 48% of the vote while losing the state with 42%. Also, both George W. Bush and Tim Pawlenty won this county twice, winning a majority of the county each time.
Democrats tend to do very poorly here. In 2008, Barack Obama obtained just 41% while he won the state with 54% of the vote. Al Franken did very poorly, getting just 33% of the vote. Since 1992, just one Democrat won this county with over 50% of the vote. In 2016, Donald Trump won almost 65% of the vote in the county while he lost the state to Hillary Clinton.
Independents also do very well in this county. In 1998, the county's results were Jesse Ventura's best performance in the state, winning the county with over 50% of the vote. Ross Perot came in a close third place with 29% of the vote while getting 24% statewide.
Communities
Cities
- Braham (partly in Kanabec County)
- Cambridge (county seat)
- Isanti
Townships
Unincorporated communities
See also
References
- ↑ "Minnesota Place Names". Minnesota Historical Society. Retrieved March 18, 2014.
- 1 2 "State & County QuickFacts". United States Census Bureau. Retrieved September 1, 2013.
- ↑ "Find a County". National Association of Counties. Retrieved 2011-06-07.
- ↑ Gannett, Henry (1905). The Origin of Certain Place Names in the United States. Govt. Print. Off. p. 166.
- ↑ "2010 Census Gazetteer Files". United States Census Bureau. August 22, 2012. Retrieved October 18, 2014.
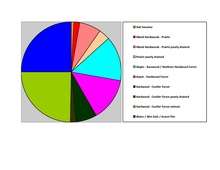
- ↑ Nelson, Steven (2011). Savanna Soils of Minnesota. Minnesota: Self. pp. 61 - 64. ISBN 978-0-615-50320-2.
- ↑ "County Totals Dataset: Population, Population Change and Estimated Components of Population Change: April 1, 2010 to July 1, 2015". Retrieved July 2, 2016.
- ↑ "U.S. Decennial Census". United States Census Bureau. Retrieved October 18, 2014.
- ↑ "Historical Census Browser". University of Virginia Library. Retrieved October 18, 2014.
- ↑ "Population of Counties by Decennial Census: 1900 to 1990". United States Census Bureau. Retrieved October 18, 2014.
- ↑ "Census 2000 PHC-T-4. Ranking Tables for Counties: 1990 and 2000" (PDF). United States Census Bureau. Retrieved October 18, 2014.
- ↑ "American FactFinder". United States Census Bureau. Retrieved 2008-01-31.
- ↑ http://uselectionatlas.org/RESULTS/
External links
 |
Mille Lacs County | Kanabec County | Pine County | |
| |
Chisago County | |||
| ||||
| | ||||
| Sherburne County | Anoka County |
Municipalities and communities of Isanti County, Minnesota, United States | ||
|---|---|---|
| Cities | | |
| Townships | ||
| CDP | ||
| Unincorporated communities | ||
| Ghost town | ||
| Footnotes | ‡This populated place also has portions in an adjacent county or counties | |
Coordinates: 45°34′N 93°17′W / 45.56°N 93.29°W