Irish population analysis
The population of the Island of Ireland in 2012 was approximately 6.4 million comprising 4.58 million in the Republic of Ireland with another 1.8 million in Northern Ireland. Although this is a significant growth over recent years, it is still some way below the record high of the early 1840s.
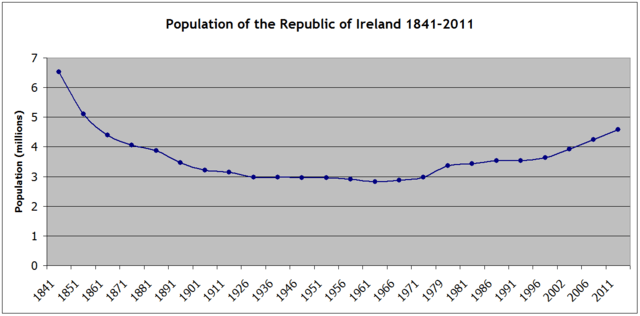
Between 1780 and 1840, Ireland experienced rapid population growth, rising from about 3 million in 1780 to over 8 million by 1840. In 1841, the population of the area now covering the Republic of Ireland was over 6.5 million people. The subsequent Great Famine and the emigration it caused had a dramatic effect, so that by 1871, the 26-county population had dropped by over a third to four million, and by 1926 had reduced further to three million. It held firm around three million until the early 1970s, when the population began to rise again. Future predictions are for the population to continue to rise until 2031 when it is predicted to be just over five million.[1] The Republic of Ireland is one of the few remaining developed economies to have growth of this scale.
Below are some statistics to illustrate the rise, fall and rise again of the population since 1841. The statistics also illustrate a massive population shift from the west to the east of the country and increasing urbanisation. Counties such as Mayo, Roscommon, Donegal and Leitrim have become depopulated while counties surrounding Dublin including Wicklow, Kildare, Louth and Meath have seen rapid population growth in recent years.
Historical country population
- Data for country population refers to the 26 counties that make up the present state of the Republic of Ireland
| Year |
Population |
%Change |
|---|
| 2016 |
4.76m |
 3.7 3.7 |
| 2011 |
4.58m |
7.4 |
| 2006 |
4.24m |
8.1 |
| 2002 |
3.92m |
8.2 |
| 1996 |
3.63m |
2.9 |
| 1991 |
3.53m |
 0.6 0.6 |
| 1986 |
3.54m |
2.8 |
| 1981 |
3.44m |
2.3 |
| 1979 |
3.37m |
13.2 |
| 1971 |
2.98m |
3.2 |
| 1966 |
2.88m |
2.3 |
| 1961 |
2.82m |
2.7 |
| 1956 |
2.90m |
2.2 |
| 1951 |
2.96m |
0.3 |
| 1946 |
2.96m |
0.5 |
| 1936 |
2.97m |
0.2 |
| 1926 |
2.97m |
5.4 |
| 1911 |
3.14m |
2.6 |
| 1901 |
3.22m |
7.1 |
| 1891 |
3.47m |
10.3 |
| 1881 |
3.87m |
4.5 |
| 1871 |
4.05m |
5.7 |
| 1861 |
4.40m |
13.9 |
| 1851 |
5.11m |
21.7 |
| 1841 |
6.53m |
|
The population of the 6 counties of Northern Ireland as of 2004 is 1,710,300 which would mean a total population on the island of Ireland as of 2006 of approximately 5,952,786.
County populations 2016
|
County |
Population |
%Change |
|
County |
Population |
%Change |
|---|
| 1 |
Dublin |
1,345,402 |
+5.9 |
|
Antrim |
618,109 |
+1.8 |
| 2 |
Cork |
542,196 |
+4.7 |
|
Down |
531,665 |
+8.7 |
| 3 |
Galway |
258,552 |
+3.2 |
|
Londonderry |
247,132 |
+4.8 |
| 4 |
Kildare |
222,130 |
+5.8 |
|
Tyrone |
177,986 |
+8.4 |
| 5 |
Limerick |
195,175 |
+2.0 |
|
Armagh |
174,792 |
+7.3 |
| 6 |
Meath |
194,942 |
+5.9 |
|
Fermanagh |
61,170 |
+6.3 |
| 7 |
Tipperary |
160,441 |
+1.1 |
| 8 |
Donegal |
158,753 |
-1.4 |
| 9 |
Wexford |
149,605 |
+3.0 |
| 10 |
Kerry |
147,554 |
+1.7 |
| 11 |
Wicklow |
142,232 |
+4.2 |
| 12 |
Mayo |
130,425 |
-0.1 |
| 13 |
Louth |
128,375 |
+4.5 |
| 14 |
Clare |
118,627 |
+1.5 |
| 15 |
Waterford |
116,401 |
+2.4 |
| 16 |
Kilkenny |
99,118 |
+3.9 |
| 17 |
Westmeath |
88,396 |
+2.8 |
| 18 |
Laois |
84,732 |
+5.3 |
| 19 |
Offaly |
78,003 |
+1.6 |
| 20 |
Cavan |
76,092 |
+4.4 |
| 21 |
Sligo |
65,357 |
-0.1 |
| 22 |
Roscommon |
64,436 |
+0.8 |
| 23 |
Monaghan |
61,273 |
+1.3 |
| 24 |
Carlow |
56,875 |
+4.3 |
| 25 |
Longford |
40,810 |
+4.7 |
| 26 |
Leitrim |
31,972 |
+0.6 |
See also List of Irish counties by population
Historical populations per province
(Measured in 1000's)
Data for Ulster refers to the 3 counties of Ulster that constitute part of the Republic of Ireland: Cavan, Donegal and Monaghan
Leinster
| Year |
2016 |
2011 |
2006 |
2002 |
1996 |
1991 |
1986 |
1981 |
1979 |
1971 |
1966 |
1961 |
1956 |
1951 |
1946 |
1936 |
1926 |
1911 |
1901 |
1891 |
1881 |
1871 |
1861 |
1851 |
1841 |
|---|
| Population |
2,631 |
2,501 |
2,292 |
2,103 |
1,920 |
1,858 |
1,851 |
1,789 |
1,741 |
1,495 |
1,413 |
1,330 |
1,336 |
1,336 |
1,278 |
1,217 |
1,147 |
1,160 |
1,152 |
1,186 |
1,276 |
1,336 |
1,454 |
1,668 |
1,969 |
| Rank |
1 |
1 |
1 |
1 |
1 |
1 |
1 |
1 |
1 |
1 |
1 |
1 |
1 |
1 |
1 |
1 |
1 |
1 |
1 |
1 |
2 |
2 |
2 |
2 |
2 |
| %Change |
5.2 |
9 |
9 |
9.53 |
3.34 |
0.38 |
3.47 |
2.76 |
16.45 |
5.8 |
6.24 |
-(0.45) |
0 |
4.54 |
5.01 |
6.10 |
-(1.12) |
0.69 |
-(2.87) |
-(7.05) |
-(4.49) |
-(8.12) |
-(12.83) |
-(15.29) |
|
Munster
| Year |
2016 |
2011 |
2006 |
2002 |
1996 |
1991 |
1986 |
1981 |
1979 |
1971 |
1966 |
1961 |
1956 |
1951 |
1946 |
1936 |
1926 |
1911 |
1901 |
1891 |
1881 |
1871 |
1861 |
1851 |
1841 |
|---|
| Population |
1,280 |
1,244 |
1,173 |
1,098 |
1,032 |
1,004 |
1,018 |
996 |
978 |
879 |
856 |
847 |
874 |
897 |
914 |
940 |
968 |
1,033 |
1,073 |
1,169 |
1,328 |
1,390 |
1,510 |
1,856 |
2,394 |
| Rank |
2 |
2 |
2 |
2 |
2 |
2 |
2 |
2 |
2 |
2 |
2 |
2 |
2 |
2 |
2 |
2 |
2 |
2 |
2 |
2 |
1 |
1 |
1 |
1 |
1 |
| %Change |
2.9 |
6.0 |
6.83 |
6.4 |
2.79 |
-(1.38) |
2.21 |
1.84 |
11.26 |
2.69 |
1.06 |
-(3.09) |
-(2.56) |
-(1.86) |
-(2.77) |
-(2.89) |
-(6.29) |
-(3.73) |
-(8.21) |
-(11.97) |
-(4.46) |
-(7.95) |
-(18.64) |
-(22.47) |
|
Connacht
| Year |
2016 |
2011 |
2006 |
2002 |
1996 |
1991 |
1986 |
1981 |
1979 |
1971 |
1966 |
1961 |
1956 |
1951 |
1946 |
1936 |
1926 |
1911 |
1901 |
1891 |
1881 |
1871 |
1861 |
1851 |
1841 |
|---|
| Population |
551 |
542 |
504 |
464 |
431 |
421 |
431 |
424 |
418 |
390 |
401 |
418 |
446 |
471 |
493 |
525 |
552 |
611 |
646 |
724 |
820 |
846 |
911 |
1,008 |
1,417 |
| Rank |
3 |
3 |
3 |
3 |
3 |
3 |
3 |
3 |
3 |
3 |
3 |
3 |
3 |
3 |
3 |
3 |
3 |
3 |
3 |
3 |
3 |
3 |
3 |
3 |
3 |
| %Change |
1.7 |
7.5 |
8.62 |
7.66 |
2.38 |
-(2.32) |
1.65 |
1.44 |
7.18 |
-(2.74) |
-(4.07) |
-(6.28) |
-(5.31) |
-(4.46) |
-(6.10) |
-(4.89) |
-(9.66) |
-(5.42) |
-(10.77) |
-(11.71) |
-(3.07) |
-(7.14) |
-(9.62) |
-(28.86) |
|
Ulster
| Year |
2016 |
2011 |
2006 |
2002 |
1996 |
1991 |
1986 |
1981 |
1979 |
1971 |
1966 |
1961 |
1956 |
1951 |
1946 |
1936 |
1926 |
1911 |
1901 |
1891 |
1881 |
1871 |
1861 |
1851 |
1841 |
|---|
| Population |
296 |
294 |
267 |
247 |
233 |
232 |
236 |
230 |
226 |
207 |
209 |
218 |
236 |
253 |
263 |
280 |
300 |
331 |
347 |
385 |
438 |
474 |
517 |
571 |
739 |
| Rank |
4 |
4 |
4 |
4 |
4 |
4 |
4 |
4 |
4 |
4 |
4 |
4 |
4 |
4 |
4 |
4 |
4 |
4 |
4 |
4 |
4 |
4 |
4 |
4 |
4 |
| %Change |
0.7 |
10.1 |
8.1 |
6.01 |
0.43 |
-(1.69) |
2.61 |
1.77 |
9.18 |
-(0.96) |
-(4.13) |
-(7.63) |
-(6.72) |
-(3.80) |
-(6.07) |
-(6.67) |
-(9.37) |
-(4.61) |
-(9.87) |
-(12.10) |
-(7.59) |
-(8.32) |
-(9.46) |
-(22.73) |
|
Historical populations per county
(Measured in 1000's)
Dublin
| Year |
2016 |
2011 |
2006 |
2002 |
1996 |
1991 |
1986 |
1981 |
1979 |
1971 |
1966 |
1961 |
1956 |
1951 |
1946 |
1936 |
1926 |
1911 |
1901 |
1891 |
1881 |
1871 |
1861 |
1851 |
1841 |
|---|
| Population |
1,345 |
1,271 |
1,186 |
1,122 |
1,058 |
1,025 |
1,021 |
1,003 |
983 |
852 |
795 |
718 |
705 |
693 |
636 |
586 |
505 |
477 |
448 |
419 |
418 |
405 |
410 |
405 |
372 |
| Rank |
1 |
1 |
1 |
1 |
1 |
1 |
1 |
1 |
1 |
1 |
1 |
1 |
1 |
1 |
1 |
1 |
1 |
1 |
1 |
2 |
2 |
2 |
2 |
2 |
5 |
| %Change |
5.8 |
7.0 |
5.7 |
6.05 |
3.22 |
0.39 |
|
|
|
|
|
|
|
|
|
|
|
|
|
|
3.21 |
−1.22 |
1.23 |
8.87 |
|
Cork
| Year |
2016 |
2011 |
2006 |
2002 |
1996 |
1991 |
1986 |
1981 |
1979 |
1971 |
1966 |
1961 |
1956 |
1951 |
1946 |
1936 |
1926 |
1911 |
1901 |
1891 |
1881 |
1871 |
1861 |
1851 |
1841 |
|---|
| Population |
542 |
519 |
481 |
447 |
420 |
410 |
412 |
402 |
396 |
352 |
339 |
330 |
336 |
341 |
343 |
355 |
365 |
391 |
404 |
438 |
495 |
517 |
544 |
649 |
854 |
| Rank |
2 |
2 |
2 |
2 |
2 |
2 |
2 |
2 |
2 |
2 |
2 |
2 |
2 |
2 |
2 |
2 |
2 |
2 |
2 |
1 |
1 |
1 |
1 |
1 |
1 |
| %Change |
4.4 |
7.7 |
7.61 |
6.43 |
2.44 |
−0.49 |
|
|
|
|
|
|
|
|
|
|
|
|
|
|
−4.26 |
−4.96 |
−16.18 |
−24 |
|
Galway
| Year |
2016 |
2011 |
2006 |
2002 |
1996 |
1991 |
1986 |
1981 |
1979 |
1971 |
1966 |
1961 |
1956 |
1951 |
1946 |
1936 |
1926 |
1911 |
1901 |
1891 |
1881 |
1871 |
1861 |
1851 |
1841 |
|---|
| Population |
258 |
251 |
231 |
209 |
188 |
180 |
178 |
172 |
167 |
149 |
148 |
149 |
155 |
160 |
165 |
168 |
169 |
182 |
192 |
214 |
242 |
248 |
271 |
321 |
440 |
| Rank |
3 |
3 |
3 |
3 |
3 |
3 |
3 |
3 |
3 |
3 |
3 |
3 |
3 |
3 |
3 |
3 |
4 |
4 |
4 |
4 |
4 |
3 |
3 |
4 |
2 |
| %Change |
2.8 |
8.1 |
10.53 |
11.17 |
4.44 |
1.12 |
|
|
|
|
|
|
|
|
|
|
|
|
|
|
−2.42 |
−8.49 |
−15.58 |
−27.05 |
|
Kildare
| Year |
2016 |
2011 |
2006 |
2002 |
1996 |
1991 |
1986 |
1981 |
1979 |
1971 |
1966 |
1961 |
1956 |
1951 |
1946 |
1936 |
1926 |
1911 |
1901 |
1891 |
1881 |
1871 |
1861 |
1851 |
1841 |
|---|
| Population |
222 |
210 |
186 |
163 |
134 |
122 |
116 |
104 |
97 |
71 |
66 |
64 |
65 |
66 |
64 |
57 |
58 |
66 |
63 |
70 |
75 |
83 |
90 |
95 |
114 |
| Rank |
4 |
4 |
4 |
5 |
5 |
7 |
8 |
9 |
9 |
13 |
14 |
14 |
14 |
14 |
17 |
20 |
19 |
17 |
20 |
20 |
20 |
20 |
21 |
24 |
25 |
| %Change |
5.7 |
12.7 |
14.11 |
21.64 |
9.84 |
5.17 |
|
|
|
|
|
|
|
|
|
|
|
|
|
|
−9.64 |
−7.78 |
−5.26 |
−16.67 |
|
Limerick
| Year |
2016 |
2011 |
2006 |
2002 |
1996 |
1991 |
1986 |
1981 |
1979 |
1971 |
1966 |
1961 |
1956 |
1951 |
1946 |
1936 |
1926 |
1911 |
1901 |
1891 |
1881 |
1871 |
1861 |
1851 |
1841 |
|---|
| Population |
195 |
191 |
184 |
175 |
165 |
161 |
164 |
161 |
157 |
140 |
137 |
133 |
137 |
141 |
142 |
141 |
140 |
143 |
146 |
158 |
180 |
191 |
217 |
262 |
330 |
| Rank |
5 |
5 |
5 |
4 |
4 |
4 |
4 |
4 |
4 |
4 |
4 |
4 |
4 |
4 |
5 |
6 |
7 |
8 |
8 |
8 |
8 |
8 |
7 |
6 |
6 |
| %Change |
2.1 |
4.01 |
5.14 |
6.06 |
2.48 |
−1.83 |
|
|
|
|
|
|
|
|
|
|
|
|
|
|
−5.76 |
−11.98 |
−17.18 |
−20.61 |
|
Meath
| Year |
2016 |
2011 |
2006 |
2002 |
1996 |
1991 |
1986 |
1981 |
1979 |
1971 |
1966 |
1961 |
1956 |
1951 |
1946 |
1936 |
1926 |
1911 |
1901 |
1891 |
1881 |
1871 |
1861 |
1851 |
1841 |
|---|
| Population |
194 |
184 |
163 |
134 |
109 |
105 |
103 |
95 |
90 |
71 |
67 |
65 |
66 |
66 |
66 |
61 |
62 |
65 |
67 |
76 |
87 |
95 |
110 |
140 |
183 |
| Rank |
6 |
6 |
6 |
8 |
10 |
10 |
10 |
11 |
11 |
13 |
13 |
13 |
13 |
14 |
14 |
17 |
18 |
18 |
18 |
18 |
18 |
18 |
17 |
16 |
16 |
| %Change |
5.4 |
13.0 |
21.6 |
22.94 |
3.81 |
1.94 |
|
|
|
|
|
|
|
|
|
|
|
|
|
|
−8.42 |
−13.64 |
−21.43 |
−23.5 |
|
Tipperary
| Year |
2016 |
2011 |
2006 |
2002 |
1996 |
1991 |
1986 |
1981 |
1979 |
1971 |
1966 |
1961 |
1956 |
1951 |
1946 |
1936 |
1926 |
1911 |
1901 |
1891 |
1881 |
1871 |
1861 |
1851 |
1841 |
|---|
| Population |
160 |
159 |
149 |
140 |
133 |
131 |
136 |
134 |
133 |
123 |
121 |
123 |
128 |
133 |
135 |
137 |
140 |
151 |
159 |
172 |
199 |
216 |
248 |
331 |
435 |
| Rank |
7 |
8 |
7 |
6 |
6 |
5 |
5 |
5 |
5 |
5 |
5 |
5 |
6 |
6 |
7 |
8 |
7 |
7 |
7 |
7 |
7 |
6 |
5 |
3 |
3 |
| %Change |
0.6 |
6.4 |
6.43 |
5.26 |
1.53 |
−3.68 |
|
|
|
|
|
|
|
|
|
|
|
|
|
|
−8.87 |
−12.9 |
−25.08 |
−23.91 |
|
Donegal
| Year |
2016 |
2011 |
2006 |
2002 |
1996 |
1991 |
1986 |
1981 |
1979 |
1971 |
1966 |
1961 |
1956 |
1951 |
1946 |
1936 |
1926 |
1911 |
1901 |
1891 |
1881 |
1871 |
1861 |
1851 |
1841 |
|---|
| Population |
158 |
161 |
147 |
137 |
129 |
128 |
130 |
125 |
122 |
108 |
109 |
114 |
122 |
114 |
136 |
142 |
153 |
169 |
174 |
187 |
206 |
218 |
237 |
255 |
296 |
| Rank |
8 |
7 |
8 |
7 |
7 |
7 |
6 |
6 |
6 |
6 |
8 |
8 |
8 |
7 |
6 |
5 |
5 |
5 |
5 |
5 |
5 |
5 |
6 |
7 |
7 |
| %Change |
-1.9 |
9.3 |
7.3 |
6.2 |
0.78 |
−1.54 |
|
|
|
|
|
|
|
|
|
|
|
|
|
|
−5.5 |
−8.02 |
−7.06 |
−13.85 |
|
Wexford
| Year |
2016 |
2011 |
2006 |
2002 |
1996 |
1991 |
1986 |
1981 |
1979 |
1971 |
1966 |
1961 |
1956 |
1951 |
1946 |
1936 |
1926 |
1911 |
1901 |
1891 |
1881 |
1871 |
1861 |
1851 |
1841 |
|---|
| Population |
149 |
145 |
132 |
116 |
104 |
102 |
103 |
99 |
96 |
86 |
83 |
83 |
87 |
90 |
92 |
94 |
96 |
102 |
104 |
112 |
123 |
132 |
143 |
180 |
202 |
| Rank |
9 |
9 |
10 |
11 |
11 |
11 |
10 |
10 |
10 |
9 |
9 |
9 |
9 |
9 |
9 |
9 |
9 |
10 |
10 |
11 |
12 |
12 |
12 |
10 |
12 |
| %Change |
2.8 |
10.3 |
13.79 |
11.54 |
1.96 |
−0.97 |
|
|
|
|
|
|
|
|
|
|
|
|
|
|
−6.82 |
−7.69 |
−20.56 |
−10.89 |
|
Kerry
| Year |
2016 |
2011 |
2006 |
2002 |
1996 |
1991 |
1986 |
1981 |
1979 |
1971 |
1966 |
1961 |
1956 |
1951 |
1946 |
1936 |
1926 |
1911 |
1901 |
1891 |
1881 |
1871 |
1861 |
1851 |
1841 |
|---|
| Population |
147 |
145 |
140 |
132 |
126 |
121 |
124 |
122 |
120 |
112 |
112 |
116 |
122 |
126 |
133 |
139 |
149 |
159 |
165 |
179 |
201 |
196 |
201 |
238 |
293 |
| Rank |
10 |
10 |
9 |
9 |
8 |
8 |
7 |
7 |
7 |
6 |
7 |
7 |
7 |
8 |
8 |
7 |
6 |
6 |
6 |
6 |
6 |
7 |
8 |
8 |
8 |
| %Change |
1.4 |
3.7 |
6.06 |
4.76 |
4.13 |
−2.42 |
|
|
|
|
|
|
|
|
|
|
|
|
|
|
2.55 |
−2.49 |
−15.55 |
−18.77 |
|
Wicklow
| Year |
2016 |
2011 |
2006 |
2002 |
1996 |
1991 |
1986 |
1981 |
1979 |
1971 |
1966 |
1961 |
1956 |
1951 |
1946 |
1936 |
1926 |
1911 |
1901 |
1891 |
1881 |
1871 |
1861 |
1851 |
1841 |
|---|
| Population |
142 |
136 |
126 |
114 |
102 |
97 |
95 |
87 |
84 |
66 |
60 |
58 |
60 |
63 |
60 |
59 |
58 |
61 |
61 |
62 |
70 |
78 |
86 |
98 |
126 |
| Rank |
11 |
11 |
11 |
12 |
12 |
12 |
12 |
15 |
15 |
15 |
15 |
17 |
18 |
18 |
19 |
19 |
19 |
21 |
22 |
24 |
24 |
22 |
24 |
23 |
23 |
| %Change |
4.4 |
8.1 |
10.53 |
11.76 |
5.15 |
2.11 |
|
|
|
|
|
|
|
|
|
|
|
|
|
|
−10.26 |
−9.3 |
−12.24 |
−22.22 |
|
Mayo
| Year |
2016 |
2011 |
2006 |
2002 |
1996 |
1991 |
1986 |
1981 |
1979 |
1971 |
1966 |
1961 |
1956 |
1951 |
1946 |
1936 |
1926 |
1911 |
1901 |
1891 |
1881 |
1871 |
1861 |
1851 |
1841 |
|---|
| Population |
130 |
131 |
124 |
117 |
111 |
110 |
115 |
114 |
114 |
109 |
115 |
123 |
133 |
141 |
148 |
161 |
172 |
192 |
199 |
219 |
245 |
246 |
254 |
274 |
388 |
| Rank |
12 |
12 |
12 |
10 |
9 |
9 |
9 |
8 |
8 |
7 |
6 |
5 |
5 |
4 |
4 |
4 |
3 |
3 |
3 |
3 |
3 |
4 |
4 |
5 |
4 |
| %Change |
- 0.8 |
5.4 |
7.09 |
9.41 |
0.91 |
−8.09 |
|
|
|
|
|
|
|
|
|
|
|
|
|
|
−0.41 |
−3.15 |
−7.3 |
−39.87 |
|
Louth
| Year |
2016 |
2011 |
2006 |
2002 |
1996 |
1991 |
1986 |
1981 |
1979 |
1971 |
1966 |
1961 |
1956 |
1951 |
1946 |
1936 |
1926 |
1911 |
1901 |
1891 |
1881 |
1871 |
1861 |
1851 |
1841 |
|---|
| Population |
128 |
123 |
111 |
102 |
92 |
91 |
92 |
89 |
86 |
75 |
70 |
67 |
69 |
69 |
66 |
64 |
63 |
64 |
66 |
71 |
78 |
84 |
91 |
108 |
128 |
| Rank |
13 |
13 |
13 |
14 |
15 |
13 |
13 |
12 |
13 |
11 |
12 |
12 |
12 |
12 |
14 |
16 |
17 |
19 |
19 |
19 |
19 |
19 |
19 |
22 |
22 |
| %Change |
4.06 |
10.4 |
8.82 |
10.87 |
1.1 |
−1.09 |
|
|
|
|
|
|
|
|
|
|
|
|
|
|
−7.14 |
−7.69 |
−15.74 |
−15.63 |
|
Clare
| Year |
2016 |
2011 |
2006 |
2002 |
1996 |
1991 |
1986 |
1981 |
1979 |
1971 |
1966 |
1961 |
1956 |
1951 |
1946 |
1936 |
1926 |
1911 |
1901 |
1891 |
1881 |
1871 |
1861 |
1851 |
1841 |
|---|
| Population |
118 |
117 |
111 |
103 |
94 |
90 |
91 |
88 |
85 |
75 |
74 |
74 |
77 |
81 |
85 |
90 |
95 |
104 |
112 |
124 |
141 |
147 |
166 |
212 |
286 |
| Rank |
14 |
14 |
13 |
13 |
13 |
15 |
14 |
14 |
14 |
11 |
10 |
10 |
10 |
10 |
10 |
10 |
10 |
9 |
9 |
9 |
9 |
9 |
9 |
9 |
9 |
| %Change |
0.9 |
5.3 |
7.77 |
9.57 |
4.44 |
−1.1 |
|
|
|
|
|
|
|
|
|
|
|
|
|
|
−4.08 |
−11.45 |
−21.7 |
−25.87 |
|
Waterford
| Year |
2016 |
2011 |
2006 |
2002 |
1996 |
1991 |
1986 |
1981 |
1979 |
1971 |
1966 |
1961 |
1956 |
1951 |
1946 |
1936 |
1926 |
1911 |
1901 |
1891 |
1881 |
1871 |
1861 |
1851 |
1841 |
|---|
| Population |
116 |
114 |
108 |
102 |
94 |
91 |
91 |
89 |
87 |
77 |
73 |
71 |
74 |
75 |
76 |
78 |
79 |
84 |
87 |
98 |
112 |
123 |
134 |
164 |
196 |
| Rank |
15 |
15 |
15 |
15 |
13 |
13 |
14 |
12 |
12 |
10 |
11 |
11 |
11 |
11 |
11 |
11 |
13 |
13 |
13 |
13 |
13 |
13 |
13 |
13 |
15 |
| %Change |
1.8 |
5.3 |
6.93 |
7.45 |
3.3 |
0 |
|
|
|
|
|
|
|
|
|
|
|
|
|
|
−8.94 |
−8.21 |
−18.29 |
−16.33 |
|
Kilkenny
| Year |
2016 |
2011 |
2006 |
2002 |
1996 |
1991 |
1986 |
1981 |
1979 |
1971 |
1966 |
1961 |
1956 |
1951 |
1946 |
1936 |
1926 |
1911 |
1901 |
1891 |
1881 |
1871 |
1861 |
1851 |
1841 |
|---|
| Population |
99 |
95 |
87 |
80 |
75 |
73 |
73 |
70 |
69 |
61 |
60 |
61 |
64 |
65 |
66 |
68 |
70 |
74 |
79 |
87 |
99 |
109 |
124 |
158 |
202 |
| Rank |
16 |
16 |
16 |
16 |
16 |
16 |
16 |
16 |
16 |
16 |
15 |
15 |
15 |
17 |
14 |
14 |
15 |
15 |
15 |
15 |
16 |
16 |
15 |
14 |
12 |
| %Change |
4.2 |
8.9 |
8.75 |
6.67 |
2.74 |
0 |
|
|
|
|
|
|
|
|
|
|
|
|
|
|
−9.17 |
−12.1 |
−21.52 |
−21.78 |
|
Westmeath
| Year |
2016 |
2011 |
2006 |
2002 |
1996 |
1991 |
1986 |
1981 |
1979 |
1971 |
1966 |
1961 |
1956 |
1951 |
1946 |
1936 |
1926 |
1911 |
1901 |
1891 |
1881 |
1871 |
1861 |
1851 |
1841 |
|---|
| Population |
88 |
87 |
79 |
72 |
63 |
62 |
63 |
62 |
60 |
54 |
53 |
53 |
54 |
54 |
55 |
55 |
57 |
60 |
62 |
65 |
72 |
78 |
91 |
111 |
141 |
| Rank |
17 |
17 |
17 |
17 |
17 |
17 |
17 |
17 |
17 |
17 |
19 |
20 |
20 |
21 |
21 |
21 |
21 |
22 |
21 |
22 |
23 |
22 |
19 |
20 |
21 |
| %Change |
1.2 |
8.3 |
9.72 |
14.29 |
1.61 |
−1.59 |
|
|
|
|
|
|
|
|
|
|
|
|
|
|
−7.69 |
−14.29 |
−18.02 |
−21.28 |
|
Laois
| Year |
2016 |
2011 |
2006 |
2002 |
1996 |
1991 |
1986 |
1981 |
1979 |
1971 |
1966 |
1961 |
1956 |
1951 |
1946 |
1936 |
1926 |
1911 |
1901 |
1891 |
1881 |
1871 |
1861 |
1851 |
1841 |
|---|
| Population |
84 |
80 |
67 |
59 |
52 |
52 |
53 |
51 |
49 |
45 |
44 |
45 |
47 |
48 |
49 |
50 |
51 |
54 |
57 |
64 |
73 |
79 |
90 |
111 |
153 |
| Rank |
18 |
18 |
19 |
19 |
21 |
21 |
22 |
22 |
23 |
23 |
23 |
23 |
23 |
23 |
23 |
24 |
24 |
24 |
24 |
23 |
21 |
21 |
21 |
20 |
19 |
| %Change |
5.0 |
20.0 |
13.56 |
13.46 |
0 |
−1.89 |
|
|
|
|
|
|
|
|
|
|
|
|
|
|
−7.59 |
−12.22 |
−18.92 |
−27.45 |
|
Offaly
| Year |
2016 |
2011 |
2006 |
2002 |
1996 |
1991 |
1986 |
1981 |
1979 |
1971 |
1966 |
1961 |
1956 |
1951 |
1946 |
1936 |
1926 |
1911 |
1901 |
1891 |
1881 |
1871 |
1861 |
1851 |
1841 |
|---|
| Population |
78 |
77 |
71 |
64 |
59 |
58 |
60 |
58 |
57 |
52 |
52 |
52 |
52 |
53 |
54 |
51 |
53 |
57 |
60 |
66 |
73 |
76 |
90 |
112 |
147 |
| Rank |
19 |
19 |
18 |
18 |
18 |
18 |
18 |
18 |
18 |
20 |
20 |
21 |
21 |
22 |
22 |
22 |
23 |
23 |
23 |
21 |
21 |
24 |
21 |
18 |
20 |
| %Change |
1.3 |
8.4 |
10.94 |
8.47 |
1.72 |
−3.33 |
|
|
|
|
|
|
|
|
|
|
|
|
|
|
−3.95 |
−15.56 |
−19.64 |
−23.81 |
|
Cavan
| Year |
2016 |
2011 |
2006 |
2002 |
1996 |
1991 |
1986 |
1981 |
1979 |
1971 |
1966 |
1961 |
1956 |
1951 |
1946 |
1936 |
1926 |
1911 |
1901 |
1891 |
1881 |
1871 |
1861 |
1851 |
1841 |
|---|
| Population |
76 |
73 |
64 |
57 |
53 |
53 |
54 |
54 |
54 |
53 |
54 |
57 |
62 |
66 |
70 |
77 |
82 |
91 |
98 |
112 |
129 |
141 |
154 |
174 |
243 |
| Rank |
20 |
20 |
20 |
21 |
20 |
20 |
21 |
21 |
20 |
19 |
18 |
18 |
17 |
14 |
13 |
13 |
12 |
12 |
12 |
11 |
11 |
10 |
11 |
11 |
11 |
| %Change |
4.1 |
13.9 |
12.28 |
7.55 |
0 |
−1.85 |
|
|
|
|
|
|
|
|
|
|
|
|
|
|
−8.51 |
−8.44 |
−11.49 |
−28.4 |
|
Sligo
| Year |
2016 |
2011 |
2006 |
2002 |
1996 |
1991 |
1986 |
1981 |
1979 |
1971 |
1966 |
1961 |
1956 |
1951 |
1946 |
1936 |
1926 |
1911 |
1901 |
1891 |
1881 |
1871 |
1861 |
1851 |
1841 |
|---|
| Population |
65 |
65 |
61 |
58 |
55 |
54 |
56 |
55 |
55 |
50 |
51 |
54 |
57 |
61 |
62 |
67 |
71 |
79 |
84 |
98 |
111 |
115 |
124 |
128 |
180 |
| Rank |
21 |
21 |
21 |
20 |
19 |
19 |
19 |
19 |
19 |
21 |
21 |
19 |
19 |
19 |
18 |
15 |
14 |
14 |
14 |
13 |
14 |
14 |
15 |
17 |
17 |
| %Change |
0.0 |
7.2 |
5.17 |
5.45 |
1.85 |
−3.57 |
|
|
|
|
|
|
|
|
|
|
|
|
|
|
−3.48 |
−7.26 |
−3.13 |
−28.89 |
|
Roscommon
| Year |
2016 |
2011 |
2006 |
2002 |
1996 |
1991 |
1986 |
1981 |
1979 |
1971 |
1966 |
1961 |
1956 |
1951 |
1946 |
1936 |
1926 |
1911 |
1901 |
1891 |
1881 |
1871 |
1861 |
1851 |
1841 |
|---|
| Population |
64 |
64 |
59 |
54 |
52 |
52 |
55 |
55 |
54 |
54 |
56 |
59 |
64 |
68 |
73 |
78 |
84 |
94 |
102 |
114 |
132 |
141 |
157 |
173 |
254 |
| Rank |
22 |
22 |
22 |
22 |
21 |
21 |
20 |
19 |
20 |
17 |
17 |
16 |
15 |
13 |
12 |
11 |
11 |
11 |
11 |
10 |
10 |
10 |
10 |
12 |
10 |
| %Change |
0.0 |
8.7 |
9.26 |
3.85 |
0 |
−5.45 |
|
|
|
|
|
|
|
|
|
|
|
|
|
|
−6.38 |
−10.19 |
−9.25 |
−31.89 |
|
Monaghan
| Year |
2016 |
2011 |
2006 |
2002 |
1996 |
1991 |
1986 |
1981 |
1979 |
1971 |
1966 |
1961 |
1956 |
1951 |
1946 |
1936 |
1926 |
1911 |
1901 |
1891 |
1881 |
1871 |
1861 |
1851 |
1841 |
|---|
| Population |
61 |
60 |
56 |
53 |
51 |
51 |
52 |
51 |
50 |
46 |
46 |
47 |
52 |
55 |
57 |
61 |
65 |
71 |
75 |
86 |
103 |
115 |
126 |
142 |
200 |
| Rank |
23 |
23 |
23 |
23 |
23 |
23 |
23 |
22 |
22 |
22 |
22 |
22 |
21 |
20 |
20 |
17 |
16 |
16 |
16 |
16 |
15 |
14 |
14 |
15 |
14 |
| %Change |
1.7 |
8.0 |
5.66 |
3.92 |
0 |
−1.92 |
|
|
|
|
|
|
|
|
|
|
|
|
|
|
−10.43 |
−8.73 |
−11.27 |
−29 |
|
Carlow
| Year |
2016 |
2011 |
2006 |
2002 |
1996 |
1991 |
1986 |
1981 |
1979 |
1971 |
1966 |
1961 |
1956 |
1951 |
1946 |
1936 |
1926 |
1911 |
1901 |
1891 |
1881 |
1871 |
1861 |
1851 |
1841 |
|---|
| Population |
56 |
54 |
50 |
46 |
42 |
41 |
41 |
40 |
39 |
34 |
34 |
33 |
34 |
34 |
34 |
34 |
34 |
36 |
38 |
41 |
47 |
52 |
57 |
68 |
86 |
| Rank |
24 |
24 |
24 |
24 |
24 |
24 |
24 |
24 |
24 |
24 |
24 |
24 |
25 |
26 |
26 |
26 |
26 |
26 |
26 |
26 |
26 |
26 |
26 |
26 |
26 |
| %Change |
3.7 |
8.3 |
8.7 |
9.52 |
2.44 |
0 |
|
|
|
|
|
|
|
|
|
|
|
|
|
|
−9.62 |
−8.77 |
−16.18 |
−20.93 |
|
Longford
| Year |
2016 |
2011 |
2006 |
2002 |
1996 |
1991 |
1986 |
1981 |
1979 |
1971 |
1966 |
1961 |
1956 |
1951 |
1946 |
1936 |
1926 |
1911 |
1901 |
1891 |
1881 |
1871 |
1861 |
1851 |
1841 |
|---|
| Population |
40 |
39 |
34 |
31 |
30 |
30 |
31 |
31 |
31 |
28 |
29 |
31 |
33 |
35 |
36 |
38 |
40 |
44 |
47 |
53 |
61 |
65 |
72 |
82 |
115 |
| Rank |
25 |
25 |
25 |
25 |
25 |
25 |
25 |
25 |
25 |
25 |
26 |
26 |
26 |
25 |
25 |
25 |
25 |
25 |
25 |
25 |
25 |
25 |
25 |
25 |
24 |
| %Change |
2.6 |
13.3 |
9.68 |
3.33 |
0 |
−3.23 |
|
|
|
|
|
|
|
|
|
|
|
|
|
|
−6.15 |
−9.72 |
−12.2 |
−28.7 |
|
Leitrim
| Year |
2016 |
2011 |
2006 |
2002 |
1996 |
1991 |
1986 |
1981 |
1979 |
1971 |
1966 |
1961 |
1956 |
1951 |
1946 |
1936 |
1926 |
1911 |
1901 |
1891 |
1881 |
1871 |
1861 |
1851 |
1841 |
|---|
| Population |
32 |
32 |
29 |
26 |
25 |
25 |
27 |
28 |
28 |
28 |
31 |
33 |
37 |
41 |
45 |
51 |
56 |
64 |
69 |
79 |
90 |
96 |
105 |
112 |
155 |
| Rank |
26 |
26 |
26 |
26 |
26 |
26 |
26 |
26 |
26 |
25 |
25 |
24 |
24 |
24 |
24 |
22 |
22 |
19 |
17 |
17 |
17 |
17 |
18 |
18 |
18 |
| %Change |
0.0 |
9.8 |
11.54 |
4 |
0 |
−7.41 |
|
|
|
|
|
|
|
|
|
|
|
|
|
|
−6.25 |
−8.57 |
−6.25 |
−27.74 |
|
See also
References
External links