Inverclyde (UK Parliament constituency)
| Inverclyde | |
|---|---|
|
County constituency for the House of Commons | |
|
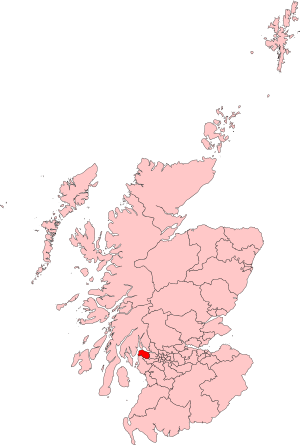
Boundary of Inverclyde in Scotland. | |
| Subdivisions of Scotland | Inverclyde |
| Current constituency | |
| Created | 2005 |
| Member of parliament | Ronnie Cowan (SNP) |
| Number of members | One |
| Created from | Greenock and Inverclyde and Renfrewshire West |
| Overlaps | |
| European Parliament constituency | Scotland |
Inverclyde is a parliamentary constituency of the House of Commons of the Parliament of the United Kingdom. It replaced Greenock and Inverclyde and the Port Glasgow and Kilmacolm areas from West Renfrewshire for the 2005 general election.
The previous MP, Labour's Iain McKenzie won the ensuing Inverclyde by-election following the death of David Cairns also of the Labour Party. In the 2015 General Election, the constituency was taken by SNP's Ronnie Cowan. The constituency could become the new 'Inverclyde and Largs' constituency if the proposed boundary changes are confirmed in 2018.
Boundaries
The constituency covers the Inverclyde council area. This includes the towns of Gourock, Greenock, Inverkip, Kilmacolm, Port Glasgow and Wemyss Bay.
Members of Parliament
| Election | Member[1] | Party | |
|---|---|---|---|
| 2005 | David Cairns | Labour | |
| 2011 by-election | Iain McKenzie | Labour | |
| 2015 | Ronnie Cowan | Scottish National Party | |
Election results
| Party | Candidate | Votes | % | ± | |
|---|---|---|---|---|---|
| SNP | Ronnie Cowan | 24,585 | 55.1 | +37.6 | |
| Labour | Iain McKenzie | 13,522 | 30.3 | -25.7 | |
| Conservative | George Jabbour | 4,446 | 10.0 | -2.0 | |
| Liberal Democrat | John Watson | 1,106 | 2.5 | -10.8 | |
| UKIP | Michael Burrows | 715 | 1.6 | +0.4 | |
| CISTA | Craig Hamilton | 233 | 0.5 | n/a | |
| Majority | 11,063 | 24.8 | n/a1 | ||
| Turnout | 44,607 | 75.2 | +11.8 | ||
| SNP gain from Labour | Swing | 31.7 | |||
1 Change to majority not useful when seat changes hands.
| Party | Candidate | Votes | % | ± | |
|---|---|---|---|---|---|
| Labour | Iain McKenzie[3] | 15,118 | 53.8 | –2.2 | |
| SNP | Anne McLaughlin[3][4] | 9,280 | 33.0 | +15.5 | |
| Conservative | David Wilson[5] | 2,784 | 9.9 | –2.1 | |
| Liberal Democrats | Sophie Bridger | 627 | 2.2 | –11.1 | |
| UKIP | Mitch Sorbie[6] | 288 | 1.0 | –0.2 | |
| Majority | 5,838 | 20.8 | -17.6 | ||
| Turnout | 28,097 | 45.4 | –18.0 | ||
| Labour hold | Swing | 15.5 | |||
| Party | Candidate | Votes | % | ± | |
|---|---|---|---|---|---|
| Labour | David Cairns | 20,933 | 56.0 | +5.2 | |
| SNP | Innes Nelson | 6,577 | 17.5 | -2.0 | |
| Liberal Democrat | Simon Hutton | 5,007 | 13.3 | -3.6 | |
| Conservative | David Wilson | 4,502 | 12.0 | +1.8 | |
| UKIP | Peter Campbell | 433 | 1.2 | n/a | |
| Majority | 14,416 | 38.4 | +7.2 | ||
| Turnout | 37,512 | 63.4 | +2.5 | ||
| Labour hold | Swing | ||||
| Party | Candidate | Votes | % | ± | |
|---|---|---|---|---|---|
| Labour | David Cairns | 18,318 | 50.7 | n/a | |
| SNP | Stuart McMillan | 7,059 | 19.6 | n/a | |
| Liberal Democrats | Douglas Herbison | 6,123 | 17.0 | n/a | |
| Conservative | Gordon Fraser | 3,692 | 10.2 | n/a | |
| Scottish Socialist | Davy Landels | 906 | 2.5 | n/a | |
| Majority | 11,259 | 31.2% | n/a | ||
| Turnout | 36,098 | 60.9% | n/a | ||
| Labour win (new seat) | |||||
References
- ↑ Leigh Rayment's Historical List of MPs – Constituencies beginning with "I"
- ↑ "Election Data 2015". Electoral Calculus. Archived from the original on 17 October 2015. Retrieved 17 October 2015.
- 1 2 "Labour chooses candidate for Inverclyde by-election". BBC News. 4 June 2011. Retrieved 4 June 2011.
- ↑ "SNP selects by-election candidate". The Independent. London. 3 June 2011.
- ↑ "Inverclyde Westminster by-election date set", BBC News, 8 June 2011
- ↑ "Inverclyde can make political history". UKIP. 5 June 2011.
- ↑ "Election Data 2010". Electoral Calculus. Archived from the original on 17 October 2015. Retrieved 17 October 2015.
- ↑ "Election Data 2005". Electoral Calculus. Archived from the original on 15 October 2011. Retrieved 18 October 2015.
Coordinates: 55°54′08″N 4°45′10″W / 55.90222°N 4.75278°W