Immigration to Spain
As of 2015, there were over 6.1 million foreign-born people in Spain, over 13% of the total population.[1] Out of these around 4.5 million had not yet acquired citizenship corresponding to 10% of the total population. Of these, 4.1 million (8.9% of the total population) were citizens of a country outside the European Union and 2.3 million (5.1%) were citizens of another EU Member State.[2]
Because of its location in the Iberian Peninsula, the Canary islands and two exclaves in Northern Africa, the territory comprising modern Spain has always been at the crossroads of human migration, having harboured many waves of historical immigration. The Spanish Empire, one of the first global empires and one of the largest in the world, spanned all inhabited continents and throughout the years people from these lands emigrated to Spain in varying numbers.
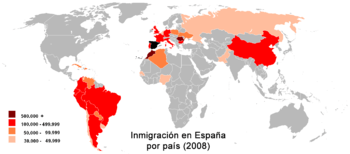
In migration terms and after centuries of net emigration, Spain has recently experienced large-scale immigration for the first time in modern history. According to the Spanish government, there were 5,598,691 foreign residents in January 2010.[3] Of these, well over one million and a half were from Latin America (especially from Ecuador, Colombia, Bolivia, Argentina and Brazil), three quarters of a million were Moroccan, while immigrants and expatriates from the European Union member states amounted more than two million (especially from Romania, United Kingdom, Germany, Italy and Bulgaria). Chinese are estimated to number 145,425, while South East Asian groups such as Filipinos—whose country was a former Spanish possession—created a small community in Spain. Immigrants from several sub-Saharan African countries have also settled in Spain as contract workers, although they represent only 4.08% of all the foreign residents in the country.
The population of Spain doubled during the 20th century due to the spectacular demographic boom in the 1960s and early 1970s. The birth rate then plunged by the 1980s, and Spain's population became stagnant, its demographics showing one of the lowest sub-replacement fertility rate in the world..
During the early 21st century, the average year-on-year demographic growth set a new record with its 2003 peak variation of 2.1%, doubling the previous record reached back in the 1960s when a mean year on year growth of 1% was experienced.[4] This trend is far from being reversed at the present moment and, in 2005 alone, the immigrant population of Spain increased by 700,000 people.[5]
Currently
| Foreign population in Spain[6][7] | |||||||||||||||||||
|---|---|---|---|---|---|---|---|---|---|---|---|---|---|---|---|---|---|---|---|
| Year | Population | % total | |||||||||||||||||
| 1981 | 198,042 | 0.52% | |||||||||||||||||
| 1986 | 241,971 | 0.63% | |||||||||||||||||
| 1991 | 360,655 | 0.91% | |||||||||||||||||
| 1996 | 542,314 | 1.37% | |||||||||||||||||
| 1998 | 637,085 | 1.60% | |||||||||||||||||
| 2000 | 923,879 | 2.28% | |||||||||||||||||
| 2001 | 1,370,657 | 3.33% | |||||||||||||||||
| 2002 | 1,977,946 | 4.73% | |||||||||||||||||
| 2003 | 2,664,168 | 6.24% | |||||||||||||||||
| 2004 | 3,034,326 | 7.02% | |||||||||||||||||
| 2005 | 3,730,610 | 8.46% | |||||||||||||||||
| 2006 | 4,144,166 | 9.27% | |||||||||||||||||
| 2007 | 4,519,554 | 10.0% | |||||||||||||||||
| 2008 | 5,220,600 | 11.3% | |||||||||||||||||
| 2009 | 5,598,691 | 12.0% | |||||||||||||||||
| 2010 | 5,747,734 | 12.2% | |||||||||||||||||
| 2011 | 5,730,667 | 12.2% | |||||||||||||||||
| 2012 | 5,520,133 | 12.1% | |||||||||||||||||
| 2013 | 5,546,238 | 11.7% | |||||||||||||||||
| 2014 | 5,023,487 | 10.7% | |||||||||||||||||
According to the Spanish government, there were 5.6 million foreign residents in Spain in 2010; independent estimates put the figure 14% of total population (Red Cross, World Disasters Report 2006). According to the official 2011 census data, almost 800,000 were Romanian, 774,000 were Moroccan, 317,000 were Ecuadorian, 312,000 were British and 250,000 were Colombian . Other important foreign communities are Bolivian (4.1%), German (3.4%), Italian (3.1%), Bulgarian (2.9%), Chinese (2.6%) and Argentine (2.5%). In 2005, a regularization programme increased the legal immigrant population by 700,000 people. Since 2000, Spain has experienced high population growth as a result of immigration flows, despite a birth rate that is only half of the replacement level. This sudden and ongoing inflow of immigrants, particularly those arriving clandestinely by sea, has caused noticeable social tensions.
According to Eurostat, in 2010, there were 6.4 million foreign-born residents in Spain, corresponding to 14.0% of the total population. Of these, 4.1 million (8.9%) were born outside the EU and 2.3 million (5.1%) were born in another EU Member State.[8]
As of 2005 Spain had the second highest immigration rates within the EU, just after Cyprus, and the second highest absolute net migration in the World (after the USA).[9] This can be explained by a number of reasons including its geographical position, the porosity of its borders, the large size of its underground economy and the strength of the agricultural and construction sectors which demand more low cost labour than can be offered by the national workforce. In fact, booming Spain was Europe's largest absorber of migrants from 2002 to 2007, with its immigrant population more than doubling as 2.5 million people arrived.
Over 920,000 immigrants arrived in Spain during 2007, on top of the 802,971 new arrivals in 2006, 682,711 new arrivals in 2005, and 645,844 new arrivals in 2004.[10]
Although the number of immigrants in Spain, officially, is smaller than that of other countries in the EU, the following data should be taken into consideration:
- Immigrants from countries belonging to the former Spanish Empire (mainly in Central and South America–Latin America–, Asia–the Philippines– and Africa–Equatorial Guinea and Western Sahara–) can obtain Spanish nationality after legal and continuous residence of 2 years in Spain, after which naturalized citizens are no longer counted as immigrants.
- In order to avoid statelessness, Spain automatically grants Spanish nationality to the children of immigrants born in Spain whose parents' nationality of origin is not transferred jus sanguinis upon their child's birth abroad. Unlike other countries of the EU that do not do it. It is for this reason that although the Latin American immigrants of origin are most numerous, the Romanians or the Moroccans surpassed them in the official statistics.
In the same way the majority of children born in Spain between 2000 and 2010 are children of immigrants despite not counting as such. Considering these data, there are sectors of Spanish society who oppose immigration that affirm the real number of immigrants in Spain is 10–11 million, or about 25% of the total population.
As for nationalities outside of this category, in order to stay in Spain for more than 3 months, a residence card, residence visa or work permit is required.[11]
Immigrants from the European Union
Immigrants from the European Union make up a growing proportion of immigrants in Spain. The main countries of origin are Romania, the United Kingdom, Germany, Italy, and Bulgaria.
The British authorities estimate that the real population of UK citizens living in Spain is much bigger than Spanish official figures suggest, establishing them at about 1,000,000, about 800,000 being permanent residents.[12] Of these, according to the BBC and contrary to popular belief, only about 21.5% are over the age of 65.[13]
In fact, according to the Financial Times, Spain is the most favoured destination for West Europeans considering to move from their own country and seek jobs elsewhere in the EU.[14]
Major immigration
European Union member states are indicated with the EU flag in regional European sub-divisions.
| Origin | 2014 | 2011 | 2007 | 2006 | 2001 | Growth 2001–2011 |
% Change | Article |
|---|---|---|---|---|---|---|---|---|
| 730,340 | 798,104 | 527,019 | 407,159 | 31,641 | 766,463 | +2,522% | Romanians in Spain | |
| 714,221 | 769,920 | 582,923 | 563,012 | 233,415 | 536,505 | +230% | Moroccans in Spain | |
| 311,774 | 390,880 | 314,951 | 274,722 | 107,326 | 283,554 | +264% | British migration to Spain | |
| 212,970 | 359,076 | 427,099 | 461,310 | 139,022 | 220,054 | +158% | Ecuadorians in Spain | |
| 182,249 | 187,847 | 135,108 | 115,791 | 34,689 | 153,158 | +441% | - | |
| 172,368 | 271,773 | 261,542 | 265,141 | 87,209 | 184,564 | +212% | Colombians in Spain | |
| 164,555 | 166,223 | 106,652 | 104,681 | 27,574 | 138,649 | +503% | Chinese people in Spain | |
| 149,522 | 195,842 | 164,405 | 150,490 | 99,217 | 96,625 | +97% | - | |
| 140,206 | 172,634 | 122,057 | 101,617 | 12,035 | 160,599 | +1,334% | Bulgarians in Spain | |
| 126,421 | 197,895 | 200,496 | 139,802 | 6,619 | 191,276 | +2,890% | - | |
| 109,568 | 140,706 | 100,616 | 80,635 | 47,064 | 93,642 | +199% | - | |
| 100,448 | 122,385 | 100,408 | 90,021 | 51,582 | 70,803 | +137% | - | |
| 83,583 | 131,886 | 103,650 | 95,903 | 34,975 | 96,911 | +277% | Peruvians in Spain | |
| 81,625 | 85,913 | 69,983 | 69,893 | 10,318 | 75,595 | +733% | - | |
| 80,910 | 120,012 | 141,159 | 150,252 | 32,429 | 87,583 | +270% | Argentines in Spain | |
| 77,280 | 90,612 | 65,119 | 61,071 | 31,153 | 59,459 | +191% | - | |
| 70,606 | 85,862 | 61,464 | 45,797 | 13,469 | 72,393 | +537% | Poles in Spain | |
| 63,365 | 106,908 | 90,161 | 72,441 | 17,078 | 89,830 | +526% | - | |
| 62,452 | 52,832 | 39,798 | 39,904 | 10,047 | 42,785 | +426% | Russians in Spain | |
| 56,282 | 60,538 | 45,813 | 47,079 | 18,265 | 42,273 | +231% | - | |
| 55,524 | 87,406 | 46,238 | 28,587 | 928 | 86,478 | +9,319% | Paraguayans in Spain | |
| 55,452 | 69,841 | 42,105 | 42,138 | 8,274 | 61,567 | +744% | Pakistanis in Spain | |
| 51,046 | 63,248 | 36,955 | 35,079 | 10,627 | 52,621 | +495% | - | |
| 49,992 | 54,406 | 45,698 | 44,739 | 24,534 | 29,872 | +122% | - | |
| 46,914 | 54,424 | 44,398 | 39,484 | 23,146 | 31,278 | +135% | - | |
| 44,290 | 59,453 | 51,481 | 51,261 | 16,549 | 42,904 | +259% | Venezuelans in Spain | |
| 38,546 | 44,870 | 32,119 | 31,588 | 7,598 | 37,272 | +490% | - | |
| 31,128 | 35,876 | 31,412 | 29,526 | 19,869 | 16,007 | +80% | - | |
| 30,079 | - | 54,385 | 51,368 | - | 3,017 | - | Filipinos in Spain | |
| 28,437 | 42,581 | 46,069 | 45,508 | 6,828 | 35,753 | +524% | Uruguayans in Spain | |
| 27,064 | 41,712 | 40,844 | 39,704 | 11,674 | 30,038 | +257% | - | |
| 22,486 | Mexicans in Spain | |||||||
| TOTAL | 4,676,022 | 5,730,667 | 4,519,554 | 4,144,166 | 1,370,657 | 4,360,010 | +318% |
- (2007dates)
- 2011: INE
- (2013dates)
From other countries – Europe
European Union member states are indicated with the EU flag in regional European sub-divisions.
| Origin | 2007 | 2006 |
|---|---|---|
| 1,353 | 1,316 | |
| 1,022 | 1,075 | |
| 8,651 | 7,776 | |
| 3,135 | 3,262 | |
| 1,659 | 1,827 | |
| 1,649 | 1,788 | |
| 146 | 130 | |
| 6,423 | 5,160 | |
| 10,906 | 9,977 | |
| 984 | 784 | |
| 9,990 | 9,313 | |
| 3,567 | 3,027 | |
| 4,597 | 3,344 | |
| 1,083 | 920 | |
| 13,279 | 11,495 | |
| 2,128 | 1,741 | |
| 48 | 117 | |
| 18,528 | 15,200 | |
| 562 | 1,336 | |
| 407 | 440 | |
| 152 | 129 | |
| 12,801 | 11,330 | |
| 15,630 | 14,154 | |
| 3,133 | 3,474 | |
| 5,999 | 4,515 | |
| 799 | 619 | |
| 20,058 | 18,096 | |
| 16,361 | 15,385 | |
| Rest of European countries | 66 | 83 |
| TOTAL EUROPE | 1,895,727 | 1,609,856 |
From other countries – Africa
| Origin | 2007 | 2006 | Article |
|---|---|---|---|
| 2,114 | 3,698 | ||
| 2,998 | 3,611 | ||
| 4,029 | 3,955 | ||
| 1,801 | 1,888 | ||
| 1,636 | 1,759 | ||
| 2,566 | 3,634 | Egyptians in Spain | |
| 17,393 | 13,627 | ||
| 12,699 | 13,133 | ||
| 9,159 | 9,901 | ||
| 13,129 | 19,456 | Spanish Equatoguineans | |
| 5,229 | 5,274 | ||
| 581 | 1,167 | ||
| 17,094 | 14,497 | ||
| 9,271 | 9,308 | ||
| 1,008 | 1,548 | ||
| 989 | 1,487 | ||
| 704 | 2,086 | ||
| 1,544 | 2,194 | Tunisians in Spain | |
| Rest of African countries | 5,041 | 8,679 | |
| TOTAL | 806.795 |
From other countries – Central America
| Origin | 2007 | 2006 |
|---|---|---|
| 1,320 | 2,373 | |
| 3,795 | 5,102 | |
| 2,417 | 4,321 | |
| 14,253 | 10,652 | |
| 4,547 | 4,204 | |
| 1,794 | 3,520 | |
| Rest of Central America countries | 1,002 | 2,517 |
| TOTAL | 139.945 |
From other countries – North America
| Origin | 2007 | 2006 |
|---|---|---|
| 2,419 | 5,420 | |
| 22,082 | 32,626 | |
| 21,107 | 40,574 | |
| TOTAL | 45.608 |
From other countries – Asia
| Origin | 2007 | 2006 | Article |
|---|---|---|---|
| 9,582 | 9,365 | Armenians in Spain | |
| 7,355 | 6,284 | ||
| 54,385 | 51,368 | Filipinos in Spain | |
| 22,465 | 13,144 | Koreans in Spain | |
| 21,296 | 23,296 | ||
| 6,480 | 6,130 | ||
| 12,334 | 4,568 | Iranians in Spain | |
| 880 | 1,706 | Iraqi people in Spain | |
| 1,713 | 2,427 | ||
| 11,636 | 7,684 | Japanese Spaniards | |
| 1,088 | 2,082 | Jordanian people in Spain | |
| 6,250 | 2,750 | Lebanese people in Spain | |
| 6,129 | 4,575 | Syrian people in Spain | |
| 1,758 | 1,656 | Turks in Spain | |
| Rest of Asian countries | 6,430 | 2,517 | |
| TOTAL | 219.843 |
From other countries – Oceania
| Origin | 2007 | 2006 |
|---|---|---|
| 1,455 | 5,131 | |
| 301 | 298 | |
| Rest of Oceanian countries | 494 | 1,099 |
| TOTAL | 2.271 |
Comparison with other countries from European Union
According to Eurostat 47.3 million people lived in the European Union in 2010 who were born outside their resident country. This corresponds to 9.4% of the total EU population. Of these, 31.4 million (6.3%) were born outside the EU and 16.0 million (3.2%) were born in another EU member state. The largest absolute numbers of people born outside the EU were in Germany (6.4 million), France (5.1 million), the United Kingdom (4.7 million), Spain (4.1 million), Italy (3.2 million), and the Netherlands (1.4 million).[15]
| Country | Total population (millions) | Total Foreign-born (millions) | % | Born in other EU state (millions) | % | Born in a non EU state (millions) | % |
|---|---|---|---|---|---|---|---|
| Germany | 81.802 | 9.812 | 12.0 | 3.396 | 4.2 | 6.415 | 7.8 |
| France | 64.716 | 7.196 | 11.1 | 2.118 | 3.3 | 5.078 | 7.8 |
| United Kingdom | 62.008 | 7.012 | 11.3 | 2.245 | 3.6 | 4.767 | 7.7 |
| Spain | 46.000 | 6.422 | 12.0 | 2.328 | 5.1 | 4.094 | 8.9 |
| Italy | 61.000 | 4.798 | 8.5 | 1.592 | 2.6 | 3.205 | 5.3 |
| Netherlands | 16.575 | 1.832 | 11.1 | 0.428 | 2.6 | 1.404 | 8.5 |
| Greece | 11.305 | 1.256 | 11.1 | 0.315 | 2.8 | 0.940 | 8.3 |
| Sweden | 9.340 | 1.337 | 14.3 | 0.477 | 5.1 | 0.859 | 9.2 |
| Austria | 8.367 | 1.276 | 15.2 | 0.512 | 6.1 | 0.764 | 9.1 |
| Belgium | 10.666 | 1.380 | 12.9 | 0.695 | 6.5 | 0.685 | 6.4 |
| Portugal | 10.637 | 0.793 | 7.5 | 0.191 | 1.8 | 0.602 | 5.7 |
| Denmark | 5.534 | 0.500 | 9.0 | 0.152 | 2.8 | 0.348 | 6.3 |
| EU 27 | 501.098 | 47.348 | 9.4 | 15.980 | 3.2 | 31.368 | 6.3 |
Irregular migration
Irregular migration to Spain is the act of foreign nationals entering Spain, without government permission and in violation of the given nationality law, or staying beyond the termination date of a visa, also in violation of the law.
In order to deal with the overwhelming numbers of illegal immigrants the government has initiated an amnesty in 2005 to reduce the problem. Some critics believe this will only encourage Chain migration.[16][17][18][19]
See also
- Immigration to Europe
- List of countries by immigrant population
- List of sovereign states and dependent territories by fertility rate
References
- ↑ http://www.ine.es/jaxi/Datos.htm?path=/t20/e245/p08/l0/&file=01006.px
- ↑ 6.5% of the EU population are foreigners and 9.4% are Archived August 12, 2011, at the Wayback Machine., Eurostat, Katya VASILEVA, 34/2011.
- ↑ 5,598,691 foreign population in Spain (2009), Spanish National Statistic Institute press report, INE (Spain). June 3, 2009. (Spanish)
- ↑ Official report on Spanish recent Macroeconomics, including data and comments on immigration. (PDF) . Retrieved on 2011-11-14.
- ↑ Instituto Nacional de Estadística. Evolution of the foreign population in Spain since 1998
- ↑ Fuente: para los años 1981, 1986 y 1991, los datos se refieren tan sólo a extranjeros con permiso de residencia a 31 de diciembre y proceden del Ministerio de Trabajo y Asuntos Sociales, citado en (tomando, para el porcentaje de 1986, la población española de hecho según la estimación intercensal del INE para el 1 de julio ). Para los datos de 1996 y posteriores, todos los datos proceden del INE
- ↑ For 2013 and 2014
- ↑ 6.5% of the EU population are foreigners and 9.4% are born abroad Archived August 12, 2011, at the Wayback Machine., Eurostat, Katya VASILEVA, 34/2011.
- ↑ Eurostat – Population in Europe in 2005 Archived August 19, 2008, at the Wayback Machine.. (PDF) . Retrieved on 2011-11-14.
- ↑ Kern, Soeren (2009-05-13), "Immigration Policy a Casualty of Unemployment in Spain", World Politics Review, retrieved 2009-06-29
- ↑ Zelmenis, Artis (2013-09-11), "Spanish Immigration Policy", Baltic Legal
- ↑ "Archived copy". Archived from the original on December 23, 2010. Retrieved January 25, 2011.
- ↑ Special Reports | Brits Abroad. BBC News. Retrieved on 2011-11-14.
- ↑ News.bg – Europeans Favour Spain for Expat Jobs. International.ibox.bg. Retrieved on 2011-11-14.
- ↑ 6.5% of the EU population are foreigners and 9.4% are born abroad Archived August 12, 2011, at the Wayback Machine., Eurostat, Katya VASILEVA, 34/2011.
- ↑ "Spain Helping Mauritania Slow Illegal Immigration". Voice of America. Retrieved 2012-04-01.
- ↑ "Spain, Like U.S., Grapples With Immigration". The New York Times. Retrieved 2012-04-01.
- ↑ "Spain sees significant drop in illegal immigrants in 2009". Xinhuanet. Retrieved 2012-04-01.
- ↑ Katya Adler, "Spain stands by immigrant amnesty," BBC (25 May 2005). Retrieved 29-10-2013.
External links
| Wikimedia Commons has media related to Immigration to Spain. |