Immigration to Canada

Immigration to Canada is the process by which people migrate to Canada to reside in that country. The majority of these individuals become Canadian citizens. After 1947, domestic immigration law and policy went through major changes, most notably with the Immigration Act, 1976, and the current Immigration and Refugee Protection Act from 2002. Canadian immigration policies are still evolving. As recently as 2008, Citizenship and Immigration Canada has made significant changes to streamline the steady flow of immigrants. Those changes included reduced professional categories for skilled immigration as well as caps for immigrants in various categories. In the year from July 2015 to June 2016, there were 320,932 immigrants to Canada.[1]
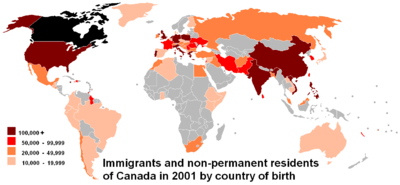
In Canada there are four categories of immigrants: family class (closely related persons of Canadian residents living in Canada), economic immigrants (skilled workers and business people), other (people accepted as immigrants for humanitarian or compassionate reasons) and refugees (people who are escaping persecution, torture or cruel and unusual punishment). According to the 2001 census by Statistics Canada, Canada has 33 ethnic groups with at least one hundred thousand members each, of which 10 have over 1,000,000 people and numerous others represented in smaller amounts. 16.2% of the population belonged to visible minorities.
The Canadian public, as well as the major political parties, support either sustaining or increasing the current level of immigration.[2][3][4] A 2014 sociological study concluded that "Australia and Canada are the most receptive to immigration among western nations".[5]
History


After the initial period of British and French colonization, four major waves (or peaks) of immigration and settlement of non-aboriginal peoples took place over a period of almost two centuries. The fifth wave is currently occurring.
First wave
The first wave of significant, non-aboriginal immigration to Canada occurred over almost two centuries with slow but progressive French settlement of Quebec and Acadia with smaller numbers of American and European entrepreneurs in addition to British military personnel. This wave culminated with the influx of 46–50,000 British Loyalists fleeing the American Revolution, chiefly from the Mid-Atlantic States mostly into what is today Southern Ontario, the Eastern Townships of Quebec, New Brunswick and Nova Scotia. A second wave of 30,000 Americans settled in Ontario and the Eastern Townships between the late 1780s and 1812 with promises of land. Scottish Highlanders from land clearances also became landers in Canada during this period. It marked a new age for Canada and its people.
Second wave
The second wave from Britain and Ireland was encouraged to settle in Canada after the War of 1812, and included British army regulars who had served in the war. The colonial governors of Canada, who were worried about another American invasion attempt and to counter the French-speaking influence of Quebec, rushed to promote settlement in back country areas along newly constructed plank roads within organized land tracts, mostly in Upper Canada (present-day Ontario). With the second wave Irish immigration to Canada had been increasing and peaked when the Irish Potato Famine occurred from 1846 to 1849 resulting in hundreds of thousands more Irish arriving on Canada's shores, although a significant portion migrated to the United States either in the short-term or over the subsequent decades.
The Dominion Lands Act of 1872 copied the American system by offering ownership of 160 acres of land free (except for a small registration fee) to any man over 18 or any woman heading a household. They did not need to be citizens, but had to live on the plot and improve it.
Also during this period, Canada became a port of entry for many Europeans seeking to gain entry into the U.S. Canadian transportation companies advertised Canadian ports as a hassle-free way to enter the U.S. especially as the U.S. began barring entry to certain ethnicities. The U.S. and Canada mitigated this situation in 1894 with the Canadian Agreement which allowed for U.S. immigration officials to inspect ships landing at Canadian ports for immigrants excluded from the U.S. If found, the transporting companies were responsible for shipping the persons back.[6]
Clifford Sifton, minister of the Interior in Ottawa, 1896–1905, argued that the free western lands were ideal for growing wheat and would attract large numbers of hard-working farmers. He removed obstacles that included control of the lands by companies or organizations that did little to encourage settlement. Land companies, the Hudson's Bay Company, and school lands all accounted for large tracts of excellent land. The railways kept closed even larger tracts because they were reluctant to take legal title to the even-numbered lands they were due, thus blocking sale of odd-numbered tracts. Sifton broke the legal log jam, and set up aggressive advertising campaigns in the U.S. and Europe, with a host of agents promoting the Canadian west. He also brokered deals with ethnic groups that wanted large tracts for homogeneous settlement. His goal was to maximize immigration from Britain, eastern Canada and the U.S.[7]
Third wave (1900-1914) and fourth wave (1940s-1960s)

The third wave of immigration coming mostly from continental Europe peaked prior to World War I, between 1911–1913 (over 400,000 in 1912). The fourth wave came from Europe after the Second World War, peaking at 282,000 in in 1957. Together, they made Canada a more multiethnic country with substantial non-British or non-French European elements. For example, Ukrainian Canadians accounted for the largest Ukrainian population outside Ukraine and Russia. The Church of England took up the role of introducing British values to farmers newly arrived on the prairies. In practice, they clung to their traditional religious affiliations.[8]
Periods of low immigration have also occurred: international movement was very difficult during the world wars, and there was a lack of jobs "pulling" workers to Canada during the Great Depression in Canada.
Canadianization was a high priority for new arrivals lacking a British cultural background.[9] Immigrants from Britain were given highest priority.[10] There was no special effort to attract Francophone immigrants. In terms of economic opportunity, Canada was most attractive to farmers headed to the Prairies, who typically came from eastern and central Europe. Immigrants from Britain preferred urban life.[11]
Fifth wave (1970s-present)
Immigration since the 1970s has overwhelmingly been of visible minorities from the developing world. This was largely influenced in 1976 when the Immigration Act was revised and this continued to be official government policy. During the Mulroney government, immigration levels were increased. By the late 1980s, the fifth wave of immigration has maintained with slight fluctuations since (225,000–275,000 annually). Currently, most immigrants come from South Asia, China and Caribbean and this trend is expected to continue.
Chinese

Prior to 1885, restrictions on immigration were imposed mostly in response to large waves of immigration rather than planned policy decisions, but not specifically targeted at one group or ethnicity, at least as official policy. Then came the introduction of the first Chinese Head Tax legislation passed in 1885, which was in response to a growing number of Chinese working on the Canadian Pacific Railway. Subsequent increases in the head tax in 1900 and 1903 limited Chinese entrants to Canada. In 1907 a major riot against Asians took place in Vancouver, BC. In 1923 the government passed the Chinese Immigration Act which excluded Chinese from entering Canada altogether between 1923 and 1947. For discriminating against Chinese immigrants in past periods, an official government apology and compensations were announced on 22 June 2006.
Citizenship
The term Canadian as a term of nationalism or citizenship was first used under the Immigration Act, 1910, to designate those British subjects who were domiciled in Canada. All other British subjects required permission to land. A separate status of "Canadian national" was created under the Canadian Nationals Act, 1921, which was defined as being a Canadian as defined above, their wives, and any children (fathered by such citizens) that had not yet landed in Canada. After the passage of the Statute of Westminster in 1931, the monarchy ceased to be an exclusively British institution. Because of this Canadians, and others living in countries that became known as Commonwealth realms, were known as subjects of the Crown. However, in legal documents the term "British subject" continued to be used and "Canadians" were officially British Subjects born or regularly domiciled in Canada.
Canada was the first nation in the then British Commonwealth to establish its own nationality law in 1946, with the enactment of the Canadian Citizenship Act 1946. This took effect on January 1, 1947. In order to be deemed a Canadian citizen on January 1, 1947, one generally had to be a British subject on that date, or had been admitted to Canada as landed immigrants before that date. First nations people were later included by amendment in 1956. The phrase British subject refers in general to anyone from the United Kingdom, its colonies at the time, or a Commonwealth country. Acquisition and loss of British subject status before 1947 was determined by United Kingdom law (see History of British nationality law).
Canada offers Canadian citizenship through naturalization. In June 2015 the implementation of the latest reforms to the Citizenship Act took effect and revised access to Canadian citizenship. The new reforms raises the residency requirements to 4 years out of 6 years during the period immediately prior to filing the application thereby reducing the length of time to 66% from 75% of the relevant residency period. However, it also requires physical residence for 183 days in each of four the qualifying calendar years prior to submission and a requirement to file income tax. Persons aged 14 to 64 years of age must demonstrate a knowledge of Canada and a basic ability in either official language. There is a provision of an intention to reside on the part of an applicant that applies only during the application process and is irrelevant once a person is a citizen.[12] On 15 February 1977, Canada removed restrictions on dual citizenship. Many of the provisions to acquire or lose Canadian citizenship that existed under the 1946 legislation were repealed. Canadian citizens are in general no longer subject to involuntary loss of citizenship, barring revocation on the grounds of immigration fraud.
Statistics Canada has tabulated the effect of immigration on population growth in Canada from 1851 to 2001.[13]
Emigration
Emigration from Canada to the United States has historically exceeded immigration, but there were short periods where the reverse was true; for example, the Loyalist refugees; during the various British Columbia gold rushes and later the Klondike Gold Rush which saw many American prospectors inhabiting British Columbia and the Yukon; land settlers moving from the Northern Plains to the Prairies in the early 20th century and also during periods of political turmoil and/or during wars, for example the Vietnam War. In recent years, the emigration from Canada to the U.S. is very small in numbers compared to immigrants coming to Canada.
It should be noted that immigration has always been offset by emigration: at times this was of great concerns of governments intent on filling up the country, particularly the western provinces. The United States was overall the primary destination followed by reverse migration.Emigration to the US averaged on million a year from 1880 to 1910, almost 750,000 from 1911 to 1920 and 1.25 through 1930. Between 1945 and 1965 emigration to the US averaged 40–45000 yearly. The population of Canada was roughly 10% of the US population from 1830 to 1870, but dropped to 6% by 1900 due to the emigration to the US and in spite of large-scale immigration. It was not until 1940 that the population of Canada reached the 10% mark again. In times of economic difficulty, Canadian governments frequently resorted to deportation and coerced "voluntary" deportation to thin out ranks of unemployed workers; however, by the time of the Mackenzie-King government it was realized that this was an improvident short-term solution resulting in future labor shortages (that immigration was initially intended to overcome).
Immigration rate
In 2001, 250,640 people immigrated to Canada, relative to a total population of 30,007,094 people per the 2001 Census. Since 2001, immigration has ranged between 221,352 and 262,236 immigrants per annum.[14] The three main official reasons given for the level of immigration are:
100,000 + |
50,000-99,999 |
20,000-49,999 |
10,000-19,999 |
- The social component – Canada facilitates family reunification.
- The humanitarian component – Relating to refugees.
- The economic component – Attracting immigrants who will contribute economically and fill labour market needs (See related article, Economic impact of immigration to Canada).
The level of immigration peaked in 1993 in the last year of the Progressive Conservative government and was maintained by Liberal Party of Canada. Ambitious targets of an annual 1% per capita immigration rate were hampered by financial constraints. The Liberals committed to raising actual immigration levels further in 2005. All political parties are now cautious about criticizing the high level of immigration. Consequently, immigration levels to Canada (roughly 0.7% per year) are considerably higher per capita than to the United States (about a million, or 0.3%, per year). Further, much of the immigration to the United States is from Latin America, with relatively less from Asia; the United States only admits about twice as many immigrants from Asian countries like China, India, the Philippines, and Pakistan as Canada, despite having nine times the population. Due to this, the largest minority in the United States is the Latin American population, while Canada's largest minority is its Asian population.
Immigrant population growth is concentrated in or near large cities (particularly Vancouver, Toronto, and Montreal). These cities are experiencing increased services demands that accompany strong population growth, causing concern about the capability of infrastructure in those cities to handle the influx. For example, a Toronto Star article published on 14 July 2006 authored by Daniel Stoffman noted that 43% of immigrants move to the Greater Toronto Area and said "unless Canada cuts immigrant numbers, our major cities will not be able to maintain their social and physical infrastructures".[15] Most of the provinces that do not have one of those destination cities have implemented strategies to try to boost their share of immigration.
According to Citizenship and Immigration Canada, under the Canada-Quebec Accord of 1991, Quebec has sole responsibility for selecting most immigrants destined to the province. Of course, once immigrants are granted permanent residency or citizenship they are free to move between and reside in any provinces under Section 6 of the Canadian Charter of Rights and Freedoms.
Immigration categories
There are three main categories to Canadian immigration:
- Economic immigrants
- Citizenship and Immigration Canada uses seven sub-categories of economic immigrants. The high-profile Skilled worker principal applicants group comprised 19.8% of all immigration in 2005. Canada has also created a VIP Business Immigration Program which allows immigrants with sufficient business experience or management experience to receive the Permanent Residency in a shorter period than other types of immigration. The Province of Quebec has a program called the Immigrant Investor Program.[14]
- Family class
- Under a government program, both citizens and permanent residents can sponsor family members to immigrate to Canada.
- Refugees
- Immigration of refugees and those in need of protection.
Acceptance of refugees has been strangely erratic; for example, Canada once accepted a large block of Estonians displaced by Russian advances but refused Jewish people displaced to western Europe prior to WWII and refused entry to Jewish DPs after WWII. A large block of Romanian refugees was accepted during the height of the communist regime. At times Mennonites and Hutterites were accepted based on their agricultural acumen but at other times denied based on their tendency to not integrate with Anglo-Saxon society (often held to be the ideal).
In 2010, Canada accepted 280,681 immigrants (permanent and temporary) of which 186,913 (67%) were Economic immigrants; 60,220 (22%) were Family class; 24,696 (9%) were Refugees; and 8,845 (2%) were Other.[16] Some 60,000 come to Canada each year under the International Experience Canada initiative, which provides Working Holiday, internship, and study visas.[17]
Under Canadian nationality law an immigrant can apply for citizenship after living in Canada for 1095 days (3 years) in any 5-year period provided that they lived in Canada as a permanent resident for at least two of those years.[18]
As of May 1, 2014 the Federal Skilled Worker Class opened once again accepting 25,000 applicants with intake caps at 1,000 per category. A New Economic Action Plan 2015 took effect in January 2015 in which the skilled worker program will be more of an employer based program. The current list of accepted occupations for 2014 includes many occupations such as senior managers, accountants, physicians and medical professionals, professionals in marketing and advertising, real estate professionals and many more.[19] The changes in 2015 moved permanent residency in Canada away from the 'first come, first served' model, and towards a new structure that took on permanent residents based on Canada's economic need. The new system is called "Express Entry".[20]
Effective August 2, 2016 all home buyers (including immigrants and refugees) who are not Canadian citizens nor have landed immigrant status are obliged to pay a 15% Property Transfer Tax when purchasing residential property in the Greater Vancouver Regional District.[21]
Sources of immigration
Canada receives its immigrant population from 195 countries.
| Rank | Country | Number | Percentage |
|---|---|---|---|
| 1 | | 33,908 | 13.1 |
| 2 | | 30,576 | 11.8 |
| 3 | | 28,943 | 10.5 |
| 4 | | 9,931 | 4.4 |
| 5 | | 9,414 | 4.1 |
| 6 | | 8,138 | 3.9 |
| 7 | | 6,463 | 2.8 |
| 8 | 6,365 | 2.3 | |
| 9 | | 5,599 | 1.7 |
| 10 | | 5,308 | 1.6 |
| Top 10 Total | 145,418 | 56.2 | |
| Other | 113,535 | 43.8 | |
| Total | 258,953 | 100 |
Statistics Canada projects that, by 2031, almost one-half of the population over the age of 15 will be foreign-born or have at least one foreign-born parent.[23] The number of visible minorities will double and make up the majority of the population of cities in Canada.[24]
Canadian immigrant population by country of birth (2005)
"Immigrant" refers to all those who hold or have ever held permanent resident status in Canada, including naturalized citizens.[25][26]
| Rank | Country of birth | Population | Portion of immigrants in Canada | Portion of Canadian population | Notes |
|---|---|---|---|---|---|
| 1 | |
24,788,720 | N/A | 79.3% | |
| 2 | |
579,620 | 9.4% | 1.9% | From England, Northern Ireland, Scotland, and Wales. |
| 3 | |
466,940 | 7.5% | 1.5% | The official name is 'People's Republic of China'. These figures exclude Hong Kong and Macau, which have separate lines below in this table. |
| 4 | |
443,690 | 7.2% | 1.4% | |
| 5 | |
303,195 | 4.9% | 1% | |
| 6 | |
296,850 | 4.8% | 1% | |
| 7 | |
250,535 | 4% | 0.8% | |
| 8 | |
215,430 | 3.5% | 0.7% | Special administrative region of the People's Republic of China. |
| 9 | |
171,405 | 2.8% | 0.5% | |
| 10 | |
170,490 | 2.8% | 0.5% | |
| 11 | |
160,170 | 2.6% | 0.5% | Many from the former Republic of Vietnam |
| 12 | |
150,390 | 2.4% | 0.5% | |
| 13 | |
133,280 | 2.2% | 0.4% | |
| 14 | |
123,420 | 2% | 0.4% | |
| 15 | |
111,990 | 1.8% | 0.4% | |
| 16 | |
105,670 | 1.7% | 0.3% | |
| 17 | |
98,395 | 1.6% | 0.3% | |
| 18 | |
92,090 | 1.5% | 0.3% | |
| 19 | |
87,195 | 1.4% | 0.3% | |
| 20 | |
82,645 | 1.3% | 0.3% | |
| 21 | |
79,550 | 1.3% | 0.3% | |
| 22 | |
75,275 | 1.2% | 0.2% | |
| 23 | |
73,125 | 1.2% | 0.2% | |
| 24 | |
65,540 | 1.1% | 0.2% | |
| 25 | |
65,205 | 1.1% | 0.2% | The official name is 'Republic of China'. |
| 26 | |
64,130 | 1% | 0.2% | |
| 27 | |
63,350 | 1% | 0.2% | |
| 28 | |
59,460 | 1% | 0.2% | |
| 29 | |
49,925 | 0.8% | 0.2% | |
| 30 | |
45,940 | 0.7% | 0.1% | |
| 31 | |
42,780 | 0.7% | 0.1% | |
| 32 | |
40,575 | 0.7% | 0.1% | |
| 33 | |
39,250 | 0.6% | 0.1% | |
| 34 | |
39,145 | 0.6% | 0.1% | |
| 35 | |
39,055 | 0.6% | 0.1% | |
| 36 | |
38,305 | 0.6% | 0.1% | |
| 37 | |
37,205 | 0.6% | 0.1% | The abbreviation 'n.o.s.' means 'not otherwise specified'. Includes immigrants from the former Yugoslavia who did not specify Bosnia and Herzegovina, Croatia, Macedonia, Serbia, Montenegro, or Slovenia. |
| 38 | |
36,165 | 0.6% | 0.1% | |
| 39 | |
33,545 | 0.5% | 0.1% | |
| 40 | |
33,230 | 0.5% | 0.1% | |
| 41 | |
32,255 | 0.5% | 0.1% | |
| 42 | |
28,730 | 0.5% | 0.1% | |
| 43 | |
26,505 | 0.4% | 0.1% | |
| 44 | |
25,465 | 0.4% | 0.1% | Now divided into Serbia and Montenegro. |
| 45 | |
24,390 | 0.4% | 0.1% | |
| 46 | |
22,475 | 0.4% | 0.1% | |
| 47 | |
22,370 | 0.4% | 0.1% | |
| 48 | |
22,080 | 0.4% | 0.1% | |
| 49 | |
22,030 | 0.4% | 0.1% | |
| 50 | |
21,885 | 0.4% | 0.1% | |
| 51 | |
21,705 | 0.4% | 0.1% | |
| 52 | |
21,580 | 0.3% | 0.1% | |
| 53 | |
21,320 | 0.3% | 0.1% | |
| 54 | |
20,795 | 0.3% | 0.1% | |
| 55 | |
20,215 | 0.3% | 0.1% | |
| 56 | |
20,190 | 0.3% | 0.1% | |
| 57 | |
19,955 | 0.3% | 0.1% | |
| 58 | |
19,765 | 0.3% | 0.1% | |
| 59 | |
19,715 | 0.3% | 0.1% | |
| 60 | |
19,515 | 0.3% | 0.1% | |
| 61 | |
18,830 | 0.3% | 0.1% | |
| 62 | |
18,800 | 0.3% | 0.1% | |
| 63 | |
18,165 | 0.3% | 0.1% | Includes Norfolk Island. |
| 64 | |
18,120 | 0.3% | 0.1% | |
| 65 | |
17,360 | 0.3% | 0.1% | Includes the Faroe Islands. |
| 66 | |
15,955 | 0.3% | 0.1% | |
| 67 | |
15,705 | 0.3% | 0.1% | |
| 68 | |
15,325 | 0.2% | 0% | |
| 69 | |
15,120 | 0.2% | 0% | |
| 70 | |
14,825 | 0.2% | 0% | |
| 71 | |
14,705 | 0.2% | 0% | |
| 72 | |
14,465 | 0.2% | 0% | |
| 73 | |
14,125 | 0.2% | 0% | |
| 74 | |
13,480 | 0.2% | 0% | |
| 75 | |
12,590 | 0.2% | 0% | Now divided into Sudan and South Sudan. |
| 76 | |
12,545 | 0.2% | 0% | |
| 77 | |
12,260 | 0.2% | 0% | |
| 78 | |
11,630 | 0.2% | 0% | |
| 79 | |
11,005 | 0.2% | 0% | |
| 80 | |
10,520 | 0.2% | 0% | |
| 81 | |
10,295 | 0.2% | 0% | |
| 82 | |
10,290 | 0.2% | 0% | |
| 83 | |
10,270 | 0.2% | 0% | |
| 84 | |
9,880 | 0.2% | 0% | |
| 85 | |
9,865 | 0.2% | 0% | |
| 86 | |
9,705 | 0.2% | 0% | |
| 87 | |
9,660 | 0.2% | 0% | |
| 88 | |
9,460 | 0.2% | 0% | |
| 89 | |
9,415 | 0.2% | 0% | Includes Niue and Tokelau. |
| 90 | |
9,095 | 0.1% | 0% | |
| 91 | |
8,865 | 0.1% | 0% | |
| 92 | |
8,795 | 0.1% | 0% | |
| 93 | |
8,740 | 0.1% | 0% | |
| 94 | |
8,505 | 0.1% | 0% | |
| 95 | |
8,255 | 0.1% | 0% | |
| 96 | |
7,530 | 0.1% | 0% | |
| 97 | |
7,440 | 0.1% | 0% | |
| 98 | |
7,410 | 0.1% | 0% | |
| 99 | |
7,270 | 0.1% | 0% | |
| 100 | |
7,085 | 0.1% | 0% | |
| 101 | |
6,845 | 0.1% | 0% | |
| 102 | |
6,635 | 0.1% | 0% | |
| 103 | |
6,525 | 0.1% | 0% | |
| 104 | |
6,505 | 0.1% | 0% | |
| 105 | |
6,420 | 0.1% | 0% | |
| 106 | |
6,415 | 0.1% | 0% | |
| 107 | |
6,200 | 0.1% | 0% | Composed of the Gaza Strip and the West Bank. |
| 108 | |
6,130 | 0.1% | 0% | |
| 109 | |
6,005 | 0.1% | 0% | Special administrative region of the People's Republic of China. |
| 110 | |
5,300 | 0.1% | 0% | |
| 111 | |
5,250 | 0.1% | 0% | |
| 112 | |
5,245 | 0.1% | 0% | |
| 113 | |
5,165 | 0.1% | 0% | |
| 114 | |
4,800 | 0.1% | 0% | Formerly known as Burma. |
| 115 | |
4,425 | 0.1% | 0% | |
| 116 | |
4,220 | 0.1% | 0% | |
| 117 | |
4,175 | 0.1% | 0% | |
| 118 | |
3,770 | 0.1% | 0% | |
| 119 | |
3,520 | 0.1% | 0% | |
| 120 | |
3,440 | 0.1% | 0% | |
| 121 | |
3,305 | 0.1% | 0% | |
| 122 | |
3,090 | 0% | 0% | |
| 123 | |
3,045 | 0% | 0% | |
| 124 | |
2,940 | 0% | 0% | |
| 125 | |
2,830 | 0% | 0% | |
| 126 | |
2,800 | 0% | 0% | |
| 127 | |
2,760 | 0% | 0% | |
| 128 | |
2,620 | 0% | 0% | |
| 129 | |
2,610 | 0% | 0% | |
| 130 | |
2,520 | 0% | 0% | |
| 131 | |
2,370 | 0% | 0% | |
| 132 | |
2,340 | 0% | 0% | |
| 133 | |
2,305 | 0% | 0% | Also known as Côte d'Ivoire. |
| 134 | |
2,260 | 0% | 0% | |
| 135 | |
2,220 | 0% | 0% | The abbreviation 'n.o.s.' means 'not otherwise specified'. The official name of the country was 'Union of Soviet Socialist Republics'. Includes immigrants from the former Soviet Union who did not state which former Soviet country they were born in. As of the Canada 2006 Census, the countries that were once part of the Soviet Union include Armenia, Azerbaijan, Belarus, Estonia, Georgia, Kazakhstan, Kyrgyzstan, Latvia, Lithuania, Moldova, Russia, Tajikistan, Turkmenistan, Ukraine, and Uzbekistan. |
| 136 | |
2,205 | 0% | 0% | |
| 137 | |
2,195 | 0% | 0% | |
| 138 | |
2,080 | 0% | 0% | |
| 138 | |
2,080 | 0% | 0% | The abbreviation 'n.o.s.' means 'not otherwise specified'. Includes immigrants from the former Czechoslovakia who did not state which former Czechoslovak country they were born in. As of the Canada 2006 Census, the countries that were once part of Czechoslovakia include the Czech Republic and Slovakia. |
| 139 | |
2,055 | 0% | 0% | |
| 140 | |
2,030 | 0% | 0% | |
| 141 | |
1,930 | 0% | 0% | |
| 142 | |
1,590 | 0% | 0% | |
| 143 | |
1,530 | 0% | 0% | |
| 144 | |
1,400 | 0% | 0% | |
| 145 | |
1,340 | 0% | 0% | |
| 146 | |
1,255 | 0% | 0% | |
| 147 | |
1,215 | 0% | 0% | |
| 148 | |
1,090 | 0% | 0% | |
| 149 | |
1,050 | 0% | 0% | |
| 150 | |
970 | 0% | 0% | |
| 151 | |
885 | 0% | 0% | |
| 152 | |
855 | 0% | 0% | |
| 153 | |
830 | 0% | 0% | |
| 154 | |
810 | 0% | 0% | |
| 155 | |
765 | 0% | 0% | |
| 156 | |
730 | 0% | 0% | |
| 157 | |
685 | 0% | 0% | |
| 158 | |
630 | 0% | 0% | |
| 159 | |
580 | 0% | 0% | |
| 160 | |
570 | 0% | 0% | |
| 161 | |
560 | 0% | 0% | |
| 162 | |
530 | 0% | 0% | |
| 163 | |
525 | 0% | 0% | |
| 164 | |
515 | 0% | 0% | |
| 165 | |
510 | 0% | 0% | |
| 166 | |
500 | 0% | 0% | Now divided into Bonaire, Curaçao, Saba, St. Eustatius, and St. Maarten. At one time it also included Aruba. |
| 167 | |
425 | 0% | 0% | |
| 168 | |
385 | 0% | 0% | |
| 169 | |
380 | 0% | 0% | |
| 170 | |
375 | 0% | 0% | |
| 171 | |
365 | 0% | 0% | |
| 172 | |
335 | 0% | 0% | |
| 173 | |
330 | 0% | 0% | |
| 174 | |
325 | 0% | 0% | |
| 175 | |
320 | 0% | 0% | |
| 176 | |
275 | 0% | 0% | |
| 177 | |
225 | 0% | 0% | |
| 178 | |
220 | 0% | 0% | |
| 179 | |
215 | 0% | 0% | |
| 179 | |
215 | 0% | 0% | |
| 180 | |
200 | 0% | 0% | |
| 181 | |
165 | 0% | 0% | |
| 181 | |
165 | 0% | 0% | The official name is 'Democratic People's Republic of Korea'. |
| 182 | |
160 | 0% | 0% | |
| 183 | |
140 | 0% | 0% | |
| 184 | |
100 | 0% | 0% | |
| 185 | |
95 | 0% | 0% | |
| 186 | |
90 | 0% | 0% | |
| 186 | |
90 | 0% | 0% | |
| 186 | |
90 | 0% | 0% | |
| 187 | |
85 | 0% | 0% | |
| 187 | |
85 | 0% | 0% | |
| 188 | |
80 | 0% | 0% | |
| 189 | |
70 | 0% | 0% | |
| 189 | |
70 | 0% | 0% | |
| 190 | |
60 | 0% | 0% | |
| 190 | |
60 | 0% | 0% | |
| 191 | |
55 | 0% | 0% | |
| 192 | |
45 | 0% | 0% | |
| 192 | |
45 | 0% | 0% | |
| 193 | |
40 | 0% | 0% | |
| 194 | |
40 | 0% | 0% | |
| 195 | |
35 | 0% | 0% | |
| 196 | |
30 | 0% | 0% | |
| 196 | |
30 | 0% | 0% | |
| 196 | |
30 | 0% | 0% | |
| 197 | |
20 | 0% | 0% | |
| 197 | |
20 | 0% | 0% | |
| 197 | |
20 | 0% | 0% | |
| 198 | |
15 | 0% | 0% | Also known as Timor-Leste. |
| 198 | |
15 | 0% | 0% | |
| 198 | |
15 | 0% | 0% | Now known as St. Helena, Ascension and Tristan da Cunha. |
| 198 | |
15 | 0% | 0% | |
| 199 | |
10 | 0% | 0% | |
| 199 | |
10 | 0% | 0% | |
| 199 | |
10 | 0% | 0% | |
| 199 | |
10 | 0% | 0% | |
| 199 | |
10 | 0% | 0% | |
| 199 | |
10 | 0% | 0% | |
| Outside Canada | 6,186,950 | 100% | 19.8% | ||
| Others | 6,220 | 0.1% | 0% | Includes a small number of immigrants who were born in Canada, as well as other places of birth not classified elsewhere. |
2011 immigration statistics
| Number of immigrants granted permanent residence in Canada in 2011 by source country[27] | ||||
|---|---|---|---|---|
| Rank | Country | Number of immigrants admitted | Proportion of total | Notes |
| 1 | |
34,991 | 14.1% | |
| 2 | |
28,696 | 11.5% | Hong Kong, Macau and Taiwan included separately. |
| 3 | |
24,965 | 10% | |
| 4 | |
8,829 | 3.5% | |
| 5 | |
6,840 | 2.7% | |
| 6 | |
6,550 | 2.6% | |
| 7 | |
6,208 | 2.5% | |
| 8 | |
6,073 | 2.4% | |
| 9 | |
5,867 | 2.4% | |
| 10 | |
5,223 | 2.1% | |
| 11 | |
4,698 | 1.9% | |
| 12 | |
4,573 | 1.8% | |
| 13 | |
4,317 | 1.7% | |
| 14 | |
4,155 | 1.7% | |
| 15 | |
3,800 | 1.5% | |
| 16 | |
3,642 | 1.5% | |
| 17 | |
3,403 | 1.4% | |
| 18 | |
3,104 | 1.2% | |
| 19 | |
2,768 | 1.1% | |
| 20 | |
2,455 | 1% | |
| 21 | |
2,449 | 1% | |
| 22 | |
2,335 | 0.9% | |
| 23 | |
2,299 | 0.9% | |
| 24 | |
2,254 | 0.9% | |
| 25 | |
2,038 | 0.8% | |
| 26 | |
2,021 | 0.8% | |
| 27 | |
1,977 | 0.8% | |
| 28 | |
1,967 | 0.8% | Does not include the Gaza Strip, the Golan Heights, or the West Bank. |
| 29 | |
1,894 | 0.8% | |
| 30 | |
1,887 | 0.8% | |
| 31 | |
1,723 | 0.7% | |
| 32 | |
1,682 | 0.7% | |
| 33 | |
1,519 | 0.6% | |
| 34 | |
1,475 | 0.6% | |
| 35 | |
1,446 | 0.6% | |
| 36 | |
1,368 | 0.5% | |
| 37 | |
1,349 | 0.5% | |
| 38 | |
1,339 | 0.5% | |
| 39 | |
1,256 | 0.5% | |
| 40 | |
1,249 | 0.5% | |
| 41 | |
1,181 | 0.5% | |
| 42 | |
1,179 | 0.5% | |
| 43 | |
1,166 | 0.5% | |
| 44 | |
1,120 | 0.5% | |
| 45 | |
1,058 | 0.4% | |
| 46 | |
1,036 | 0.4% | |
| 47 | |
1,025 | 0.4% | |
| 48 | |
979 | 0.4% | |
| 49 | |
938 | 0.4% | |
| 50 | |
876 | 0.4% | |
| 51 | |
874 | 0.4% | |
| 52 | |
820 | 0.3% | Special administrative region of the People's Republic of China. |
| 53 | |
761 | 0.3% | |
| 54 | |
759 | 0.3% | |
| 55 | |
750 | 0.3% | |
| 56 | |
662 | 0.3% | |
| 57 | |
658 | 0.3% | |
| 58 | |
657 | 0.3% | |
| 59 | |
633 | 0.3% | |
| 60 | |
629 | 0.3% | |
| 61 | |
615 | 0.2% | |
| 61 | |
615 | 0.2% | |
| 62 | |
572 | 0.2% | |
| 63 | |
544 | 0.2% | |
| 64 | |
542 | 0.2% | |
| 65 | |
523 | 0.2% | |
| 66 | |
518 | 0.2% | |
| 67 | |
511 | 0.2% | |
| 68 | |
506 | 0.2% | |
| 69 | |
503 | 0.2% | |
| 70 | |
488 | 0.2% | Now divided into Sudan and South Sudan. |
| 71 | |
485 | 0.2% | |
| 72 | |
471 | 0.2% | |
| 73 | |
458 | 0.2% | |
| 74 | |
455 | 0.2% | |
| 75 | |
448 | 0.2% | |
| 76 | |
447 | 0.2% | |
| 77 | |
437 | 0.2% | |
| 78 | |
436 | 0.2% | |
| 79 | |
410 | 0.2% | |
| 80 | |
388 | 0.2% | |
| 81 | |
368 | 0.1% | |
| 82 | |
367 | 0.1% | |
| 83 | |
356 | 0.1% | |
| 84 | |
355 | 0.1% | |
| 85 | |
311 | 0.1% | |
| 85 | |
311 | 0.1% | |
| 86 | |
298 | 0.1% | |
| 87 | |
288 | 0.1% | |
| 88 | |
285 | 0.1% | |
| 89 | |
281 | 0.1% | |
| 90 | |
276 | 0.2% | |
| 91 | |
262 | 0.1% | |
| 92 | |
261 | 0.1% | Includes the Gaza Strip and the West Bank. |
| 93 | |
252 | 0.1% | |
| 94 | |
248 | 0.1% | |
| 95 | |
244 | 0.1% | |
| 96 | |
233 | 0.1% | |
| 97 | |
229 | 0.1% | |
| 98 | |
227 | 0.1% | |
| 99 | |
209 | 0.1% | |
| 100 | |
196 | 0.1% | # |
| 101 | |
188 | 0.1% | |
| 102 | |
183 | 0.1% | |
| 103 | |
178 | 0.1% | |
| 104 | |
173 | 0.1% | |
| 105 | |
169 | 0.1% | |
| 106 | |
163 | 0.1% | |
| 107 | |
154 | 0.1% | |
| 108 | |
152 | 0.1% | |
| 109 | |
146 | 0.1% | |
| 110 | |
141 | 0.1% | |
| 111 | |
138 | 0.1% | |
| 112 | |
129 | 0.1% | |
| 113 | |
128 | 0.1% | |
| 113 | |
128 | 0.1% | |
| 114 | |
127 | 0.1% | |
| 115 | |
125 | 0.1% | |
| 115 | |
125 | 0.1% | |
| 116 | |
124 | 0% | |
| 117 | |
123 | 0% | |
| 118 | |
120 | 0% | |
| 118 | |
120 | 0% | |
| 119 | |
117 | 0% | |
| 120 | |
110 | 0% | |
| 121 | |
104 | 0% | |
| 121 | |
104 | 0% | |
| 122 | |
97 | 0% | |
| 123 | |
96 | 0% | |
| 124 | |
95 | 0% | |
| 125 | |
93 | 0% | |
| 126 | |
91 | 0% | |
| 127 | |
90 | 0% | |
| 128 | |
82 | 0% | |
| 129 | |
79 | 0% | |
| 130 | |
77 | 0% | |
| 131 | |
75 | 0% | |
| 132 | |
71 | 0% | |
| 133 | |
65 | 0% | |
| 134 | |
59 | 0% | |
| 134 | |
59 | 0% | |
| 135 | |
56 | 0% | |
| 136 | |
54 | 0% | |
| 137 | |
53 | 0% | |
| 138 | |
49 | 0% | |
| 139 | |
45 | 0% | |
| 140 | |
43 | 0% | |
| 141 | |
42 | 0% | |
| 141 | |
42 | 0% | |
| 142 | |
41 | 0% | |
| 143 | |
40 | 0% | |
| 144 | |
38 | 0% | |
| 145 | |
34 | 0% | |
| 146 | |
31 | 0% | |
| 147 | |
29 | 0% | Special administrative region of the People's Republic of China. |
| 148 | |
28 | 0% | |
| 149 | |
27 | 0% | |
| 150 | |
25 | 0% | Now divided into Serbia, and Montenegro. |
| 151 | |
24 | 0% | |
| 151 | |
24 | 0% | |
| 152 | |
23 | 0% | |
| 152 | |
23 | 0% | |
| 153 | |
19 | 0% | |
| 154 | |
16 | 0% | |
| 154 | |
16 | 0% | |
| 155 | |
14 | 0% | |
| 155 | |
14 | 0% | |
| 155 | |
14 | 0% | |
| 156 | |
12 | 0% | |
| 156 | |
12 | 0% | |
| 157 | |
10 | 0% | |
| 158 | |
6 | 0% | |
| Other countries | 2,326 | 0.9% | ||
| Country not stated | 58 | 0% | ||
| Total | 248,748 | 100% | ||
Permanent Residents admitted in 2013
| Rank | Country | Number | Percentage |
|---|---|---|---|
| 1 | | 33,908 | 13.1 |
| 2 | | 30,576 | 11.8 |
| 3 | | 27,292 | 10.5 |
| 4 | | 11,354 | 4.4 |
| 5 | | 10,624 | 4.1 |
| 6 | | 10,038 | 3.9 |
| 7 | | 7,148 | 2.8 |
| 8 | | 5,935 | 2.3 |
| 9 | | 4,450 | 1.7 |
| 10 | | 4,093 | 1.6 |
| Top 10 Total | 145,418 | 56.2 | |
| Other | 113,535 | 43.8 | |
| Total | 258,953 | 100 |
Autism and excessive demand
Several families have recently been denied immigration to Canada because members of their family have an autism spectrum diagnosis and Citizenship and Immigration Canada felt the potential cost of care for those family members would place an excessive demand on health or social services.[29][30] People with autism disorders can be accepted if they are able to depend on themselves.[30]
Temporary Foreign Worker Program
In 2012 more than 200 000 people were admitted to Canada under the Temporary Foreign Worker Program, three times the number in 2002.[31]
Illegal immigration in Canada
Estimates of illegal immigrants in Canada range between 35,000 and 120,000.[32] James Bissett, a former head of the Canadian Immigration Service, has suggested that the lack of any credible refugee screening process, combined with a high likelihood of ignoring any deportation orders, has resulted in tens of thousands of outstanding warrants for the arrest of rejected refugee claimants, with little attempt at enforcement.[33] A 2008 report by the Auditor General Sheila Fraser stated that Canada has lost track of as many as 41,000 illegal immigrants.[34][35]
Recent Canadian attitudes towards immigration
An October 2016 study of Canadian values by pollster Angus Reid [36] gave a conflicting picture: Although 68% of those polled said they wanted minorities to do more to fit in to the mainstream, the same number also said they were nonetheless happy with how the immigrants they knew were integrating themselves into the community. Further, 79% of Canadians believe immigration policy should be based on the country's economic and labour needs, rather than on the needs of foreigners to escape crises in their home countries. In an analysis of the survey, Reid wrote that although Canadians' commitment to multiculturalism is not increasing, nevertheless their attitudes on immigration have no white-preference racism, and that the vast majority of newcomers feel that they are treated fairly and equally as "Canadians".[37]
Settlement workers
Settlement workers help immigrants in Canada to understand their rights and responsibilities and find them programs and services they need to integrate with the new culture and prospect of livelihood. They motivate organizations to hire immigrants and support immigration through recruiting new members. They work with government agency, school board, library and other community organization with network of resources.[38]
See also
- Visa policy of Canada
- Canada (Citizenship and Immigration) v. Khosa
- Demographics of Canada
- Former colonies and territories in Canada
- History of Chinese immigration to Canada
- History of immigration to Canada
- Ministry of Immigration and Cultural Communities (Quebec), Government department for immigration to Quebec
- Top 25 Canadian Immigrants Award
References
- ↑ Grant, Tavia (28 September 2016). "320,000 newcomers came to Canada in past year, highest number since 1971". The Globe and Mail. Retrieved 13 October 2016.
- ↑ James Hollifield; Philip Martin; Pia Orrenius (2014). Controlling Immigration: A Global Perspective, Third Edition. Stanford University Press. p. 11. ISBN 978-0-8047-8627-0.
- ↑ Gary P. Freeman; Randall Hansen; David L. Leal (2013). Immigration and Public Opinion in Liberal Democracies. Routledge. p. 8. ISBN 978-1-136-21161-4.
- ↑ Abdur Rahim (2014). Canadian Immigration and South Asian Immigrants. Xlibris Corporation. p. 191. ISBN 978-1-4990-5874-1.
- ↑ Markus, Andrew. "Attitudes to immigration and cultural diversity in Australia." Journal of Sociology 50.1 (2014): 10-22.
- ↑ Marina L. Smith, "The Immigration and Naturalization Service (INS) at the U.S.–Canadian Border, 1893–1993: An Overview of Issues and Topics," Michigan Historical Review 26, No. 2 (Fall 2000), 127-147.
- ↑ Hall, "Clifford Sifton: Immigration and Settlement Policy, 1896–1905."
- ↑ David Smith, Instilling British Values in the Prairie Provinces", Prairie Forum 6#2 (1981): pp. 129–41.
- ↑ Kent Fedorowich, "Restocking the British World: Empire Migration and Anglo-Canadian Relations, 1919–30," Britain and the World (Aug 2016) 9#2 pp 236-269, DOI: http://dx.doi.org/10.3366/brw.2016.0239 open access
- ↑ Janice Cavell, "The Imperial Race and the Immigration Sieve: The Canadian Debate on Assisted British Migration and Empire Settlement, 1900–30", Journal of Imperial and Commonwealth History 34#3 (2006): pp. 345–67.
- ↑ Kurt Korneski, "Britishness, Canadianness, Class, and Race: Winnipeg and the British World, 1880s–1910s", Journal of Canadian Studies 41#2 (2007): pp. 161–84.
- ↑ Colin Singer (June 15, 2015). "Canada: Canada Citizenship Reform: A Comparative Analysis". CCIRC (Canadian Citizenship & Immigration Resource Center). Retrieved December 26, 2015.
- ↑ Statistics Canada – immigration from 1851 to 2001
- 1 2 Annual Immigration by Category, Citizenship and Immigration Canada. Retrieved July 12, 2006.
- ↑ When immigration goes awry, Toronto Star, 14 July 2006. Retrieved 5 August 2006.
- ↑ Citizenship & Immigration Canada: "Facts and figures 2010 – Immigration overview: Permanent and temporary residents" retrieved November 17, 2011
- ↑ Moving2Canada Working Holiday Visa in Canada guide retrieved March 24, 2016
- ↑ Citizenship & Immigration Canada retrieved November 17, 2011
- ↑ Offering "Express Entry" to Qualified Economic Immigrants - Actively Recruiting Talented Newcomers For the Benefit of Canada’s Economy. (Archived) Government of Canada, April 8, 2014.
- ↑ Moving2Canada Express Entry guide January 30, 2016
- ↑ http://www.lexology.com/library/detail.aspx?g=4f2cf07f-5424-41b4-8560-b14d99bccfe7
- ↑ "Citizenship and Immigration Canada, Facts and Figures". Citizenship and Immigration Canada. 2014. Retrieved Nov 30, 2014.
- ↑ "Projections of the Diversity of the Canadian Population". Statistics Canada. March 9, 2010. Retrieved 2010-03-15.
- ↑ "Parties prepare to battle for Immigrant votes". CTV.ca. 2010-03-14. Retrieved 2010-03-15.
- ↑ "Place of birth for the immigrant population by period of immigration", 2006 counts and percentages.
- ↑ "Population by immigrant status and period of immigration", 2006 counts, for Canada, provinces and territories.
- ↑ , Facts and figures 2011 — Immigration overview: Permanent and temporary residents — Permanent residents
- ↑ "Citizenship and Immigration Canada, Facts and Figures". Citizenship and Immigration Canada. 2014. Retrieved 30 November 2014.
- ↑ "American UVic prof forced to leave Canada after immigration rules son's autism too big a taxpayer burden". Daily Brew. March 31, 2012.
- 1 2 "Family faces deportation over son's autism". Toronto Star. June 9, 2011.
- ↑ "Harper says foreign worker program is being fixed - PM defends recent changes to EI and foreign worker program". CBC News. 2013-05-07.
- ↑ "Canadians want illegal immigrants deported: poll". Ottawa Citizen. CanWest MediaWorks Publications Inc. 20 October 2007. Retrieved 2010-10-18.
- ↑ "James Bissett: Stop bogus refugees before they get in". National Post. 27 September 2007. Retrieved 2015-09-04.
- ↑ "Canada has lost track of 41,000 illegals: Fraser". CTV.ca. 2008-05-06. Retrieved 2011-01-25.
- ↑ OAG 2008 May Report of the Auditor General of Canada
- ↑ "What makes us Canadian? A study of values, beliefs, priorities and identity". The Angus Reid Institute. 3 October 2016. Retrieved 2016-11-09.
- ↑ http://www.cbc.ca/news/canada/angus-reid-poll-canadian-values-immigration-1.3789223
- ↑ http://settlement.org/alternative-jobs/social-worker/settlement-worker/
Further reading
History
- Adelman, Howard; Borowski, Allan; Burstein, Meyer; and Foster, Lois, eds. Immigration and Refugee Policy: Australia and Canada Compared (1996)
- Avery, Donald H. Reluctant Host: Canada's Response to Immigrant Workers, 1896–1994 (1996)
- Carment, David; Bercuson, David Jay (2008), The World in Canada: Diaspora, Demography, and Domestic Politics, McGill-Queen's Univ. Press, ISBN 9780773532960
- Dirks, Gerald E (May 1, 1977), Canada's Refugee Policy: Indifference or Opportunism?, McGill-Queen's University Press, ISBN 978-0-7735-0296-3
- Hall, D.J. (1977), Howard Palmer, ed., "Clifford Sifton: Immigration and Settlement Policy, 1896–1905", The Settlement of the West, pp. 60–85
- Hawkins, Freda (1990), Critical Years in Immigration: Canada and Australia Compared, McGill-Queen's Press
- Kelley, Ninette; Trebilcock, Michael J. (2010), The Making of the Mosaic: A History of Canadian Immigration Policy (2nd ed.), University of Toronto Press, ISBN 978-0-8020-9536-7
- Knowles, Valerie (2008), Strangers at Our Gates: Canadian Immigration and Immigration Policy, 1540–2006 a standard scholarly history
- Lacroix, Patrick (2016). "From Strangers to 'Humanity First': Canadian Social Democracy and Immigration Policy, 1932-1961". Canadian Journal of History. 51 (1): 58–82. doi:10.1353/cnh.2016.0028.
- McLean, Lorna "'To Become Part of Us': Ethnicity, Race, Literacy and the Canadian Immigration Act of 1919", Canadian Ethnic Studies, 36#2 (2004): pp. 1–28.
- Magocsi, Paul R (1999), Encyclopedia of Canada's peoples
- Powell, John (2005), Encyclopedia of North American Immigration, Facts On File, ISBN 0-8160-4658-1
- Timlin, Mabel F (November 1960), "Canada's Immigration Policy, 1896-1910", Canadian Journal of Economics and Political Science, 26 (4), pp. 517–532, JSTOR 138931 in JSTOR
- Walker, Barrington (2008), The History of Immigration and Racism in Canada: Essential Readings, Canadian Scholars' Press, ISBN 978-1-55130-340-6
Guides
- Adu-Febiri, Francis (2009), Succeeding from the margins of Canadian society: a strategic resource for new immigrants, refugees and international students, CCB Pub, ISBN 978-1-926585-27-7
- Kranc, Benjamin A; Constantin, Elena (2004), Getting into Canada: How to Make a Successful Application for Permanent Residence, How To Books, ISBN 1-85703-929-7
- DeRocco, John F. Chabot (2008), From Sea to Sea to Sea: A Newcomer's Guide to Canada, Full Blast Productions, ISBN 978-0-9784738-4-6
- Driedger, Leo; Halli, Shivalingappa S. (1999), Immigrant Canada: Demographic, Economic, and Social Shallenges, University of Toronto Press, ISBN 0-8020-4276-7
- Moens, Alexander; Collacott, Martin (2008), Immigration Policy and the Terrorist Threat in Canada and the United States, Fraser Institute, ISBN 978-0-88975-235-1
- Noorani, Nick; Noorani, Sabrina (2008), Arrival Survival Canada: A Handbook for New Immigrants, Oxford University Press, ISBN 978-0-19-542891-9
External links
- History of Canadian immigration at Marianopolis College
- Moving Here, Staying Here: The Canadian Immigrant Experience at Library and Archives Canada
- Immigration from Canada to Belgium
- Going to Canada - Immigration Portal: A source of free and useful information for newcomers and prospective immigrants to Canada.
- Be Aware! Canadian import laws
- Multicultural Canada website