Illinois statistical areas
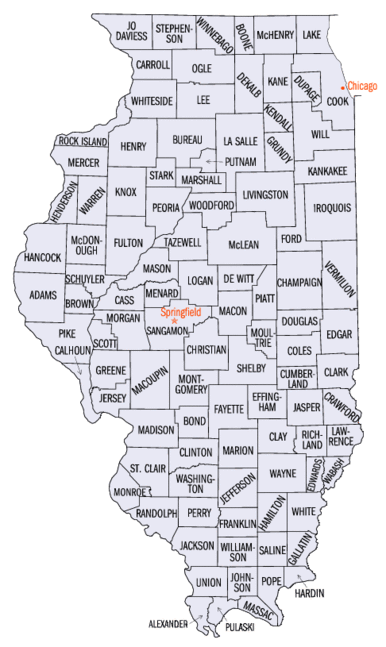
Map of the 102 counties of the State of Illinois

The statistical areas of the United States of America comprise the metropolitan statistical areas (MSAs),[1] the micropolitan statistical areas (μSAs),[2] and the combined statistical areas (CSAs)[3] currently defined by the United States Office of Management and Budget (OMB).

Most recently on December 1, 2009, the Office of Management and Budget defined 1067 statistical areas for the United States,[4] including 6 combined statistical areas, 11 metropolitan statistical areas, and 23 micropolitan statistical areas in the State of Illinois. The table below shows the recent population of these statistical areas and the 102 counties of Illinois.

Table

The table below describes the 40 United States statistical areas and 102 counties of the State of Illinois with the following information:[5]

  1. The combined statistical area (CSA) as designated by the OMB.[4]
  2. The CSA population as of July 1, 2011, as estimated by the United States Census Bureau.[6]
  3. The core based statistical area (CBSA)[7] as designated by the OMB.[4]
  4. The CBSA population as of July 1, 2011, as estimated by the United States Census Bureau.[8]
  5. The county or independent city.[9]
  6. The county or independent city population as of July 1, 2011, as estimated by the United States Census Bureau.[9]
The 40 United States statistical areas and 102 counties of the State of Illinois

Combined Statistical Area 2011 Population Core Based Statistical Area 2011 Population County 2011 Population
Chicago-Naperville-Michigan City, IL-IN-WI CSA 9,729,825 Chicago-Naperville-Joliet, IL-IN-WI MSA 9,504,753 Cook County, Illinois 5,217,080
DuPage County, Illinois 923,222
Lake County, Illinois 706,222
Will County, Illinois 681,545
Kane County, Illinois 520,271
Lake County, Indiana 495,558
McHenry County, Illinois 308,944
Kenosha County, Wisconsin 167,293
Porter County, Indiana 165,537
Kendall County, Illinois 116,631
DeKalb County, Illinois 104,743
Grundy County, Illinois 50,130
Jasper County, Indiana 33,416
Newton County, Indiana 14,161
Kankakee-Bradley, IL MSA 113,698 Kankakee County, Illinois 113,698
Michigan City-La Porte, IN MSA 111,374 LaPorte County, Indiana 111,374
St. Louis-St. Charles-Farmington, MO-IL CSA 2,882,932 St. Louis, MO-IL MSA 2,817,355 St. Louis County, Missouri 998,692
St. Charles County, Missouri 365,151
City of St. Louis, Missouri 318,069
St. Clair County, Illinois 270,259
Madison County, Illinois 268,459
Jefferson County, Missouri 219,480
Franklin County, Missouri 101,938
Lincoln County, Missouri 53,076
Macoupin County, Illinois 47,687
Clinton County, Illinois 37,956
Monroe County, Illinois 33,306
Warren County, Missouri 32,515
Washington County, Missouri 25,076
Jersey County, Illinois 22,916
Bond County, Illinois 17,727
Calhoun County, Illinois 5,048
Farmington, MO μSA 65,577 Saint Francois County, Missouri 65,577
Rockford-Freeport-Rochelle, IL CSA 447,038 Rockford, IL MSA 346,360 Winnebago County, Illinois 293,993
Boone County, Illinois 54,367
Rochelle, IL μSA 53,115 Ogle County, Illinois 53,115
Freeport, IL μSA 47,563 Stephenson County, Illinois 47,563
Peoria-Canton, IL CSA 416,538 Peoria, IL MSA 379,576 Peoria County, Illinois 186,834
Tazewell County, Illinois 135,661
Woodford County, Illinois 38,861
Marshall County, Illinois 12,553
Stark County, Illinois 5,667
Canton, IL μSA 36,962 Fulton County, Illinois 36,962
none Davenport-Moline-Rock Island, IA-IL MSA 381,342 Scott County, Iowa 167,095
Rock Island County, Illinois 147,556
Henry County, Illinois 50,328
Mercer County, Illinois 16,363
Champaign-Urbana, IL MSA 232,336 Champaign County, Illinois 201,685
Piatt County, Illinois 16,675
Ford County, Illinois 13,976
Springfield, IL MSA 211,547 Sangamon County, Illinois 198,844
Menard County, Illinois 12,703
Bloomington-Normal, IL MSA 170,556 McLean County, Illinois 170,556
Ottawa–Peru, IL μSA 154,092 LaSalle County, Illinois 113,528
Bureau County, Illinois 34,606
Putnam County, Illinois 5,968
Paducah-Mayfield, KY-IL CSA 136,609 Paducah, KY-IL μSA 99,090 McCracken County, Kentucky 65,864
Massac County, Illinois 15,442
Livingston County, Kentucky 9,531
Ballard County, Kentucky 8,253
Mayfield, KY μSA 37,519 Graves County, Kentucky 37,519
Cape Girardeau-Sikeston-Jackson, MO-IL CSA 136,160 Cape Girardeau-Jackson, MO-IL μSA 97,024 Cape Girardeau County, Missouri 76,632
Bollinger County, Missouri 12,356
Alexander County, Illinois 8,036
Sikeston, MO μSA 39,136 Scott County, Missouri 39,136
none Decatur, IL MSA 110,730 Macon County, Illinois 110,730
Danville, IL MSA 81,509 Vermilion County, Illinois 81,509
Quincy, IL-MO μSA 77,314 Adams County, Illinois 67,159
Lewis County, Missouri 10,155
Galesburg, IL μSA 70,735 Knox County, Illinois 52,917
Warren County, Illinois 17,818
Marion-Herrin, IL μSA 66,662 Williamson County, Illinois 66,662
Charleston–Mattoon, IL μSA 65,012 Coles County, Illinois 53,916
Cumberland County, Illinois 11,096
Carbondale, IL μSA 60,365 Jackson County, Illinois 60,365
Sterling, IL μSA 58,388 Whiteside County, Illinois 58,388
Burlington, IA-IL μSA 47,365 Des Moines County, Iowa 40,169
Henderson County, Illinois 7,196
Mount Vernon, IL μSA 47,138 Jefferson County, Illinois 38,713
Hamilton County, Illinois 8,425
Jacksonville, IL μSA 40,814 Morgan County, Illinois 35,543
Scott County, Illinois 5,271
Centralia, IL μSA 39,335 Marion County, Illinois 39,335
Pontiac, IL μSA 38,885 Livingston County, Illinois 38,885
Dixon, IL μSA 35,467 Lee County, Illinois 35,467
Taylorville, IL μSA 34,865 Christian County, Illinois 34,865
Effingham, IL μSA 34,280 Effingham County, Illinois 34,280
Macomb, IL μSA 32,582 McDonough County, Illinois 32,582
Lincoln, IL μSA 30,140 Logan County, Illinois 30,140
Harrisburg, IL μSA 24,981 Saline County, Illinois 24,981
none Franklin County, Illinois 39,627
Randolph County, Illinois 33,361
Montgomery County, Illinois 29,848
Iroquois County, Illinois 29,475
Jo Daviess County, Illinois 22,712
Perry County, Illinois 22,264
Shelby County, Illinois 22,212
Fayette County, Illinois 22,133
Crawford County, Illinois 19,857
Douglas County, Illinois 19,836
Hancock County, Illinois 19,031
Edgar County, Illinois 18,393
Union County, Illinois 17,708
Lawrence County, Illinois 16,745
Wayne County, Illinois 16,651
DeWitt County, Illinois 16,578
Pike County, Illinois 16,398
Richland County, Illinois 16,230
Clark County, Illinois 16,161
Carroll County, Illinois 15,163
Moultrie County, Illinois 14,824
White County, Illinois 14,663
Washington County, Illinois 14,533
Mason County, Illinois 14,485
Greene County, Illinois 13,798
Clay County, Illinois 13,728
Cass County, Illinois 13,579
Johnson County, Illinois 12,654
Wabash County, Illinois 11,834
Jasper County, Illinois 9,717
Schuyler County, Illinois 7,470
Brown County, Illinois 6,878
Edwards County, Illinois 6,618
Pulaski County, Illinois 6,046
Gallatin County, Illinois 5,528
Pope County, Illinois 4,370
Hardin County, Illinois 4,281
State of Illinois 12,869,257

See also

References

  1. The United States Office of Management and Budget (OMB) defines a metropolitan statistical area (MSA) as a core based statistical area having at least one urbanized area of 50,000 or more population, plus adjacent territory that has a high degree of social and economic integration with the core as measured by commuting ties.
  2. The United States Office of Management and Budget (OMB) defines a micropolitan statistical area (μSA) as a core based statistical area having at least one urban cluster of at least 10,000 but less than 50,000 population, plus adjacent territory that has a high degree of social and economic integration with the core as measured by commuting ties.
  3. The United States Office of Management and Budget (OMB) defines a combined statistical area (CSA) as an aggregate of adjacent core based statistical areas that are linked by commuting ties.
  4. 1 2 3 "OMB Bulletin No. 10-02: Update of Statistical Area Definitions and Guidance on Their Uses" (PDF). United States Office of Management and Budget. December 1, 2009. Retrieved August 8, 2012.
  5. An out-of-state area and its population are displayed in green. An area that extends into more than one state is displayed in teal. A teal population number over a black population number show the total population versus the in-state population.
  6. "Table 2. Annual Estimates of the Population of Combined Statistical Areas: April 1, 2010 to July 1, 2011" (CSV). 2011 Population Estimates. United States Census Bureau, Population Division. April 2012. Retrieved August 10, 2012.

  7. The United States Office of Management and Budget (OMB) defines a core based statistical area as one or more adjacent counties or county-equivalents having at least one urban cluster of at least 10,000 population, plus adjacent territory that has a high degree of social and economic integration with the core as measured by commuting ties. The core based statistical areas comprise the metropolitan statistical areas and the micropolitan statistical areas.
  8. "Table 1. Annual Estimates of the Population of Metropolitan and Micropolitan Statistical Areas: April 1, 2010 to July 1, 2011" (CSV). 2011 Population Estimates. United States Census Bureau, Population Division. April 2012. Retrieved August 10, 2012.
  9. 1 2 "Annual Estimates of the Resident Population for Counties and County-Equivalents: April 1, 2010 to July 1, 2011" (CSV). 2011 Population Estimates. United States Census Bureau, Population Division. April 2012. Retrieved August 10, 2012.
This article is issued from Wikipedia - version of the 9/9/2016. The text is available under the Creative Commons Attribution/Share Alike but additional terms may apply for the media files.