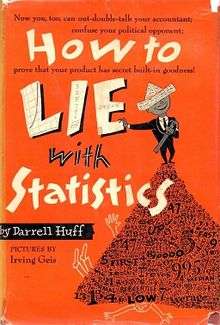
How to Lie with Statistics
 First edition | |
| Author | Darrell Huff |
|---|---|
| Illustrator | Irving Geis |
| Publisher | W. W. Norton & Company |
Publication date | 1954 |
How to Lie with Statistics is a book written by Darrell Huff in 1954 presenting an introduction to statistics for the general reader. Huff was a journalist who wrote many "how to" articles as a freelancer, but was not a statistician.
The book is a brief, breezy, illustrated volume outlining errors when it comes to the interpretation of statistics, and how these errors may create incorrect conclusions. In the 1960s and 1970s, it became a standard textbook introduction to the subject of statistics for many college students. It has become one of the best-selling statistics books in history, with over one and a half million copies sold in the English-language edition.[1] It has also been widely translated.
Themes of the book include "Correlation does not imply causation" and "Using random sampling". It also shows how statistical graphs can be used to distort reality, for example by truncating the bottom of a line or bar chart, so that differences seem larger than they are, or by representing one-dimensional quantities on a pictogram by two- or three-dimensional objects to compare their sizes, so that the reader forgets that the images do not scale the same way the quantities do.
The original edition contained humorous illustrations by artist Irving Geis. In a UK edition these were replaced with cartoons by Mel Calman.
See also
| Wikiquote has quotations related to: How to Lie with Statistics |
- Misuse of statistics
- Lies, damned lies, and statistics
- The Tiger That Isn't, a book on taking numbers out of context
Notes
- ↑ "Over the last fifty years, How to Lie with Statistics has sold more copies than any other statistical text." J. M. Steele. "Darrell Huff and Fifty Years of How to Lie with Statistics. Statistical Science, 20 (3), 2005, 205–209.
Sources
- Darrell Huff, (1954) How to Lie with Statistics (illust. I. Geis), Norton, New York, ISBN 0-393-31072-8
- Darrell Huff, (1991) How to Lie with Statistics Penguin; New Ed edition, ISBN 0-14-013629-0
External links
- Book review at www.mooreds.com
- Book review at plus.maths.org
- Book readable online: https://archive.org/details/HowToLieWithStatistics