Yolo County, California
| Yolo County, California | |||||||
|---|---|---|---|---|---|---|---|
| County | |||||||
| County of Yolo | |||||||
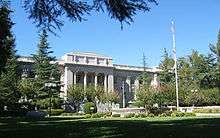
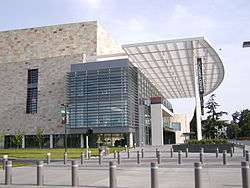
Images, from top down, left to right: Yolo County Courthouse, The Ziggurat in West Sacramento, Mondavi Center on the UC Davis campus, Downtown Winters, Canada Geese at the Yolo Bypass Wildlife Area | |||||||
| |||||||
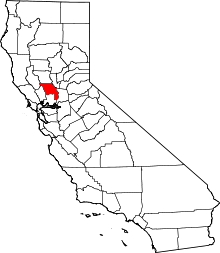 Location in the state of California | |||||||
 California's location in the United States | |||||||
| Coordinates: 38°33′14″N 121°44′17″W / 38.55389°N 121.73806°WCoordinates: 38°33′14″N 121°44′17″W / 38.55389°N 121.73806°W | |||||||
| Country | United States | ||||||
| State | California | ||||||
| Region | Sacramento Valley | ||||||
| CSA | Greater Sacramento | ||||||
| Incorporated | February 18, 1850[1] | ||||||
| County seat | Woodland | ||||||
| Largest city |
Davis (population) West Sacramento (area) | ||||||
| Area | |||||||
| • Total | 1,024 sq mi (2,650 km2) | ||||||
| • Land | 1,015 sq mi (2,630 km2) | ||||||
| • Water | 8.9 sq mi (23 km2) | ||||||
| Highest elevation[2] | 3,123 ft (952 m) | ||||||
| Population (April 1, 2010)[3] | |||||||
| • Total | 200,849 | ||||||
| • Estimate (2015)[3] | 213,016 | ||||||
| • Density | 200/sq mi (76/km2) | ||||||
| Time zone | Pacific Time Zone (UTC-8) | ||||||
| • Summer (DST) | Pacific Daylight Time (UTC-7) | ||||||
| Area codes | 530, 916 | ||||||
| FIPS code | 06-113 | ||||||
| GNIS feature ID | 277321 | ||||||
| Website |
www | ||||||


Yolo County, officially the County of Yolo, is a county located in the northern portion of the U.S. state of California. As of the 2010 census, the population was 200,849.[4] Its county seat is Woodland.[5]
Yolo County is included in the Sacramento-Roseville-Arden-Arcade, CA Metropolitan Statistical Area. The county is located in the Sacramento Valley,
Much of Yolo County remains a relatively rural agricultural region. This is evidenced by the multibillion-dollar state of California tomato industry that accounts for 90% of the canned and processed tomato production in the United States and 35% worldwide,[6] to which Yolo County is a major contributor.
Etymology
In the original act of 1850 the name was spelled "Yola." Yolo is a Native American name variously believed to be a corruption of a tribal name Yo-loy meaning "a place abounding in rushes" or of the name of the chief, Yodo, or of the village of Yodoi.
History
Yolo County was one of the original counties of California, created in 1850 at the time of statehood.
Government
The county is governed by a board of five district supervisors as well as the governments of its four incorporated cities: Davis, West Sacramento, Winters, and Woodland.
Geography

According to the U.S. Census Bureau, the county has a total area of 1,024 square miles (2,650 km2), of which 1,015 square miles (2,630 km2) is land and 8.9 square miles (23 km2) (0.9%) is water.[7]
Transportation
Major highways
County roads
Transportation in Yolo County is based on a system of numbered county roads. The numbering system works in the following way:
- North–south roads have numbers from 41 to 117 and increase from west to east.
- East–west roads have numbers from 1 to 38A, and then from 151 to 161, and increase from north to south.
Each integer road number is generally one mile (1.6 km) apart, with letters designating occasional roads less than one mile (1.6 km) apart. County roads entering urban areas generally are named once they cross the city boundary. Some examples include County Road 101 in Woodland being renamed Pioneer Ave and County Road 102 (also known as County Route E8) in Davis being named Pole Line Road.
Public transportation
- Yolobus (Yolo County Transportation District) runs buses throughout Yolo County and into Sacramento, and Sacramento International Airport.
- The University of California, Davis jointly run Unitrans, a combination local city bus and campus shuttle.
- Fairfield-Suisun Transit Line 30 also stops in Davis on its runs between Fairfield (Solano County) and Sacramento.
- Amtrak has a station in Davis.
Airports
- Yolo County Airport
- University Airport
- Borges-Clarksburg Airport
- Watts-Woodland Airport
Port
The Port of Sacramento, now known as the Port of West Sacramento, is an inland port in West Sacramento, California, in the Sacramento metropolitan area. It is 79 nautical miles (146 km) northeast of San Francisco, and is centered in the California Central Valley, one of the richest agricultural regions in the world.
Crime
The following table includes the number of incidents reported and the rate per 1,000 persons for each type of offense.
| Population and crime rates | ||
|---|---|---|
| Population[8] | 198,889 | |
| Violent crime[9] | 556 | 2.80 |
| Homicide[9] | 7 | 0.04 |
| Forcible rape[9] | 68 | 0.34 |
| Robbery[9] | 171 | 0.86 |
| Aggravated assault[9] | 310 | 1.56 |
| Property crime[9] | 2,979 | 14.98 |
| Burglary[9] | 1,357 | 6.82 |
| Larceny-theft[9][note 1] | 3,844 | 19.33 |
| Motor vehicle theft[9] | 559 | 2.81 |
| Arson[9] | 75 | 0.38 |
Cities by population and crime rates
| Cities by population and crime rates | ||||||||
|---|---|---|---|---|---|---|---|---|
| City | Population[10] | Violent crimes[10] | Violent crime rate per 1,000 persons |
Property crimes[10] | Property crime rate per 1,000 persons | |||
| Davis | 66,628 | 95 | 1.43 | 1,476 | 22.15 | |||
| West Sacramento | 49,500 | 190 | 3.84 | 1,458 | 29.45 | |||
| Winters | 6,726 | 6 | 0.89 | 84 | 12.49 | |||
| Woodland | 56,323 | 177 | 3.14 | 1,735 | 30.80 | |||
Politics
| Year | GOP | DEM | Others |
|---|---|---|---|
| 2012 | 31.3% 23,368 | 65.2% 48,715 | 3.5% 2,588 |
| 2008 | 30.8% 24,592 | 67.1% 53,488 | 2.1% 1,669 |
| 2004 | 38.8% 28,005 | 59.3% 42,885 | 1.9% 1,379 |
| 2000 | 37.5% 23,057 | 54.9% 33,747 | 7.5% 4,632 |
| 1996 | 32.4% 18,807 | 56.9% 33,033 | 10.7% 6,239 |
| 1992 | 28.2% 17,574 | 53.3% 33,297 | 18.5% 11,565 |
| 1988 | 41.9% 22,358 | 57.0% 30,429 | 1.1% 585 |
| 1984 | 47.8% 24,329 | 50.9% 25,879 | 1.3% 645 |
| 1980 | 39.5% 19,603 | 43.3% 21,527 | 17.2% 8,560 |
| 1976 | 42.4% 18,376 | 54.3% 23,533 | 3.3% 1,408 |
| 1972 | 42.0% 17,969 | 55.4% 23,694 | 2.5% 1,075 |
| 1968 | 38.4% 11,123 | 54.7% 15,833 | 6.9% 2,004 |
| 1964 | 30.4% 7,976 | 69.5% 18,266 | 0.1% 32 |
| 1960 | 44.7% 10,104 | 54.9% 12,395 | 0.4% 90 |
| 1956 | 48.0% 9,347 | 51.7% 10,075 | 0.3% 57 |
| 1952 | 53.2% 9,375 | 46.0% 8,119 | 0.8% 139 |
| 1948 | 43.8% 5,560 | 52.5% 6,655 | 3.7% 469 |
| 1944 | 41.8% 4,233 | 57.7% 5,837 | 0.5% 46 |
| 1940 | 40.3% 4,373 | 58.8% 6,380 | 0.9% 101 |
| 1936 | 29.8% 2,594 | 68.9% 5,992 | 1.2% 106 |
| 1932 | 29.5% 2,515 | 67.8% 5,780 | 2.8% 234 |
| 1928 | 57.0% 3,545 | 42.4% 2,641 | 0.6% 38 |
| 1924 | 45.4% 2,470 | 14.6% 797 | 40.0% 2,180 |
| 1920 | 62.0% 3,375 | 32.8% 1,787 | 5.3% 286 |
Yolo is a strongly Democratic county in Presidential and congressional elections. The last Republican Presidential candidate to win a majority in the county was Dwight Eisenhower in 1952, which is the longest drought for Republicans in any California county. However, some Republican Governors have carried Yolo county since then (Ronald Reagan in 1966, George Deukmejian in 1986 and Arnold Schwarzenegger in 2003 and 2006).
In the United States House of Representatives, Yolo County is split between California's 3rd and 6th congressional districts,[11] represented by John Garamendi (D–Walnut Grove)[12] and Doris Matsui (D–Sacramento),[13] respectively.
In the California State Senate, the county is split between the 3rd and 6th Senate districts,[14] represented by Bill Dodd and Richard Pan, respectively.
In the California State Assembly, the county is split between the 4th and 7th Assembly districts,[15] represented by Cecilia Aguiar-Curry and Kevin McCarty, respectively.
In November 2008, Yolo was one of just three counties in California's interior in which voters rejected Proposition 8 to ban gay marriage. Yolo voters rejected Proposition 8 by 58.4 percent to 41.6 percent. The other interior counties in which Proposition 8 failed to receive a majority of votes were Alpine County and Mono County.[16]
| Population and registered voters | ||
|---|---|---|
| Total population[8] | 198,889 | |
| Registered voters[17][note 2] | 101,849 | 51.2% |
| Democratic[17] | 48,106 | 47.2% |
| Republican[17] | 24,333 | 23.9% |
| Democratic–Republican spread[17] | +23,773 | +23.3% |
| Independent[17] | 2,835 | 2.8% |
| Green[17] | 1,044 | 1.0% |
| Libertarian[17] | 671 | 0.7% |
| Peace and Freedom[17] | 376 | 0.4% |
| Americans Elect[17] | 4 | 0.0% |
| Other[17] | 404 | 0.4% |
| No party preference[17] | 24,076 | 23.6% |
Cities by population and voter registration
| Cities by population and voter registration | |||||||
|---|---|---|---|---|---|---|---|
| City | Population[8] | Registered voters[17] [note 2] |
Democratic[17] | Republican[17] | D–R spread[17] | Other[17] | No party preference[17] |
| Davis | 65,359 | 57.6% | 54.0% | 14.7% | +39.3% | 7.1% | 26.3% |
| West Sacramento | 47,278 | 48.9% | 44.7% | 26.0% | +18.7% | 9.4% | 23.4% |
| Winters | 6,616 | 50.3% | 44.8% | 27.6% | +17.2% | 7.8% | 22.6% |
| Woodland | 55,229 | 46.9% | 43.7% | 30.4% | +13.3% | 8.2% | 20.9% |
Demographics
2011
| Population, race, and income | |||||
|---|---|---|---|---|---|
| Total population[8] | 198,889 | ||||
| White[8] | 132,734 | 66.7% | |||
| Black or African American[8] | 5,006 | 2.5% | |||
| American Indian or Alaska Native[8] | 2,485 | 1.2% | |||
| Asian[8] | 25,626 | 12.9% | |||
| Native Hawaiian or other Pacific Islander[8] | 1,112 | 0.6% | |||
| Some other race[8] | 20,510 | 10.3% | |||
| Two or more races[8] | 11,416 | 5.7% | |||
| Hispanic or Latino (of any race)[18] | 59,340 | 29.8% | |||
| Per capita income[19] | $28,631 | ||||
| Median household income[20] | $57,920 | ||||
| Median family income[21] | $74,991 | ||||
Places by population, race, and income
| Places by population and race | ||||||||
|---|---|---|---|---|---|---|---|---|
| Place | Type[22] | Population[8] | White[8] | Other[8] [note 3] |
Asian[8] | Black or African American[8] |
Native American[8] [note 4] |
Hispanic or Latino (of any race)[18] |
| Clarksburg | CDP | 423 | 87.0% | 0.0% | 0.0% | 0.0% | 13.0% | 13.9% |
| Davis | City | 65,359 | 63.8% | 11.1% | 22.0% | 1.9% | 1.2% | 13.5% |
| Dunnigan | CDP | 1,043 | 68.6% | 9.7% | 8.5% | 13.1% | 0.0% | 21.4% |
| Esparto | CDP | 2,877 | 62.8% | 35.2% | 2.0% | 0.0% | 0.0% | 55.3% |
| Guinda | CDP | 450 | 50.0% | 14.4% | 2.4% | 33.1% | 0.0% | 12.2% |
| Knights Landing | CDP | 958 | 94.6% | 1.5% | 0.0% | 0.0% | 4.0% | 47.6% |
| Madison | CDP | 287 | 54.4% | 45.6% | 0.0% | 0.0% | 0.0% | 76.0% |
| Monument Hills | CDP | 1,512 | 85.6% | 9.7% | 3.0% | 1.7% | 0.0% | 17.1% |
| University of California, Davis | CDP | 6,805 | 43.6% | 10.8% | 41.2% | 1.6% | 2.8% | 13.9% |
| West Sacramento | City | 47,278 | 64.9% | 18.3% | 8.4% | 5.3% | 3.1% | 32.9% |
| Winters | City | 6,616 | 78.6% | 16.9% | 4.0% | 0.0% | 0.6% | 49.8% |
| Woodland | City | 55,229 | 70.6% | 20.0% | 6.5% | 1.4% | 1.5% | 44.8% |
| Yolo | CDP | 335 | 33.1% | 44.5% | 0.0% | 0.0% | 22.4% | 94.0% |
| Places by population and income | |||||
|---|---|---|---|---|---|
| Place | Type[22] | Population[23] | Per capita income[19] | Median household income[20] | Median family income[21] |
| Clarksburg | CDP | 423 | $41,657 | $57,625 | $52,750 |
| Davis | City | 65,359 | $33,256 | $61,182 | $106,586 |
| Dunnigan | CDP | 1,043 | $23,883 | $61,597 | $87,778 |
| Esparto | CDP | 2,877 | $23,996 | $61,979 | $75,461 |
| Guinda | CDP | 450 | $32,398 | $115,278 | $119,196 |
| Knights Landing | CDP | 958 | $25,741 | $47,864 | $39,630 |
| Madison | CDP | 287 | $11,478 | $33,906 | $38,636 |
| Monument Hills | CDP | 1,512 | $48,180 | $137,273 | $138,523 |
| University of California, Davis | CDP | 6,805 | $7,138 | $26,053 | $26,875 |
| West Sacramento | City | 47,278 | $24,621 | $54,040 | $61,489 |
| Winters | City | 6,616 | $25,973 | $59,559 | $68,917 |
| Woodland | City | 55,229 | $26,416 | $56,859 | $67,784 |
| Yolo | CDP | 335 | $18,759 | $28,929 | $31,447 |
2010
The 2010 United States Census reported that Yolo County had a population of 200,849. The ethnic makeup of Yolo County was 126,883 (63.2%) White, 5,208 (2.6%) African American, 2,214 (1.1%) Native American, 26,052 (13.0%) Asian, 910 (0.5%) Pacific Islander, 27,882 (13.9%) from other races, and 11,700 (5.8%) from two or more races. Hispanic or Latino of any race were 60,953 persons (30.3%).[24]
| Population reported at 2010 United States Census | |||||||||
|---|---|---|---|---|---|---|---|---|---|
Population | American | American | | Islander | races | more races | or Latino (of any race) | ||
| Yolo County | 200,849 | 126,883 | 5,208 | 2,214 | 26,052 | 910 | 27,882 | 11,700 | 60,953 |
city | Population | American | American | | Islander | races | more races | or Latino (of any race) | |
| Davis | 65,622 | 42,571 | 1,528 | 339 | 14,355 | 136 | 3,121 | 3,572 | 8,172 |
| West Sacramento | 48,744 | 29,521 | 2,344 | 798 | 5,106 | 534 | 6,709 | 3,732 | 15,282 |
| Winters | 6,624 | 4,635 | 43 | 56 | 63 | 7 | 1,488 | 332 | 3,469 |
| Woodland | 55,468 | 34,904 | 855 | 726 | 3,458 | 169 | 12,488 | 2,868 | 26,289 |
place | Population | American | American | | Islander | races | more races | or Latino (of any race) | |
| Clarksburg | 418 | 339 | 2 | 2 | 16 | 1 | 37 | 21 | 109 |
| Dunnigan | 1,416 | 836 | 107 | 25 | 19 | 1 | 339 | 89 | 583 |
| Esparto | 3,108 | 1,855 | 45 | 50 | 129 | 6 | 904 | 119 | 1,538 |
| Guinda | 254 | 175 | 26 | 0 | 1 | 1 | 43 | 8 | 68 |
| Knights Landing | 995 | 560 | 4 | 10 | 7 | 0 | 338 | 76 | 644 |
| Madison | 503 | 224 | 1 | 8 | 3 | 3 | 235 | 29 | 384 |
| Monument Hills | 1,542 | 1,163 | 20 | 32 | 77 | 17 | 153 | 80 | 403 |
| University of California, Davis | 5,786 | 2,443 | 144 | 22 | 2,443 | 7 | 364 | 363 | 728 |
communities | Population | American | American | | Islander | races | more races | or Latino (of any race) | |
| All others not CDPs (combined) | 10,369 | 7,657 | 89 | 146 | 375 | 28 | 1,663 | 411 | 3,284 |
2000
| Historical population | |||
|---|---|---|---|
| Census | Pop. | %± | |
| 1850 | 1,086 | — | |
| 1860 | 4,716 | 334.3% | |
| 1870 | 9,899 | 109.9% | |
| 1880 | 11,772 | 18.9% | |
| 1890 | 12,684 | 7.7% | |
| 1900 | 13,618 | 7.4% | |
| 1910 | 13,926 | 2.3% | |
| 1920 | 17,105 | 22.8% | |
| 1930 | 23,644 | 38.2% | |
| 1940 | 27,243 | 15.2% | |
| 1950 | 40,640 | 49.2% | |
| 1960 | 65,727 | 61.7% | |
| 1970 | 91,788 | 39.7% | |
| 1980 | 113,374 | 23.5% | |
| 1990 | 141,092 | 24.4% | |
| 2000 | 168,660 | 19.5% | |
| 2010 | 200,849 | 19.1% | |
| Est. 2015 | 213,016 | [25] | 6.1% |
| U.S. Decennial Census[26] 1790-1960[27] 1900-1990[28] 1990-2000[29] 2010–2015[3] | |||
As of the census[30] of 2000, there were 168,660 people, 59,375 households, and 37,465 families residing in the county. The population density was 166 people per square mile (64/km²). There were 61,587 housing units at an average density of 61 per square mile (23/km²). The ethnic makeup of the county was 67.7% White, 2.0% Black or African American, 1.2% Native American, 9.9% Asian, 0.3% Pacific Islander, 13.8% from other races, and 5.2% from two or more races. 25.9% of the population were Hispanic or Latino of any race. 10.0% were of German, 6.6% English and 6.4% Irish ancestry according to Census 2000. 68.5% spoke English, 19.5% Spanish, 2.1% Chinese or Mandarin and 1.8% Russian as their first language.
There were 59,375 households out of which 33.6% had children under the age of 18 living with them, 47.6% were married couples living together, 11.1% had a female householder with no husband present, and 36.9% were non-families. 23.3% of all households were made up of individuals and 7.3% had someone living alone who was 65 years of age or older. The average household size was 2.71 and the average family size was 3.25.
In the county the population was spread out with 25.2% under the age of 18, 18.3% from 18 to 24, 28.2% from 25 to 44, 18.9% from 45 to 64, and 9.4% who were 65 years of age or older. The median age was 30 years. For every 100 females there were 95.6 males. For every 100 females age 18 and over, there were 92.2 males.
The median income for a household in the county was $40,769, and the median income for a family was $51,623. Males had a median income of $38,022 versus $30,687 for females. The per capita income for the county was $19,365. About 9.5% of families and 18.4% of the population were below the poverty line, including 16.0% of those under age 18 and 7.4% of those age 65 or over.
Education
Public schools
The county's public schools are managed by the Yolo County Office of Education.
Colleges and universities
Communities
.jpg)
Cities
Census-designated places
Unincorporated communities
Population ranking
The population ranking of the following table is based on the 2010 census of Yolo County.[31]
† county seat
| Rank | City/Town/etc. | Municipal type | Population (2010 Census)
|
|---|---|---|---|
| 1 | Davis | City | 65,622 |
| 2 | † Woodland | City | 55,468 |
| 3 | West Sacramento | City | 48,744 |
| 4 | Winters | City | 6,624 |
| 5 | University of California Davis | CDP | 5,786 |
| 6 | Esparto | CDP | 3,108 |
| 7 | Monument Hills | CDP | 1,542 |
| 8 | Dunnigan | CDP | 1,416 |
| 9 | Knights Landing | CDP | 995 |
| 10 | Madison | CDP | 503 |
| 11 | Yolo | CDP | 450 |
| 12 | Clarksburg | CDP | 418 |
| 13 | Guinda | CDP | 254 |
| 14 | Rumsey Indian Rancheria[32] | AIAN | 77 |
See also
- List of school districts in Yolo County, California
- National Register of Historic Places listings in Yolo County, California
Notes
- ↑ Only larceny-theft cases involving property over $400 in value are reported as property crimes.
- 1 2 Percentage of registered voters with respect to total population. Percentages of party members with respect to registered voters follow.
- ↑ Other = Some other race + Two or more races
- ↑ Native American = Native Hawaiian or other Pacific Islander + American Indian or Alaska Native
References
- ↑ "Chronology". California State Association of Counties. Retrieved February 6, 2015.
- ↑ "Little Blue Ridge". Peakbagger.com. Retrieved February 5, 2015.
- 1 2 3 "American Fact Finder - Results". United States Census Bureau. Retrieved April 6, 2016.
- ↑ "State & County QuickFacts". United States Census Bureau. Retrieved April 6, 2016.
- ↑ "Find a County". National Association of Counties. Archived from the original on May 31, 2011. Retrieved 2011-06-07.
- ↑ Processing Tomato Production in California
- ↑ "US Gazetteer files: 2010, 2000, and 1990". United States Census Bureau. 2011-02-12. Retrieved 2011-04-23.
- 1 2 3 4 5 6 7 8 9 10 11 12 13 14 15 16 17 U.S. Census Bureau. American Community Survey, 2011 American Community Survey 5-Year Estimates, Table B02001. American FactFinder Archived September 11, 2013, at the Wayback Machine.. Retrieved 2013-10-26.
- 1 2 3 4 5 6 7 8 9 10 Office of the Attorney General, Department of Justice, State of California. Table 11: Crimes – 2009. Retrieved 2013-11-14.
- 1 2 3 United States Department of Justice, Federal Bureau of Investigation. Crime in the United States, 2012, Table 8 (California). Retrieved 2013-11-14.
- ↑ "Counties by County and by District". California Citizens Redistricting Commission. Retrieved September 24, 2014.
- ↑ "California's 3rd Congressional District - Representatives & District Map". Civic Impulse, LLC.
- ↑ "California's 6th Congressional District - Representatives & District Map". Civic Impulse, LLC.
- ↑ "Communities of Interest — County". California Citizens Redistricting Commission. Retrieved September 28, 2014.
- ↑ "Communities of Interest — County". California Citizens Redistricting Commission. Retrieved September 28, 2014.
- ↑ "County-by-County Map, California Propositions: The Los Angeles Times". Latimes.com. 2008-11-04. Retrieved 2014-08-25.
- 1 2 3 4 5 6 7 8 9 10 11 12 13 14 15 16 17 California Secretary of State. February 10, 2013 - Report of Registration Archived November 3, 2013, at the Wayback Machine.. Retrieved 2013-10-31.
- 1 2 U.S. Census Bureau. American Community Survey, 2011 American Community Survey 5-Year Estimates, Table B03003. American FactFinder Archived September 11, 2013, at the Wayback Machine.. Retrieved 2013-10-26.
- 1 2 U.S. Census Bureau. American Community Survey, 2011 American Community Survey 5-Year Estimates, Table B19301. American FactFinder Archived September 11, 2013, at the Wayback Machine.. Retrieved 2013-10-21.
- 1 2 U.S. Census Bureau. American Community Survey, 2011 American Community Survey 5-Year Estimates, Table B19013. American FactFinder Archived September 11, 2013, at the Wayback Machine.. Retrieved 2013-10-21.
- 1 2 U.S. Census Bureau. American Community Survey, 2011 American Community Survey 5-Year Estimates, Table B19113. American FactFinder Archived September 11, 2013, at the Wayback Machine.. Retrieved 2013-10-21.
- 1 2 U.S. Census Bureau. American Community Survey, 2011 American Community Survey 5-Year Estimates. American FactFinder Archived September 11, 2013, at the Wayback Machine.. Retrieved 2013-10-21.
- ↑ U.S. Census Bureau. American Community Survey, 2011 American Community Survey 5-Year Estimates, Table B01003. American FactFinder Archived September 11, 2013, at the Wayback Machine.. Retrieved 2013-10-21.
- ↑ "2010 Census P.L. 94-171 Summary File Data". United States Census Bureau.
- ↑ "County Totals Dataset: Population, Population Change and Estimated Components of Population Change: April 1, 2010 to July 1, 2015". Retrieved July 2, 2016.
- ↑ "U.S. Decennial Census". United States Census Bureau. Archived from the original on May 11, 2015. Retrieved May 31, 2014.
- ↑ "Historical Census Browser". University of Virginia Library. Retrieved May 31, 2014.
- ↑ "Population of Counties by Decennial Census: 1900 to 1990". United States Census Bureau. Retrieved May 31, 2014.
- ↑ "Census 2000 PHC-T-4. Ranking Tables for Counties: 1990 and 2000" (PDF). United States Census Bureau. Retrieved May 31, 2014.
- ↑ "American FactFinder". United States Census Bureau. Archived from the original on September 11, 2013. Retrieved 2011-05-14.
- ↑ http://www.census.gov/2010census/
- ↑ http://www.census.gov/2010census/popmap/ipmtext.php?fl=3265
- Olney, Caroline M. (September 1902). "Orchards, Vineyards and Farms of Yolo County". Overland Monthly, and Out West Magazine. XL (2): 171–194. Retrieved 2009-08-15.
External links
| Wikimedia Commons has media related to Yolo County, California. |
- Official website
- Yolo County, California USENET FAQ
- Yolo County Visitors Bureau website
- Yolo County District Attorney
- Yolo County Community website
- Yolo County CAGenWeb Project (history & genealogy)
- Yolo County, Calif., map 185-? at The Bancroft Library
 |
Lake County | Colusa County | Sutter County | |
| Napa County | |
Sacramento County | ||
| ||||
| | ||||
| Solano County |
Municipalities and communities of Yolo County, California, United States | ||
|---|---|---|
| Cities | | |
| CDPs | ||
| Unincorporated communities |
| |
| Ghost towns | ||
| Footnotes | ‡This populated place also has portions in an adjacent county or counties | |