Colusa County, California
| Colusa County, California | ||
|---|---|---|
| County | ||
| County of Colusa | ||
|
Colusa County Courthouse | ||
| ||
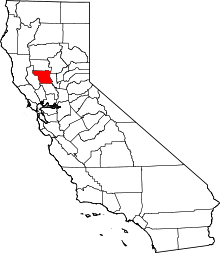 Location in the state of California | ||
 California's location in the United States | ||
| Country |
| |
| State |
| |
| Region | Sacramento Valley | |
| Incorporated | February 18, 1850[1] | |
| County seat | Colusa | |
| Largest city |
Colusa (population) Williams (area) | |
| Area | ||
| • Total | 1,156 sq mi (2,990 km2) | |
| • Land | 1,151 sq mi (2,980 km2) | |
| • Water | 5.6 sq mi (15 km2) | |
| Highest elevation[2] | 7,059 ft (2,152 m) | |
| Population (April 1, 2010)[3] | ||
| • Total | 21,419 | |
| • Estimate (2015)[3] | 21,482 | |
| • Density | 19/sq mi (7.2/km2) | |
| Time zone | Pacific Time Zone (UTC-8) | |
| • Summer (DST) | Pacific Daylight Time (UTC-7) | |
| Area code | 530 | |
| Website |
www | |


Colusa County is a county in the U.S. state of California. As of the 2010 census, the population was 21,419.[3] The county seat is Colusa.[4] It is in the Central Valley of California, northwest of the state capital, Sacramento.
History
Colusa County is one of the original counties of California, created in 1850 at the time of statehood. Parts of the county's territory were given to Tehama County in 1856 and to Glenn County in 1891.
The county was named after the 1844 Rancho Colus Mexican land grant to John Bidwell. The name of the county in the original state legislative act of 1850 was spelled Colusi, and often in newspapers was spelled Coluse. The word is derived from the name of a Native American tribe living on the west side of the Sacramento River. The name was changed to Colusa shortly after . This however is disputed. The actual origin of the name is unknown.
Geography
According to the U.S. Census Bureau, the county has a total area of 1,156 square miles (2,990 km2), of which 1,151 square miles (2,980 km2) is land and 5.6 square miles (15 km2) (0.5%) is water.[5] A large number of streams drain the county, including Elk Creek and Salt Creek.
The county's eastern boundary is formed, in part, by the Sacramento River.
National protected areas
- Butte Sink National Wildlife Refuge (part)
- Colusa National Wildlife Refuge
- Delevan National Wildlife Refuge
- Mendocino National Forest (part)
- Sacramento National Wildlife Refuge (part)
Demographics
2011
| Population, race, and income | |||||
|---|---|---|---|---|---|
| Total population[6] | 21,297 | ||||
| White[6] | 14,491 | 68.0% | |||
| Black or African American[6] | 203 | 1.0% | |||
| American Indian or Alaska Native[6] | 288 | 1.4% | |||
| Asian[6] | 252 | 1.2% | |||
| Native Hawaiian or other Pacific Islander[6] | 41 | 0.2% | |||
| Some other race[6] | 4,893 | 23.0% | |||
| Two or more races[6] | 1,129 | 5.3% | |||
| Hispanic or Latino (of any race)[7] | 11,460 | 53.8% | |||
| Per capita income[8] | $21,271 | ||||
| Median household income[9] | $49,558 | ||||
| Median family income[10] | $55,063 | ||||
Places by population, race, and income
| Places by population and race | ||||||||
|---|---|---|---|---|---|---|---|---|
| Place | Type[11] | Population[6] | White[6] | Other[6] [note 1] |
Asian[6] | Black or African American[6] |
Native American[6] [note 2] |
Hispanic or Latino (of any race)[7] |
| Arbuckle | CDP | 3,236 | 55.3% | 43.9% | 0.5% | 0.0% | 0.3% | 66.0% |
| College City | CDP | 70 | 100.0% | 0.0% | 0.0% | 0.0% | 0.0% | 35.7% |
| Colusa | City | 5,951 | 62.2% | 32.2% | 1.9% | 0.9% | 2.8% | 56.4% |
| Grimes | CDP | 517 | 64.2% | 35.8% | 0.0% | 0.0% | 0.0% | 81.8% |
| Lodoga | CDP | 185 | 85.4% | 5.9% | 0.0% | 4.3% | 4.3% | 0.0% |
| Maxwell | CDP | 1,144 | 77.4% | 22.2% | 0.3% | 0.0% | 0.0% | 65.2% |
| Princeton | CDP | 209 | 92.8% | 2.9% | 0.0% | 0.0% | 4.3% | 7.7% |
| Stonyford | CDP | 104 | 99.0% | 0.0% | 0.0% | 1.0% | 0.0% | 0.0% |
| Williams | City | 5,003 | 65.0% | 32.7% | 0.7% | 1.0% | 0.7% | 74.3% |
| Places by population and income | |||||
|---|---|---|---|---|---|
| Place | Type[11] | Population[12] | Per capita income[8] | Median household income[9] | Median family income[10] |
| Arbuckle | CDP | 3,236 | $16,604 | $48,878 | $52,708 |
| College City | CDP | 70 | $37,704 | $62,750 | $64,750 |
| Colusa | City | 5,951 | $21,811 | $49,100 | $51,667 |
| Grimes | CDP | 517 | $9,984 | $30,897 | $31,058 |
| Lodoga | CDP | 185 | $25,004 | $24,881 | $65,500 |
| Maxwell | CDP | 1,144 | $16,454 | $43,036 | $44,405 |
| Princeton | CDP | 209 | $28,005 | $58,571 | $60,000 |
| Stonyford | CDP | 104 | $21,163 | $33,750 | $49,250 |
| Williams | City | 5,003 | $14,974 | $47,934 | $52,303 |
2010
| Historical population | |||
|---|---|---|---|
| Census | Pop. | %± | |
| 1850 | 115 | — | |
| 1860 | 2,274 | 1,877.4% | |
| 1870 | 6,165 | 171.1% | |
| 1880 | 13,118 | 112.8% | |
| 1890 | 14,640 | 11.6% | |
| 1900 | 7,364 | −49.7% | |
| 1910 | 7,732 | 5.0% | |
| 1920 | 9,290 | 20.2% | |
| 1930 | 10,258 | 10.4% | |
| 1940 | 9,788 | −4.6% | |
| 1950 | 11,651 | 19.0% | |
| 1960 | 12,075 | 3.6% | |
| 1970 | 12,430 | 2.9% | |
| 1980 | 12,791 | 2.9% | |
| 1990 | 16,275 | 27.2% | |
| 2000 | 18,804 | 15.5% | |
| 2010 | 21,419 | 13.9% | |
| Est. 2015 | 21,482 | [13] | 0.3% |
| U.S. Decennial Census[14] 1790–1960[15] 1900–1990[16] 1990–2000[17] 2010–2015[3] | |||
The 2010 United States Census reported that Colusa County had a population of 21,419. The racial makeup of Colusa County was 13,854 (64.7%) White, 195 (0.9%) African American, 419 (2.0%) Native American, 281 (1.3%) Asian, 68 (0.3%) Pacific Islander, 5,838 (27.3%) from other races, and 764 (3.6%) from two or more races. Hispanic or Latino of any race were 11,804 persons (55.1%).[18]
| Population reported at 2010 United States Census | |||||||||
|---|---|---|---|---|---|---|---|---|---|
Population | American | American | | Islander | races | more races | or Latino (of any race) | ||
| Colusa County | 21,419 | 13,854 | 195 | 419 | 281 | 68 | 5,838 | 764 | 11,804 |
cities | Population | American | American | | Islander | races | more races | or Latino (of any race) | |
| Colusa | 5,971 | 3,944 | 54 | 107 | 80 | 28 | 1,510 | 248 | 3,128 |
| Williams | 5,123 | 2,785 | 59 | 55 | 94 | 4 | 1,946 | 180 | 3,891 |
places | Population | American | American | | Islander | races | more races | or Latino (of any race) | |
| Arbuckle | 3,028 | 1,746 | 18 | 23 | 18 | 5 | 1,124 | 94 | 2,116 |
| College City | 290 | 207 | 0 | 5 | 1 | 0 | 51 | 26 | 134 |
| Grimes | 391 | 284 | 7 | 3 | 1 | 0 | 65 | 31 | 258 |
| Lodoga | 197 | 167 | 16 | 4 | 2 | 2 | 3 | 3 | 8 |
| Maxwell | 1,103 | 734 | 11 | 14 | 9 | 2 | 306 | 27 | 570 |
| Princeton | 303 | 217 | 0 | 10 | 1 | 1 | 70 | 4 | 93 |
| Stonyford | 149 | 127 | 0 | 4 | 0 | 1 | 12 | 5 | 22 |
communities | Population | American | American | | Islander | races | more races | or Latino (of any race) | |
| All others not CDPs (combined) | 4,864 | 3,643 | 30 | 194 | 75 | 25 | 751 | 146 | 1,584 |
2000
As of the census[19] of 2000, there were 18,804 people, 6,097 households, and 4,578 families residing in the county. The population density was 16 people per square mile (6/km²). There were 6,774 housing units at an average density of 6 per square mile (2/km²). The racial makeup of the county was 64.3% White, 0.6% Black or African American, 2.3% Native American, 1.2% Asian, 0.4% Pacific Islander, 26.7% from other races, and 4.5% from two or more races. 46.5% of the population were Hispanic or Latino of any race. 8.5% were of German, 5.6% English, 5.5% American and 5.4% Irish ancestry according to Census 2000. 58.7% spoke English and 40.4% Spanish as their first language.
There were 6,097 households out of which 41.4% had children under the age of 18 living with them, 59.6% were married couples living together, 9.6% had a female householder with no husband present, and 24.9% were non-families. 21.5% of all households were made up of individuals and 10.1% had someone living alone who was 65 years of age or older. The average household size was 3.01 and the average family size was 3.51.
In the county the population was spread out with 31.6% under the age of 18, 10.3% from 18 to 24, 26.9% from 25 to 44, 19.8% from 45 to 64, and 11.4% who were 65 years of age or older. The median age was 32 years. For every 100 females there were 103.4 males. For every 100 females age 18 and over, there were 103.8 males.
The median income for a household in the county was $35,062, and the median income for a family was $40,138. Males had a median income of $32,210 versus $21,521 for females. The per capita income for the county was $14,730. About 13.0% of families and 16.1% of the population were below the poverty line, including 19.5% of those under age 18 and 8.2% of those age 65 or over.
Politics
Voter registration statistics
| Population and registered voters | ||
|---|---|---|
| Total population[6] | 21,297 | |
| Registered voters[20][note 3] | 7,663 | 36.0% |
| Democratic[20] | 2,635 | 34.4% |
| Republican[20] | 3,470 | 45.3% |
| Democratic–Republican spread[20] | -835 | -10.9% |
| Independent[20] | 171 | 2.2% |
| Green[20] | 19 | 0.2% |
| Libertarian[20] | 30 | 0.4% |
| Peace and Freedom[20] | 12 | 0.2% |
| Americans Elect[20] | 0 | 0.0% |
| Other[20] | 2 | 0.0% |
| No party preference[20] | 1,324 | 17.3% |
Cities by population and voter registration
| Cities by population and voter registration | |||||||
|---|---|---|---|---|---|---|---|
| City | Population[6] | Registered voters[20] [note 3] |
Democratic[20] | Republican[20] | D–R spread[20] | Other[20] | No party preference[20] |
| Colusa | 5,951 | 37.8% | 35.5% | 44.6% | -9.1% | 5.6% | 16.8% |
| Williams | 5,003 | 22.7% | 43.5% | 31.4% | +12.1% | 3.1% | 23.0% |
Overview
| Year | GOP | DEM | Others |
|---|---|---|---|
| 2012 | 59.6% 3,601 | 38.3% 2,314 | 2.2% 130 |
| 2008 | 57.9% 3,733 | 39.8% 2,569 | 2.3% 146 |
| 2004 | 67.2% 4,142 | 31.6% 1,947 | 1.3% 77 |
| 2000 | 64.9% 3,629 | 31.2% 1,745 | 3.9% 216 |
| 1996 | 54.3% 3,047 | 36.6% 2,054 | 9.1% 511 |
| 1992 | 45.9% 2,589 | 31.9% 1,798 | 22.2% 1,248 |
| 1988 | 59.5% 3,077 | 39.1% 2,022 | 1.4% 73 |
| 1984 | 65.3% 3,388 | 33.3% 1,725 | 1.5% 75 |
| 1980 | 58.0% 2,897 | 32.1% 1,605 | 9.9% 493 |
| 1976 | 52.7% 2,733 | 45.2% 2,340 | 2.1% 109 |
| 1972 | 57.6% 2,715 | 38.4% 1,810 | 4.1% 192 |
| 1968 | 51.6% 2,361 | 40.6% 1,858 | 7.8% 358 |
| 1964 | 39.3% 1,811 | 60.6% 2,790 | 0.1% 5 |
| 1960 | 51.4% 2,497 | 48.3% 2,348 | 0.3% 16 |
| 1956 | 53.2% 2,474 | 46.7% 2,171 | 0.1% 3 |
| 1952 | 59.8% 2,824 | 39.8% 1,881 | 0.4% 17 |
| 1948 | 46.2% 1,803 | 51.8% 2,020 | 2.0% 78 |
| 1944 | 42.9% 1,579 | 56.8% 2,090 | 0.3% 10 |
| 1940 | 39.7% 1,774 | 59.5% 2,655 | 0.8% 35 |
| 1936 | 28.2% 1,186 | 70.4% 2,965 | 1.5% 62 |
| 1932 | 27.5% 1,095 | 69.1% 2,752 | 3.4% 135 |
| 1928 | 56.3% 1,752 | 43.0% 1,338 | 0.7% 22 |
| 1924 | 43.8% 1,127 | 19.3% 495 | 36.9% 949 |
| 1920 | 61.2% 1,645 | 33.8% 907 | 5.0% 134 |
Colusa is a strongly Republican county in Presidential and congressional elections. The last Democrat to win a majority in the county was Lyndon Johnson in 1964.
Colusa County is in California's 3rd congressional district, represented by Democrat John Garamendi.[21]
In the State Assembly, Colusa County is split between the 3rd and 4th districts, represented by Republican James Gallagher and Democrat Cecilia Aguiar-Curry, respectively.[22] In the State Senate, the county is in the 4th Senate District, represented by Republican Jim Nielsen.[23]
On November 4, 2008 Colusa County voted 71.6% for Proposition 8 which amended the California Constitution to ban same-sex marriages.
Crime
The following table includes the number of incidents reported and the rate per 1,000 persons for each type of offense.
| Population and crime rates | ||
|---|---|---|
| Population[6] | 21,297 | |
| Violent crime[24] | 59 | 2.77 |
| Homicide[24] | 1 | 0.05 |
| Forcible rape[24] | 13 | 0.61 |
| Robbery[24] | 8 | 0.38 |
| Aggravated assault[24] | 37 | 1.74 |
| Property crime[24] | 352 | 16.53 |
| Burglary[24] | 197 | 9.25 |
| Larceny-theft[24][note 4] | 293 | 13.76 |
| Motor vehicle theft[24] | 37 | 1.74 |
| Arson[24] | 3 | 0.14 |
Cities by population and crime rates
| Cities by population and crime rates | ||||||||
|---|---|---|---|---|---|---|---|---|
| City | Population[25] | Violent crimes[25] | Violent crime rate per 1,000 persons |
Property crimes[25] | Property crime rate per 1,000 persons | |||
| Colusa | 6,065 | 11 | 1.81 | 170 | 28.03 | |||
| Williams | 5,200 | 9 | 1.73 | 76 | 14.62 | |||
Transportation
Major highways
Public transportation
Colusa County Transit runs buses from Colusa to Williams, Arbuckle, Grimes and College City, with limited service to Maxwell.
Airports
Colusa County Airport is a general-aviation airport located near the city of Colusa.
Communities
Cities
Census-designated places
Unincorporated community
Population ranking
The population ranking of the following table is based on the 2010 census of Colusa County.[26]
† county seat
| Rank | City/Town/etc. | Municipal type | Population (2010 Census)
|
|---|---|---|---|
| 1 | † Colusa | City | 5,971 |
| 2 | Williams | City | 5,123 |
| 3 | Arbuckle | CDP | 3,028 |
| 4 | Maxwell | CDP | 1,103 |
| 5 | Grimes | CDP | 391 |
| 6 | Princeton | CDP | 303 |
| 7 | College City | CDP | 290 |
| 8 | Lodoga | CDP | 197 |
| 9 | Stonyford | CDP | 149 |
| 10 | Colusa Rancheria[27] | AIAN | 76 |
| 11 | Cortina Rancheria[28] | AIAN | 21 |
See also
- List of school districts in Colusa County, California
- National Register of Historic Places listings in Colusa County, California
- Hiking trails in Colusa County
- Thomas D. Harp, mentions 1891 division of the county
Notes
- ↑ Other = Some other race + Two or more races
- ↑ Native American = Native Hawaiian or other Pacific Islander + American Indian or Alaska Native
- 1 2 Percentage of registered voters with respect to total population. Percentages of party members with respect to registered voters follow.
- ↑ Only larceny-theft cases involving property over $400 in value are reported as property crimes.
References
- ↑ "Chronology". California State Association of Counties. Retrieved February 6, 2015.
- ↑ "Snow Mountain". Peakbagger.com. Retrieved May 13, 2015.
- 1 2 3 4 "State & County QuickFacts". United States Census Bureau. Retrieved April 3, 2016.
- ↑ "Find a County". National Association of Counties. Archived from the original on 2011-05-31. Retrieved 2011-06-07.
- ↑ "2010 Census Gazetteer Files". United States Census Bureau. August 22, 2012. Retrieved September 24, 2015.
- 1 2 3 4 5 6 7 8 9 10 11 12 13 14 15 16 17 U.S. Census Bureau. American Community Survey, 2011 American Community Survey 5-Year Estimates, Table B02001. American FactFinder Archived September 11, 2013, at the Wayback Machine.. Retrieved 2013-10-26.
- 1 2 U.S. Census Bureau. American Community Survey, 2011 American Community Survey 5-Year Estimates, Table B03003. American FactFinder Archived September 11, 2013, at the Wayback Machine.. Retrieved 2013-10-26.
- 1 2 U.S. Census Bureau. American Community Survey, 2011 American Community Survey 5-Year Estimates, Table B19301. American FactFinder Archived September 11, 2013, at the Wayback Machine.. Retrieved 2013-10-21.
- 1 2 U.S. Census Bureau. American Community Survey, 2011 American Community Survey 5-Year Estimates, Table B19013. American FactFinder Archived September 11, 2013, at the Wayback Machine.. Retrieved 2013-10-21.
- 1 2 U.S. Census Bureau. American Community Survey, 2011 American Community Survey 5-Year Estimates, Table B19113. American FactFinder Archived September 11, 2013, at the Wayback Machine.. Retrieved 2013-10-21.
- 1 2 U.S. Census Bureau. American Community Survey, 2011 American Community Survey 5-Year Estimates. American FactFinder Archived September 11, 2013, at the Wayback Machine.. Retrieved 2013-10-21.
- ↑ U.S. Census Bureau. American Community Survey, 2011 American Community Survey 5-Year Estimates, Table B01003. American FactFinder Archived September 11, 2013, at the Wayback Machine.. Retrieved 2013-10-21.
- ↑ "County Totals Dataset: Population, Population Change and Estimated Components of Population Change: April 1, 2010 to July 1, 2015". Retrieved July 2, 2016.
- ↑ "U.S. Decennial Census". United States Census Bureau. Archived from the original on April 22, 2013. Retrieved September 24, 2015.
- ↑ "Historical Census Browser". University of Virginia Library. Retrieved September 24, 2015.
- ↑ Forstall, Richard L., ed. (March 27, 1995). "Population of Counties by Decennial Census: 1900 to 1990". United States Census Bureau. Retrieved September 24, 2015.
- ↑ "Census 2000 PHC-T-4. Ranking Tables for Counties: 1990 and 2000" (PDF). United States Census Bureau. April 2, 2001. Retrieved September 24, 2015.
- ↑ "2010 Census P.L. 94-171 Summary File Data". United States Census Bureau.
- ↑ "American FactFinder". United States Census Bureau. Archived from the original on 2013-09-11. Retrieved 2011-05-14.
- 1 2 3 4 5 6 7 8 9 10 11 12 13 14 15 16 17 California Secretary of State. February 10, 2013 - Report of Registration Archived November 3, 2013, at the Wayback Machine.. Retrieved 2013-10-31.
- ↑ "California's 3rd Congressional District - Representatives & District Map". Civic Impulse, LLC. Retrieved March 1, 2013.
- ↑ "Members Assembly". State of California. Retrieved March 21, 2013.
- ↑ "Senators". State of California. Retrieved March 21, 2013.
- 1 2 3 4 5 6 7 8 9 10 Office of the Attorney General, Department of Justice, State of California. Table 11: Crimes – 2009 Archived December 2, 2013, at the Wayback Machine.. Retrieved 2013-11-14.
- 1 2 3 United States Department of Justice, Federal Bureau of Investigation. Crime in the United States, 2012, Table 8 (California). Retrieved 2013-11-14.
- ↑ "Archived copy". Archived from the original on 2013-12-21. Retrieved 2015-12-29.
- ↑ http://www.census.gov/2010census/popmap/ipmtext.php?fl=0750
- ↑ http://www.census.gov/2010census/popmap/ipmtext.php?fl=0780
External links
| Wikimedia Commons has media related to Colusa County, California. |
 |
Glenn County | Butte County | | |
| Lake County | |
Sutter County | ||
| ||||
| | ||||
| Yolo County |
Municipalities and communities of Colusa County, California, United States | ||
|---|---|---|
| Cities | | |
| CDPs | ||
| Unincorporated communities | ||
| Ghost towns | ||
| Footnotes | ‡This populated place also has portions in an adjacent county or counties | |
Coordinates: 39°11′N 122°14′W / 39.18°N 122.24°W