Hereford, Texas
| Hereford, Texas | |
|---|---|
| City | |
|
Hereford welcome sign on U.S. Highway 385 | |
|
Motto: Beef Capital of the World; The Town Without a Toothache | |
 Location of Hereford, Texas | |
 | |
| Coordinates: 34°49′19″N 102°23′55″W / 34.82194°N 102.39861°WCoordinates: 34°49′19″N 102°23′55″W / 34.82194°N 102.39861°W | |
| Country | United States |
| State | Texas |
| County | Deaf Smith |
| Area | |
| • Total | 5.9 sq mi (15.4 km2) |
| • Land | 5.9 sq mi (15.4 km2) |
| • Water | 0.0 sq mi (0.0 km2) |
| Elevation | 3,816 ft (1,163 m) |
| Population (2010) | |
| • Total | 15,370 |
| • Density | 2,592/sq mi (1,000.8/km2) |
| Time zone | Central (CST) (UTC-6) |
| • Summer (DST) | CDT (UTC-5) |
| ZIP code | 79045 |
| Area code(s) | 806 |
| FIPS code | 48-33320 [1] |
| GNIS feature ID | 1359066 [2] |
| Website |
www |

Hereford (/ˈhɜːrfərd/ HUR-furd[3]) is a city in and county seat of Deaf Smith County, Texas, United States. The population was 15,370 at the 2010 census.[4] It is the only incorporated locality named "Hereford" in the country.[5]
Hereford's local water supply contains an unusually high level of naturally occurring fluorine. Because fluoride is used to protect against tooth decay, Hereford earned the title "The Town Without a Toothache".
It is also known as the "Beef Capital of the World" because of the large number of cattle fed in the area. The city is named for the Hereford breed. The local economy is affected significantly by growth in the dairy and ethanol industries.
The area is known for its semiarid climate with heavy farming and ranching throughout the area sustained by irrigation from the Ogallala Aquifer and the saltier Santa Rosa Aquifer beneath it.
Hereford is home to the headquarters of the Deaf Smith Electric Cooperative, which serves Deaf Smith, Castro, Parmer, and Oldham counties.[6]
A rich Western heritage includes the Las Escarbadas ranch house of the XIT Ranch located southwest of Hereford in Deaf Smith County. The restored historic structure can now be seen at the National Ranching Heritage Center at Texas Tech University in Lubbock. The Deaf Smith County Historical Museum at 400 Sampson Street in Hereford offers indoor and outdoor exhibits on the settlement of West Texas.
In December 2015, the Seattle Post-Intelligencer voted Hereford not only the "most conservative" city in Texas but in the United States as well in terms of political contributions. Other West Texas communities in the most conservative lineup are Childress (No. 9), Dalhart (No. 8), and Monahans (No. 5). Princeton in Collin County north of Dallas was ranked No. 2. In contrast, Vashon Island, Washington, was named the "most liberal" city in the nation regarding political donations.[7]
History
Hereford was originally founded as "Blue Water" in 1899 after the Pecos and Northern Texas Railway connected Amarillo to Farwell. After it was discovered that there was already a town named Blue Water, residents renamed the town "Hereford" in honor of the cattle of the local ranchers.[8]
During World War II, a prisoner-of-war camp existed there for Italian prisoners of war. It was dismantled in 1947.
Geography
Hereford is located in southeastern Deaf Smith County at 34°49′19″N 102°23′55″W / 34.82194°N 102.39861°W (34.821961, -102.398617)[9] and is located on the Llano Estacado. According to the United States Census Bureau, the city has a total area of 5.9 square miles (15.4 km2), all land.[4]
U.S. Highway 60 passes through the city as 1st Street, leading northeast 48 miles (77 km) to Amarillo and southwest 57 miles (92 km) to Clovis, New Mexico. U.S. Highway 385 (25 Mile Avenue) runs north-south through the city, leading north 30 miles (48 km) to Interstate 40 at Vega and south 20 miles (32 km) to Dimmitt.
Climate
Hereford's climate is classified as a steppe climate (BSk) using the 2006 map of Köppen climate classification, meaning it is semi-arid.[10] Hereford was named as the 'coolest' city in Texas with an average summer temperature of 73 degrees. [11]
| Climate data for Hereford, Texas | |||||||||||||
|---|---|---|---|---|---|---|---|---|---|---|---|---|---|
| Month | Jan | Feb | Mar | Apr | May | Jun | Jul | Aug | Sep | Oct | Nov | Dec | Year |
| Record high °F (°C) | 84 (29) |
83 (28) |
98 (37) |
98 (37) |
103 (39) |
111 (44) |
107 (42) |
105 (41) |
102 (39) |
97 (36) |
87 (31) |
80 (27) |
111 (44) |
| Average high °F (°C) | 49.8 (9.9) |
55.1 (12.8) |
63.6 (17.6) |
72.0 (22.2) |
80.2 (26.8) |
88.9 (31.6) |
91.6 (33.1) |
89.3 (31.8) |
82.6 (28.1) |
72.9 (22.7) |
59.7 (15.4) |
50.6 (10.3) |
71.4 (21.9) |
| Average low °F (°C) | 21.1 (−6.1) |
24.6 (−4.1) |
30.9 (−0.6) |
39.4 (4.1) |
49.7 (9.8) |
59.1 (15.1) |
63.5 (17.5) |
61.2 (16.2) |
54.3 (12.4) |
42.5 (5.8) |
30.1 (−1.1) |
22.6 (−5.2) |
41.7 (5.4) |
| Record low °F (°C) | −15 (−26) |
−17 (−27) |
1 (−17) |
14 (−10) |
16 (−9) |
40 (4) |
51 (11) |
40 (4) |
31 (−1) |
15 (−9) |
0 (−18) |
−12 (−24) |
−17 (−27) |
| Average precipitation inches (mm) | 0.50 (12.7) |
0.50 (12.7) |
0.98 (24.9) |
1.02 (25.9) |
2.12 (53.8) |
2.90 (73.7) |
2.06 (52.3) |
3.22 (81.8) |
2.25 (57.2) |
1.59 (40.4) |
0.77 (19.6) |
0.74 (18.8) |
18.65 (473.7) |
| Average snowfall inches (cm) | 4.8 (12.2) |
3.0 (7.6) |
1.5 (3.8) |
0.8 (2) |
0 (0) |
0 (0) |
0 (0) |
0 (0) |
0 (0) |
0.3 (0.8) |
1.7 (4.3) |
4.8 (12.2) |
16.9 (42.9) |
| Average precipitation days | 3.0 | 3.4 | 4.2 | 4.7 | 6.8 | 7.4 | 6.4 | 7.7 | 6.0 | 4.7 | 3.5 | 3.8 | 61.6 |
| Average snowy days | 1.9 | 1.6 | 0.8 | 0.4 | 0 | 0 | 0 | 0 | 0 | 0.1 | 0.8 | 2.0 | 7.6 |
| Source #1: The Weather Channel [12] | |||||||||||||
| Source #2: NOAA [13] | |||||||||||||
Demographics
| Historical population | |||
|---|---|---|---|
| Census | Pop. | %± | |
| 1900 | 532 | — | |
| 1910 | 1,750 | 228.9% | |
| 1920 | 1,696 | −3.1% | |
| 1930 | 2,458 | 44.9% | |
| 1940 | 2,584 | 5.1% | |
| 1950 | 5,207 | 101.5% | |
| 1960 | 6,752 | 29.7% | |
| 1970 | 13,414 | 98.7% | |
| 1980 | 15,853 | 18.2% | |
| 1990 | 14,745 | −7.0% | |
| 2000 | 14,597 | −1.0% | |
| 2010 | 15,370 | 5.3% | |
| Est. 2015 | 15,021 | [14] | −2.3% |
As of the census[1] of 2000, 14,597 people, 4,839 households, and 3,730 families resided in the city. The population density was 2,600.8 people per square mile (1,004.6/km²). There were 5,323 housing units at an average density of 948.4 per square mile (366.3/km²). The racial makeup of the city was 69.86% White, 1.76% African American, 0.82% Native American, 0.26% Asian, 0.12% Pacific Islander, 24.77% from other races, and 2.41% from two or more races. Hispanics or Latinos of any race were 61.37% of the population.
Of the 4,839 households, 42.2% had children under the age of 18 living with them, 58.4% were married couples living together, 14.4% had a female householder with no husband present, and 22.9% were not families. About 20.7% of all households were made up of individuals, and 11.3% had someone living alone who was 65 years of age or older. The average household size was 2.96 and the average family size was 3.44.
In the city, the population was distributed as 34.0% under the age of 18, 9.9% from 18 to 24, 25.6% from 25 to 44, 18.1% from 45 to 64, and 12.4% who were 65 years of age or older. The median age was 30 years. For every 100 females, there were 92.7 males. For every 100 females age 18 and over, there were 87.7 males.
The median income for a household in the city was $29,599, and for a family was $33,387. Males had a median income of $26,488 versus $18,920 for females. The per capita income for the city was $12,787. About 19.4% of families and 20.2% of the population were below the poverty line, including 25.9% of those under age 18 and 15.8% of those age 65 or over.
Education
The first public school was opened in 1900.[16] Today, Hereford's seven public schools serve around 4,000 students and are directed by the Hereford Independent School District.[17]
Notable people
- Ron Ely, best remembered for his role as Tarzan on an NBC television series in the middle 1960s, was born in Hereford in 1938.
- Jesse Frank Ford, a nutritionist, began Arrowhead Mills, a health-food company in Hereford in 1960. The company seeks to produce corn and wheat without the use of pesticides.
- Clint Formby (1923–2010), radio broadcaster at KPAN AM&FM in Hereford since 1955, had the longest running one-person program in radio history. The station was begun in 1948 by his uncle, Marshall Formby, a former state senator and highway commissioner from West Texas. Clint Formby's wife, Margaret Clark Formby (1929–2003), founded the National Cowgirl Museum and Hall of Fame in Hereford and relocated it to the larger tourist market in Fort Worth.
- Edgar Mitchell (1930-2016) was an American pilot and astronaut who was born in Hereford in 1930. As the lunar module pilot of Apollo 14, he spent 9 hours of February 9, 1971, moon-walking on the Fra Mauro formation, making him the sixth man to walk on the Moon.
Gallery
 Downtown Hereford, with the grain elevator to the rear
 Hereford City Hall
 First Bank Southwest in Hereford
 St. Anthony's Roman Catholic Church in Hereford is located off U.S. Highway 385.
 Swimming in Hereford
 Hereford train depot
 Hereford Brand newspaper office
 The former Mills Ranch Western Store, once a fixture of downtown Hereford
References
- 1 2 "American FactFinder". United States Census Bureau. Retrieved 2008-01-31.
- ↑ "US Board on Geographic Names". United States Geological Survey. 2007-10-25. Retrieved 2008-01-31.
- ↑ http://www.texastripper.com/pronounce/locations-h-i.html
- 1 2 "Geographic Identifiers: 2010 Demographic Profile Data (G001): Hereford city, Texas". American Factfinder. U.S. Census Bureau. Retrieved January 7, 2016.
- ↑ "Find a County". National Association of Counties. Retrieved 2011-06-07.
- ↑ Spotlight on CRC Member: Deaf Smith Electric Cooperative. Cooperative Response Center.
- ↑ Daniel DeMay (December 17, 2015). "The most liberal and most conservative cities in the US". Bridgeport, Connecticut: The Connecticut Post. Retrieved December 20, 2015.
- ↑ "Hereford, TX".
- ↑ "US Gazetteer files: 2010, 2000, and 1990". United States Census Bureau. 2011-02-12. Retrieved 2011-04-23.
- ↑ M. Kottek; J. Grieser; C. Beck; B. Rudolf; F. Rubel (2006). "World Map of the Köppen-Geiger climate classification updated" (GIF). Meteorol. Z. 15: 259–263. doi:10.1127/0941-2948/2006/0130. Retrieved August 26, 2009.
- ↑ http://www.movoto.com/tx/best-places-in-texas/
- ↑ "Monthly Averages for Hereford, TX". The Weather Channel. Retrieved June 29, 2010.
- ↑ "NCDC: Climatography of the United States, No. 20, 1971–2000: Hereford, Texas" (PDF). National Oceanic and Atmospheric Administration. Retrieved June 29, 2010.
- ↑ "Annual Estimates of the Resident Population for Incorporated Places: April 1, 2010 to July 1, 2015". Retrieved July 2, 2016.
- ↑ "Census of Population and Housing". Census.gov. Retrieved June 4, 2015.
- ↑ The Handbook of Texas Online, retrieved 2009-12-30
- ↑ Hereford ISD, retrieved 2009-12-30
External links
- City of Hereford official website
- Historic photographs of Hereford from the Deaf Smith County Library hosted by the Portal to Texas History
Municipalities and communities of Deaf Smith County, Texas, United States | ||
|---|---|---|
| City | 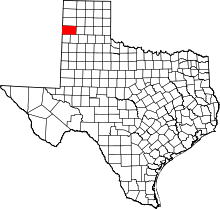 | |
| Unincorporated communities | ||
| Footnotes | ‡This populated place also extends into New Mexico | |
