Hercules–Corona Borealis Great Wall
| Hercules–Corona Borealis Great Wall | |
|---|---|
|
A giant Hubble mosaic of the massive galaxy cluster MACS J0717.5+3745 using a combination of 18 images. The significant amount of dark matter in this cluster, shown in light blue, may be also similar to the Hercules–Corona Borealis Great Wall. Credit: Hubble Space Telescope | |
| Observation data (Epoch J2000) | |
| Constellation(s) | Hercules, Corona Borealis, Lyra, Boötes and Draco[1] |
| Right ascension | 17h 0m |
| Declination | +27° 45′ |
| Major axis | 3 Gpc (10 Gly)[2][3] |
| Minor axis |
2.2 Gpc (7 Gly) h−1 0.6780 |
| Redshift | 1.6 to 2.1[2][3] |
| Distance (co-moving) |
9.612 to 10.538 billion light-years (light travel distance)[4] 15.049 to 17.675 billion light-years (present comoving distance)[4] |
| Binding mass | 2×10¹⁹ M☉ |
| See also: Galaxy groups, Galaxy clusters, List of superclusters | |

Hercules–Corona Borealis Great Wall[1][5] or the Great GRB Wall[6] is a massive galactic superstructure in a region of the sky seen in the data set mapping of gamma-ray bursts (GRBs) that has been found to have an unusually higher concentration of similarly distanced GRBs than the expected average distribution.[2][3] It was discovered in early November 2013 by a team of American and Hungarian astronomers led by Istvan Horvath, Jon Hakkila and Zsolt Bagoly while analyzing data from the Swift Gamma-Ray Burst Mission, together with other data from ground-based telescopes.[2][3] At the time of discovery, it was the largest formation known in the universe, exceeding the size of the prior Huge-LQG by about two times.[7]
The overdensity lies at the Second, Third and Fourth Galactic Quadrants (NQ2, NQ3 and NQ4) of the sky. Thus, it lies in the Northern Hemisphere, centered on the border of the constellations Draco and Hercules. The entire clustering consists of around 19 GRBs with the redshift ranges between 1.6 and 2.1.[3]
Typically, the distribution of GRBs in the universe appears in the sets of less than the 2σ distribution, or with less than two GRBs in the average data of the point-radius system. Thus, such a concentration as this appears extremely unlikely, given accepted theoretical models. Possible explanations of the concentration exist, including the so-called Hercules–Corona Borealis Great Wall.[8][9] This would be an extremely huge structure of the universe, with a mean size in excess of 2 billion to 3 billion parsecs (6 to 10 billion light-years).[5] Such a supercluster can explain the significant distribution of GRBs because of its tie to star formation. If such a structure did exist, it would be the largest known structure in the observable universe.
The Hercules–Corona Borealis Great Wall contains many billions of galaxies, depending on how they are counted.[10]
Discovery
The overdensity was discovered by several astronomers from United States and Hungary led by I. Horvath, J. Hakkila and Z. Bagoly.[2][11] They used data from different space telescopes operating at gamma-ray and X-ray wavelengths, plus some data from ground-based telescopes. By the end of 2012 they successfully recorded 283 GRBs and measured their redshifts spectroscopically. They subdivided them to different group subsamples of different redshifts, initially with five groups, six groups, seven groups and eight groups, but each group division in the tests suggest a weak anisotropy and concentration, but this is not the case when it is subdivided to nine groups, each containing 31 GRBs; they noticed a significant clustering of GRBs of the fourth subsample (z = 1.6 to 2.1) with 19 of the 31 GRBs of the subsample are concentrated within the vicinity of the Second, Third and Fourth Northern Galactic Quadrants (NQ2, NQ3 and NQ4) spanning no less than 120 degrees of the sky.[2][11] Under current stellar evolutionary models GRBs are only caused by neutron star collision and collapse of massive stars, and as such, stars causing these events are only found in regions with more matter in general. Using the two-point Kolmogorov-Smirnov test, a nearest-neighbor test, and a Bootstrap point radius method, they found the statistical significance of this observation to be less than 0.05%. The possible binomial probability to find a clustering was p=0.0000055. It is later reported in the paper that the clustering may be associated with a previously unknown supermassive structure.[2]
Nomenclature
The authors of the paper concluded a structure that was the possible explanation of the clustering, but they never associated any name with it.[12] Hakkila stated that "During the process, we were more concerned with whether it was real or not."[12] The term "Hercules–Corona Borealis Great Wall" was coined by a Filipino teenager from Marikina City in the website Wikipedia,[12][13] after reading a Discovery News report[14] three weeks after the structure's discovery. The nomenclature was used by Jacqueline Howard, on her "Talk Nerdy to Me" video series,[15] and Hakkila would later use the name.[1]
The term is misleading, since the clustering occupies a region much larger than the constellations Hercules and Corona Borealis. In fact, it covers the region from Boötes to as far as the Zodiac constellation Gemini. In addition, the clustering is somewhat roundish in shape, which is more likely a supercluster, in contrast to an elongated shape of a galaxy wall. Another name, Great GRB Wall, was proposed in a later paper.[6]
Characteristics
The paper states that "14 of the 31 GRBs are concentrated within 45 degrees of the sky",[3] which translates to the size of about 10 billion light-years (about 3 billion parsecs) in its longest dimension, which is approximately 1/9 (10.7%) of the diameter of the observable universe. However, the clustering contains 19 to 22 GRBs, and spans a length three times longer than the rest 14 GRBs. Indeed, the clustering crosses over 20 constellations and covers 125 degrees of the sky, or almost 15,000 square degrees in total area, which translates to about 18 to 23 billion light-years (5.5 to 7 billion parsecs) in length. It lies at redshift 1.6 to 2.1.
Methods for discovery
The team subdivides the 283 GRBs to nine groups in sets of 31 GRBs. At least three different methods have been used to reveal the significance of the clustering
Two-dimensional Kolmogorov-Smirnov Test
The Kolmogorov-Smirnov test (K-S test) is a nonparametric test of the equality of continuous, one-dimensional probability distributions that can be used to compare a sample with a reference probability distribution (one-sample K–S test), or to compare two samples (two-sample K–S test), thus, it can be used to test the comparisons of the distributions of the nine subsamples. However, the K-S test can only be used for one dimensional data only; it cannot be used for sets of data involving two dimensions such as the clustering. However, a 1983 paper by J.A. Peacock suggests that one should use all four possible orderings between ordered pairs to calculate the difference between the two distributions. Since the sky distribution of any object is composed of two orthogonal angular coordinates, the team used this methodology.[3]
| Group no. | 2 | 3 | 4 | 5 | 6 | 7 | 8 | 9 |
|---|---|---|---|---|---|---|---|---|
| 1 | 9 | 9 | 15 | 11 | 13 | 9 | 12 | 8 |
| 2 | 10 | 18 | 7 | 15 | 11 | 9 | 12 | |
| 3 | 14 | 9 | 11 | 14 | 9 | 10 | ||
| 4 | 15 | 10 | 15 | 17 | 11 | |||
| 5 | 13 | 13 | 8 | 10 | ||||
| 6 | 10 | 13 | 8 | |||||
| 7 | 10 | 10 | ||||||
| 8 | 11 |
Above: Results of the 2D K-S test of the nine GRB subsamples. The table shows the comparison, example, the difference between group 1 and group 2 is 9 points. Values greater than 2σ (significant values equal to or greater than 14) are italicized and colored in yellow background. Note the six significant values in group 4.
The results of the test shows that out of the six largest numbers, five belong to group 4. Six of the eight numerical comparisons of group 4 belong to the eight largest numerical differences, that is, numbers greater than 14. To calculate the approximate probabilities for the different numbers, the team ran 40 thousand simulations where 31 random points are compared with 31 other random points. The result contains the number 18 twenty-eight times and numbers larger than 18 ten times, so the probability of having numbers larger than 17 is 0.095%. The probability of having numbers larger than 16 is p= 0.0029, of having numbers larger than 15 is p= 0.0094, and of having numbers larger than 14 is p=0.0246. For a random distribution, this means that numbers larger than 14 correspond to 2σ deviations and numbers larger than 16 correspond to 3σ deviations. The probability of having numbers larger than 13 is p=0.057, or 5.7%, which is not statistically significant.[3]
Nearest-neighbor test
Using a nearest neighbor statistics, a similar test to the 2D K-S test, 21 consecutive probabilities in group 4 reach the 2σ limit and 9 consecutive comparisons reach the 3σ limit. One can calculate binomial probabilities. For example, 14 out of the 31 GRBs in this redshift band are concentrated in approximately 1/8 of the sky. The binomial probability of finding this deviation is p=0.0000055.
Bootstrap point-radius
The team also used a statistic to determine the number of GRBs within a preferred angular area of the sky. The test shows that the 15-25 % of the sky identified for group 4 contains significantly more GRBs than similar circles at other GRB redshifts. When the area is chosen to be 0.1125 × 4π, 14 GRBs out of the 31 lie inside the circle. When the area is chosen to be 0.2125×4π, 19 GRBs out of the 31 lie inside the circle. When the area is chosen to be 0.225 × 4π, 20 GRBs out of the 31 lie inside the circle. In this last case only 7 out of the 4000 bootstrap cases had 20 or more GRBs inside the circle. This result is, therefore, a statistically significant (p=0.0018) deviation (the binomial probability for this being random is less than 10−6). The team built statistics for this test by repeating the process a large number of times (ten thousand). From the ten thousand Monte Carlo runs they selected the largest number of bursts found within the angular circle. Results show that only 7 out of the 4000 bootstrap cases have 20 GRBs in a preferred angular circle.
Explanations for the clustering
Supercluster model
The current most plausible explanation for the existence of the clustering is a supercluster within the region that shows a high rate of star formation. Since GRBs are linked with massive stars, such stars form only on regions with more matter. Recent papers by Hayes et al.. in 2010 suggest that GRBs peaked at this redshift range, which makes them even better tracers of matter.
Although large superclusters are known in the universe such as our own 520 million-light-year Laniakea Supercluster, a supercluster would have to be exceptionally immense to explain the clustering, perhaps 30 to 50 times larger and 200 times the volume of expected typical superclusters. It would be 10 billion light-years away and about 10 to 18 billion light-years across, and would perhaps be even more improbable to form in the universal large-scale structure than the GRB clustering would be on the gamma-ray sky. The so-called "Hercules–Corona Borealis Great Wall" was proposed as the coincident structure, though this term is actually misleading (see Nomenclature section above).
Sky exposure effects
An explanation of the clustering is that the Swift spacecraft focuses the region of the sky even more frequently than other regions, making the appearance of a clustering. Indeed, anisotropic sampling can be produced when a pointed spacecraft observes some sky directions more often than others, or when the field of view is blocked (e.g. from Earth occultation, avoidance of the Sun to protect instrumentation, or trigger disabling such as over the South Atlantic Anomaly). Each GRB instrument samples the sky differently, which makes the summed sky exposure difficult to identify for the heterogeneous GRB sample that has been observed by many instruments since the late 1990s. Studies show that the region near the ecliptic poles is scanned 1.83 times more frequently than the region near the ecliptic equator. Horvath et al. countered this in their paper.[3] They yielded that the expected numbers of GRBs in each group are 5.41 (best, north), 5.41 (best, south), 8.09 (good, north), 8.09 (good, south), and 4.00 (poor), whereas the actual counts are 11 (best, north), 1 (best, south), 8 (good, north), 6 (good, south), and 6 (poor). This results in a χ2 probability of p = 0.025 that this is due to chance. This probability indicates that more GRBs were detected in the well-sampled northern region and fewer were detected in the well-sampled southern region than were expected owing to sky exposure and extinction effects. The 2.5% probability refers only to the fact that extinction and exposure effects cannot explain the group 4 anisotropy and do not describe the strong clustering of GRBs within the well-sampled northern region. Finally, they noted that the southern ecliptic polar region is devoid of GRBs with redshifts 1.6 to 2.1 which they told is not surprising if the northern clustering is real: if the cluster is real, then the choice of requiring equal GRB counts per radial bin allows to detect group 4 bursts in the cluster at the cost of detecting them elsewhere.
See also
References
- 1 2 3 Horvath, Istvan; Bagoly, Zsolt; Hakkila, Jon; Tóth, L. Viktor (2015). "New data support the existence of the Hercules-Corona Borealis Great Wall". Astronomy & Astrophysics. 584: A48. arXiv:1510.01933
 . Bibcode:2015A&A...584A..48H. doi:10.1051/0004-6361/201424829.
 - 1 2 3 4 5 6 7 Horvath, Istvan; Hakkila, Jon; Bagoly, Zsolt (2014). "Possible structure in the GRB sky distribution at redshift two". Astronomy & Astrophysics. 561: id.L12. arXiv:1401.0533. Bibcode:2014A&A...561L..12H. doi:10.1051/0004-6361/201323020. Retrieved 24 January 2014.
- 1 2 3 4 5 6 7 8 9 Horvath I.; Hakkila J. & Bagoly Z. (2013). "The largest structure of the Universe, defined by Gamma-Ray Bursts". 7th Huntsville Gamma-Ray Burst Symposium, GRB 2013: paper 33 in eConf Proceedings C1304143. 1311: 1104. arXiv:1311.1104. Bibcode:2013arXiv1311.1104H.
- 1 2 "Redshift-distance relation".
- 1 2 Horvath, Istvan; Bagoly, Zsolt; Hakkila, Jon; Tóth, L. Viktor. "Anomalies in the GRB spatial distribution". Proceedings of Science. arXiv:1507.05528. Bibcode:2014styd.confE..78H.
- 1 2 Balazs, L. G.; Bagoly, Z.; Hakkila, J. E.; Horvath, I.; Kobori, J.; Racz, I.; Toth, L. V. (2015). "A giant ring-like structure at 0.78<z<0.86 displayed by GRBs". Monthly Notices of the Royal Astronomical Society. 452 (3): 2236. arXiv:1507.00675. Bibcode:2015MNRAS.452.2236B. doi:10.1093/mnras/stv1421.
- ↑ SciShow Space (21 July 2016). "The Impossibly Huge Quasar Group".
- ↑ Klotz, Irene (2013-11-19). "Universe's Largest Structure is a Cosmic Conundrum". discovery. Retrieved 2013-11-22.
- ↑ "Biggest Thing In The Universe Is So Gigantic It Shouldn't Exist At All". The Huffington Post.
- ↑ "How many galaxies?".
- 1 2 "College of Charleston Professor Makes Discovery of Epic Proportions". The College Today. Ron Mehanca. 15 July 2014. Retrieved 14 November 2014.
- 1 2 3 "Starstruck". College of Charleston Magazine. Mark Berry. 3 November 2014. Retrieved 14 November 2014.
- ↑ "Hercules-Corona Borealis Great Wall". Wikipedia. 22 November 2013. Retrieved 12 January 2016.
- ↑ Klotz, Irene (19 November 2013). "Universe's Largest Structure is a Cosmic Conundrum". Discovery News. Retrieved 12 January 2016.
- ↑ Howard, Jacqueline (27 May 2014). "The Biggest Thing In The Universe Is So Gigantic It Shouldn't Exist At All". The Huffington Post.
2013 in space | ||||||||
|---|---|---|---|---|---|---|---|---|
| Launches | 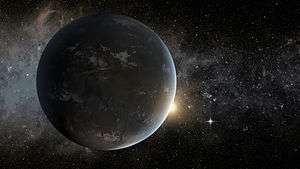   | |||||||
| Impact events | ||||||||
| Novae | ||||||||
| Comets | ||||||||
| NEOs | ||||||||
| Exoplanets |
| |||||||
| Others | ||||||||
| ||||||||