Gruyère District
| Gruyère District District de la Gruyère | ||
|---|---|---|
| District | ||
| ||
 | ||
| Country |
| |
| Canton |
| |
| Capital | Bulle | |
| Area | ||
| • Total | 489.4 km2 (189.0 sq mi) | |
| Population (31 December 2015) | ||
| • Total | 52,540 | |
| • Density | 110/km2 (280/sq mi) | |
| Time zone | CET (UTC+1) | |
| • Summer (DST) | CEST (UTC+2) | |
| Municipalities | 25 | |
| Website | Gruyère | |
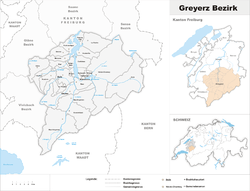
Gruyère (French: District de la Gruyère) is one of seven districts of the canton of Fribourg in Switzerland. It has a population of 52,540 (as of 31 December 2015). Its capital is Bulle.
Municipalities
| Coat of arms | Name | Population (31 December 2015)[1] |
Area (km²)[2] |
|---|---|---|---|
| | Bas-Intyamon | 1,291 | 33.31 |
| | Botterens-Villarbeney | 546 | 4.15 |
| | Broc | 2,506 | 10.04 |
| | Bulle | 21,991 | 23.87 |
| | Châtel-sur-Montsalvens | 274 | 2.04 |
| | Corbières | 839 | 9.6 |
| | Crésuz | 331 | 1.78 |
| | Echarlens | 814 | 4.63 |
| | Grandvillard | 795 | 24.16 |
| | Gruyères | 2,153 | 28.38 |
| | Hauteville | 643 | 10.52 |
| | Haut-Intyamon | 1,523 | 60.45 |
| | Jaun | 662 | 55.21 |
| | La Roche | 1,613 | 24.09 |
| | Le Pâquier | 1,142 | 4.49 |
| | Marsens | 1,809 | 7.81 |
| | Morlon | 592 | 2.48 |
| | Pont-en-Ogoz | 1,775 | 10.02 |
| | Pont-la-Ville | 590 | 4.32 |
| | Riaz | 2,376 | 7.76 |
| | Sâles | 1,447 | 18.79 |
| | Sorens | 1,098 | 8.72 |
| | Val-de-Charmey | 2,416 | 112.15 |
| | Vaulruz | 1,032 | 10.16 |
| | Vuadens | 2,282 | 10.44 |
| Total | 52,540 | 489.4 | |
Mergers and name changes
- On 26 January 1970 the former municipalities of Pont-en-Ogoz and Villars-d'Avry merged to form the new municipality of Le Bry.
- On 1 January 2001 the former municipalities of Maules, Rueyres-Treyfayes, Romanens and Sâles (Gruyère) merged to form the new municipality of Sâles. The former municipality of Vuippens merged into Marsens
- On 1 January 2002 the former municipalities of Albeuve, Montbovon, Neirivue and Lessoc merged to form the new municipality of Haut-Intyamon.
- On 1 January 2003 the former municipalities of Avry-devant-Pont, Gumefens and Le Bry merged to form the new municipality of Pont-en-Ogoz.
- On 1 January 2004 the former municipalities of Villars-sous-Mont, Estavannens and Enney merged to form the new municipality of Bas-Intyamon.
- On 1 January 2006 the former municipality of Villarbeney merged into Botterens, the municipality of Bulle and La Tour-de-Trême merged into the municipality of Bulle.
- On 1 January 2011 the former municipality of Villarvolard merged into Corbières.[3]
- On 1 January 2014 the former municipalities of Cerniat and Charmey merged into the new municipality of Val-de-Charmey.[3]
Coat of arms
The blazon of the district coat of arms is Gules, a Crane rising Argent.[4]
Demographics
Gruyère has a population (as of December 2015) of 52,540.[5] Most of the population (as of 2000) speaks French (33,578 or 88.2%) as their first language, German is the second most common (1,929 or 5.1%) and Portuguese is the third (939 or 2.5%). There are 247 people who speak Italian and 11 people who speak Romansh.[6]
As of 2008, the population was 49.5% male and 50.5% female. The population was made up of 17,510 Swiss men (38.5% of the population) and 5,010 (11.0%) non-Swiss men. There were 18,688 Swiss women (41.1%) and 4,294 (9.4%) non-Swiss women.[7] Of the population in the district, 12,654 or about 33.2% were born in Gruyère and lived there in 2000. There were 13,900 or 36.5% who were born in the same canton, while 4,300 or 11.3% were born somewhere else in Switzerland, and 5,784 or 15.2% were born outside of Switzerland.[6]
As of 2000, there were 16,301 people who were single and never married in the district. There were 17,680 married individuals, 2,347 widows or widowers and 1,742 individuals who are divorced.[6]
There were 4,549 households that consist of only one person and 1,272 households with five or more people.
The historical population is given in the following chart:[8]

Politics
In the 2011 federal election the most popular party was the SP which received 27.5% of the vote. The next three most popular parties were the SVP (22.0%), the CVP (20.3%) and the FDP (15.6%).[9]
The SPS improved their position in Gruyère rising to first, from second in 2007 (with 22.5%) The SVP moved from third in 2007 (with 22.0%) to second in 2011, the CVP moved from first in 2007 (with 28.9%) to third and the FDP retained about the same popularity (16.5% in 2007). A total of 14,036 votes were cast in this election, of which 277 or 2.0% were invalid.[10]
Religion
From the 2000 census, 30,742 or 80.8% were Roman Catholic, while 2,044 or 5.4% belonged to the Swiss Reformed Church. Of the rest of the population, there were 151 members of an Orthodox church (or about 0.40% of the population), there were 22 individuals (or about 0.06% of the population) who belonged to the Christian Catholic Church, and there were 592 individuals (or about 1.56% of the population) who belonged to another Christian church. There were 14 individuals (or about 0.04% of the population) who were Jewish, and 1,223 (or about 3.21% of the population) who were Islamic. There were 92 individuals who were Buddhist, 21 individuals who were Hindu and 29 individuals who belonged to another church. 1,892 (or about 4.97% of the population) belonged to no church, are agnostic or atheist, and 1,527 individuals (or about 4.01% of the population) did not answer the question.[6]
Education
In Gruyère about 11,416 or (30.0%) of the population have completed non-mandatory upper secondary education, and 3,608 or (9.5%) have completed additional higher education (either university or a Fachhochschule). Of the 3,608 who completed tertiary schooling, 59.7% were Swiss men, 25.0% were Swiss women, 9.2% were non-Swiss men and 6.1% were non-Swiss women.[6]
The Canton of Fribourg school system provides one year of non-obligatory Kindergarten, followed by six years of Primary school. This is followed by three years of obligatory lower Secondary school where the students are separated according to ability and aptitude. Following the lower Secondary students may attend a three or four year optional upper Secondary school. The upper Secondary school is divided into gymnasium (university preparatory) and vocational programs. After they finish the upper Secondary program, students may choose to attend a Tertiary school or continue their apprenticeship.[11]
During the 2010-11 school year, there were a total of 9,029 students attending 485 classes in Gruyère. A total of 8,273 students from the district attended any school, either in the district or outside of it. There were 40 kindergarten classes with a total of 706 students in the district. The district had 171 primary classes and 3,429 students. During the same year, there were 90 lower secondary classes with a total of 1,739 students. There were 81 vocational upper Secondary classes and were 52 upper Secondary classes, with 978 upper Secondary students and 1,169 vocational upper Secondary students The district had 23 specialized Tertiary classes and there were 28 non-university Tertiary classes, with 838 non-university Tertiary students and 170 specialized Tertiary students.[7]
See also
References
- ↑ Swiss Federal Statistical Office - STAT-TAB, online database – Ständige und nichtständige Wohnbevölkerung nach institutionellen Gliederungen, Geburtsort und Staatsangehörigkeit (German) accessed 30 August 2016
- ↑ Arealstatistik Standard - Gemeindedaten nach 4 Hauptbereichen
- 1 2 Nomenklaturen – Amtliches Gemeindeverzeichnis der Schweiz (German) accessed 4 April 2011
- ↑ Flags of the World.com accessed 17-November-2011
- ↑ Swiss Federal Statistical Office - STAT-TAB, online database – Ständige und nichtständige Wohnbevölkerung nach institutionellen Gliederungen, Geburtsort und Staatsangehörigkeit (German) accessed 30 August 2016
- 1 2 3 4 5 STAT-TAB Datenwürfel für Thema 40.3 - 2000 (German) accessed 2 February 2011
- 1 2 Canton of Fribourg Statistics (German) accessed 3 November 2011
- ↑ Swiss Federal Statistical Office STAT-TAB Bevölkerungsentwicklung nach Region, 1850-2000 (German) accessed 29 January 2011
- ↑ Canton of Fribourg National Council Election of 23 October 2011 Statistics (German) (French) accessed 3 November 2011
- ↑ Swiss Federal Statistical Office, Nationalratswahlen 2007: Stärke der Parteien und Wahlbeteiligung, nach Gemeinden/Bezirk/Canton (German) accessed 28 May 2010
- ↑ Chart of the education system in Canton Fribourg (German)
Coordinates: 46°36′27″N 7°06′26″E / 46.60750°N 7.10722°E