Great Recession in the Americas
| Great Recession |
|---|
North America was one of the focal points of the global, Great Recession. While Canada has managed to return its economy nearly to the levels it enjoyed prior to the recession,[1] the United States and Mexico are still under the influence of the worldwide economic slowdown. The cost of staple items dropped dramatically in the United States as a result of the recession.
North America
U.S.
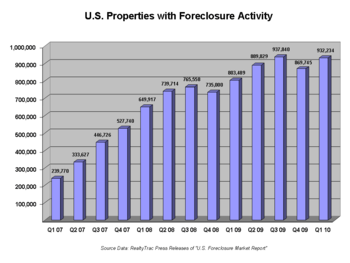
The United States entered 2008 during a housing market correction, a subprime mortgage crisis and a declining dollar value.[2] In February, 63,000 jobs were lost,[3] a 5-year record.[4] In September, 159,000 jobs were lost, bringing the monthly average to 84,000 per month from January to September 2008.[5]
| Federal reserve rates changes[6] | |||||
| Date | Discount rate | Discount rate | Discount rate | Fed funds | Fed funds rate |
|---|---|---|---|---|---|
| Primary | Secondary | ||||
| rate change | new interest rate | new interest rate | rate change | new interest rate | |
| Apr 30, 2008 | -.25% | 2.25% | 2.75% | -.25% | 2.00% |
| Mar 18, 2008 | -.75% | 2.50% | 3.00% | -.75% | 2.25% |
| Mar 16, 2008 | -.25% | 3.25% | 3.75% | ||
| Jan 30, 2008 | -.50% | 3.50% | 4.00% | -.50% | 3.00% |
| Jan 22, 2008 | -.75% | 4.00% | 4.50% | -.75% | 3.50% |
Canada
Canada was one of the last industrialized nations to enter into a downturn. GDP growth was negative in Q1, but positive in Q2 and Q3 of 2008. The recession officially started in Q4. The almost 1-year delay of the start of the recession in Canada relative to the U.S. is largely explained by two factors. First, Canada has a strong banking sector[7] not weighed-down by the same degree of consumer-related debt issues that existed in the United States.[8] The United States economy collapsed from within, while the Canadian economy was being hurt by its trade relationship with the United States. Second, commodity prices continued to rise through to June 2008, supporting a key component of the Canadian economy and delaying the start of recession. In early December 2008, the Bank of Canada, in announcing that it was lowering its central bank interest rate to the lowest level since 1958, also declared that Canada's economy was entering in recession.[9] The Bank of Canada has since announced that it has two consecutive months of GDP decline (Oct -0.1% & Nov -0.7%). The country's unemployment rate could rise to 7.5% in the next two years, according to the latest OECD report.[10]
On July 23, 2009, the Bank of Canada officially declared the recession to be over in Canada.[11] However, the true economic recovery did not begin until November 30, 2009.[12] The Canadian economy would expand at an annualized rate of 6.1% in the first quarter (January–April) of 2010, surpassing analyst expectations and marking the best growth rate since 1999.[13] Economists had expected annualized GDP growth of 5.9% in the last quarter, up from 5% in last year's fourth quarter (September–December 2009).[13] The growth in the first quarter is the third straight quarter of economic expansion in Canada, coming on the heels of three consecutive quarters of contraction.[13] March growth came in at 0.6%, ahead of the 0.5% estimate.[13] 215,900 new jobs have been created in the winter and early spring months of 2010 alone - in the traditional period of time where the Canadian economy is at its most stagnant.
Even with the steps taken to create jobs in the Canadian economy, its recovery remains fragile[14] and job cuts can still be seen in areas that specialize in manual labour.
Canada was also in a recession during the first two quarters of 2015 average both a decline of 0.1 percent of GDP.[15]
Mexico
Despite the solid financial system of Mexico, the effects of the financial crisis originated in the United States impacted Mexico's export sector by a significant amount considering that 85% of the country's exports go to the United States.[16] Reduced demand, the highest unemployment rate in almost a decade and the depreciation of the Mexican peso caused analysts to revise growth estimates officially from 1.8% to somewhere closer to 0% for 2008.[17][18]
The recession did not show up until 2009, but the recession already slowed down in 2008. The country had a positive growth of 1.5% in 2008 compared to a 3.3% in 2007, by 2009 the economy had shrunk by 6.5%, a percentage bigger than that of the 1994-1995 crisis[19] and the largest in almost eight decades and registering an inflation of 3.57%[20]
Economic recovery from the historic downturn started in the late 2009 with exports rising 22.8 percent.[21] The economic prospects for 2010 in the early 2009 were of a positive growth of 3.5 [22] and some saw a steady recovery by the second quarter of 2010.[23] At the end of 2010, the OECD revealed an estimated growth of 4.5 percent[24] while the Mexican government estimated a growth of over 5 percent[25] and the creation of 730 thousand jobs.[26]
The estimated growth for 2011 range from 3.9 to 4.8.[27] Despite the sustained growth in 2010, it was not enough to cover up the loss of 2009.
South America
As it mainly consists of commodity exporters, South America was not directly affected by the financial turmoil, even if the bond markets of Brazil, Argentina, Colombia and Venezuela have been hit.[28]
On the other hand, the continent experienced a tough agricultural crisis at the beginning of 2008.[29] Food prices have increased a lot, due to a lack of arable land. One of the main reasons for the loss of agricultural land was the high value offered by the production of biofuels. Food prices, rising since 2002, ascended from 2006, reaching a peak during the first quarter of 2008. In one year the average price of food rose by about 50%.
Then South American countries were affected by both the global slowdown and the decrease in food prices due to the declining demand.[30] In June 2008, the Economic Commission for Latin America and the Caribbean (ECLAC) declared it expected a 4% growth for 2009. However at the end of the year it predicted that the year 2009 would put an end to six years of prosperity during which Latin America has benefited from high raw materials prices.[31] Production in the region is likely to decline and unemployment to increase.[32][33] However, the Center for Economic and Policy Research has estimated that the region may be able to cope with the global downturn with the right macro-economic policies, as these countries no longer depend on the U.S. economy.[34]
Timeline of the Great Recession across all continents
The table below displays all national recessions appearing in 2006-2013 (for the 71 countries with available data), according to the common recession definition, saying that a recession occurred whenever seasonally adjusted real GDP contracts quarter on quarter, through minimum two consecutive quarters. Only 11 out of the 71 listed countries with quarterly GDP data (Poland, Slovakia, Moldova, India, China, South Korea, Indonesia, Australia, Uruguay, Colombia and Bolivia) escaped a recession in this time period.
The few recessions appearing early in 2006-07 are commonly never associated to be part of the Great Recession, which is illustrated by the fact that only two countries (Iceland and Jamaica) were in recession in Q4-2007.
One year before the maximum, in Q1-2008, only six countries were in recession (Iceland, Sweden, Finland, Ireland, Portugal and New Zealand). The number of countries in recession was 25 in Q2‑2008, 39 in Q3‑2008 and 53 in Q4‑2008. At the steepest part of the Great Recession in Q1‑2009, a total of 59 out of 71 countries were simultaneously in recession. The number of countries in recession was 37 in Q2‑2009, 13 in Q3‑2009 and 11 in Q4‑2009. One year after the maximum, in Q1‑2010, only seven countries were in recession (Greece, Croatia, Romania, Iceland, Jamaica, Venezuela and Belize).
The recession data for the overall G20-zone (representing 85% of all GWP), depict that the Great Recession existed as a global recession throughout Q3‑2008 until Q1‑2009.
Subsequent follow-up recessions in 2010‑2013 were confined to Belize, El Salvador, Paraguay, Jamaica, Japan, Taiwan, New Zealand and 24 out of 50 European countries (including Greece). As of October 2014, only five out of the 71 countries with available quarterly data (Cyprus, Italy, Croatia, Belize and El Salvador), were still in ongoing recessions.[35][36] The many follow-up recessions hitting the European countries, are commonly referred to as being direct repercussions of the European sovereign‑debt crisis.
| Country[lower-alpha 1] | Recession period(s) during 2006‑2013[35][36] (measured by quarter-on-quarter changes of seasonally adjusted real GDP, as per the latest revised Q3-2013 data from 10 January 2014)[lower-alpha 2] |
|---|---|
| Albania | Q1-2007 until Q2-2007 (6 months)[37] Q3-2009 until Q4-2009 (6 months)[37] Q4-2011 until Q1-2012 (6 months)[37] |
| Argentina | Q4-2008 until Q2-2009 (9 months) |
| Australia | None |
| Austria | Q2-2008 until Q2-2009 (15 months) Q3-2011 until Q4-2011 (6 months) |
| Belgium | Q3-2008 until Q1-2009 (9 months) Q2-2012 until Q1-2013 (12 months) |
| Belize | Q1-2006 until Q2-2006 (6 months)[38] Q1-2007 until Q3-2007 (9 months)[38] Q4-2008 until Q1-2009 (6 months)[38] Q4-2009 until Q1-2010 (6 months)[38] Q1-2011 until Q2-2011 (6 months)[38] Q2-2013 until Ongoing (6 months)[38] |
| Bolivia | None[39][lower-alpha 3] Q2-2013 until Ongoing (6 months)[46][lower-alpha 4] |
| Estonia | Q3-2008 until Q3-2009 (15 months) Q1-2013 until Q2-2013 (6 months) |
| EU (28 member states) | Q2-2008 until Q2-2009 (15 months) Q4-2011 until Q2-2012 (9 months) Q4-2012 until Q1-2013 (6 months) |
| Eurozone (17 member states) | Q2-2008 until Q2-2009 (15 months) Q4-2011 until Q1-2013 (18 months) |
| Finland | Q1-2008 until Q2-2009 (18 months) Q2-2012 until Q1-2013 (12 months) |
| France | Q2-2008 until Q2-2009 (15 months) Q4-2012 until Q1-2013 (6 months) |
| G20 (43 member states, PPP-weighted GDP)[lower-alpha 5] | Q3-2008 until Q1-2009 (9 months) |
| Germany | Q2-2008 until Q1-2009 (12 months) |
| Greece | Q3-2008 until Q2-2014 (63 months) |
| Hong Kong | Q2-2008 until Q1-2009 (12 months)[48] |
| Hungary | Q1-2007 until Q2-2007 (6 months) Q2-2008 until Q3-2009 (18 months) Q2-2011 until Q3-2011 (6 months) Q1-2012 until Q4-2012 (12 months) |
| Iceland | Q4-2007 until Q2-2008 (9 months) Q4-2008 until Q1-2009 (6 months) Q3-2009 until Q2-2010 (12 months) |
| India | None |
| Indonesia | None |
| Ireland | Q2-2007 until Q3-2007 (6 months) Q1-2008 until Q4-2009 (24 months) |
| Israel | Q4-2008 until Q1-2009 (6 months) |
| Italy | Q2-2008 until Q2-2009 (15 months) Q3-2011 until Q3 2014 (27 months) |
| Jamaica | Q3-2007 until Q4-2007 (6 months)[49] Q3-2008 until Q1-2009 (9 months)[49] Q4-2009 until Q2-2010 (9 months)[49] Q4-2011 until Q1-2012 (6 months)[49] Q4-2012 until Q1-2013 (6 months)[49] |
| Japan | Q2-2008 until Q1-2009 (12 months) Q4-2010 until Q2-2011 (9 months) Q2-2012 until Q3-2012 (6 months) |
| Kazakhstan | Q3-2008 until Q1-2009 (9 months)[50][lower-alpha 6] |
- ↑ 105 out of the 206 sovereign countries in the World, did not publish any quarterly GDP data for the 2006‑2013 period. The following 21 countries were also excluded from the table, due to only publishing unadjusted quarterly real GDP figures with no seasonal adjustment: Armenia, Azerbaijan, Belarus, Brunei, Dominican Republic, Egypt, Georgia, Guatemala, Iran, Jordan, Macao, Montenegro, Morocco, Nicaragua, Nigeria, Palestine, Qatar, Rwanda, Sri Lanka, Trinidad and Tobago, Vietnam.
- 1 2 Only seasonally adjusted qoq-data can be used to accurately determine recession periods. When quarterly change is calculated by comparing quarters with the same quarter of last year, this results only in an aggregated -often delayed- indication, because of being a product of all quarterly changes taking place since the same quarter last year. Currently there is no seasonal adjusted qoq-data available for Greece and Macedonia, which is why the table display the recession intervals for these two countries only based upon the alternative indicative data format.
- ↑ Bolivia had as of January 2014 only published seasonally adjusted real GDP data until Q1-2010, with the statistics office still to publish data for 2010-13.[39]</ref>
cr
iBrazil
|1994-1995 crisis]]<ref>[httQ4-2008 until Q1-2009 (6 months)
/r
>Bulgaria
gest in almost eight decadesQ1-2009 until Q2-2009 (6 months)
-p
nCanada
dos/inflacion/mensual/%7B366Q4-2008 until Q2-2009 (9 months)
oChile
very from the historic downtQ2-2008 until Q1-2009 (12 months)
d2
4China
ract of Mexico's recovery]</None
Th
eColombia
ects for 2010 in the early 2None[40][41]
73
tCosta Rica
ef>[http://excelsior.com.mx/Q2-2008 until Q1-2009 (12 months)[42]
nl
cCroatia
ommodity exporters, South AmQ3-2008 until Q2-2010 (24 months)
Q3-2011 until Q4-2012 (18 months)
Q2-2013 until Ongoing (6 months) si sCyprus 22000/6922832.stm |title= "SQ1-2009 until Q4-2009 (12 months)
Q3-2011 until Q4-2014 (42 months) t Czech Republic ed a tough [[2008 global ricQ4-2008 until Q2-2009 (9 months)
Q4-2011 until Q1-2013 (18 months) 47 /Denmark sl=/prensa/tpl-i/p6f.xsl&basQ3-2008 until Q2-2009 (12 months)
Q3-2011 until Q4-2011 (6 months)
Q4-2012 until Q1-2013 (6 months) a lEcuador lack of arable land. One ofQ4-2006 until Q1-2007 (6 months)[43]
Q1-2009 until Q3-2009 (9 months)[44][45] sp xEl Salvador ias/comunicados/6/34856/P348Q3-2008 until Q2-2009 (12 months)[46][lower-alpha 4] - 1 2 According to the methodology note for the quarterly GDP of El Salvador, this data series include seasonally adjustments.<ref name='Methodology note for the quarterly GDP of El Salvador'>"Boletín Económico: Metodología Producto Interno Bruto Trimestral, Base 1990" (PDF) (in Spanish). Banco Central de Reserva de El Salvador. 27 October 2006.
- ↑ The G20-zone represents 85% of all GWP, and comprise 19 member states (incl. UK, France, Germany and Italy) along with the EU Commission as the 20th member, who represents the remaining 24 EU member states in the forum.[47]
- ↑ Kazakhstan had as of January 2014 only published seasonally adjusted real GDP data until Q4-2009, with the statistics office still to publish data for 2010-13.[50]</ref>
Latvia
Q2-2008 until Q3-2009 (18 months)
Lithuania
Q3-2008 until Q2-2009 (12 months)
Luxembourg
Q2-2008 until Q1-2009 (12 months)
Macedonia
Q1-2009 until Q3-2009 (9 months)[51]
Q1-2012 until Q2-2012 (6 months)[51]
(not qoq-data, but quarters compared with same quarter of last year)[lower-alpha 2] Malaysia Q3-2008 until Q1-2009 (9 months)[52][53] Malta Q4-2008 until Q1-2009 (6 months) Mexico Q3-2008 until Q2-2009 (12 months) Moldova None[54][lower-alpha 7] Venezuela Q1-2009 until Q1-2010 (15 months)<ref name='Venezuela s.a. real GDP 1998-2013'>"AGREGADOS_MACROECONÓMICOS: PIB Desestacionalizado. Base 1997 (Trimestral)" (XLS) (in Spanish). 9 December 2013. - ↑ Moldova had as of January 2014 only published seasonally adjusted real GDP data until Q4-2010, with the statistics office still to publish data for 2011-13.[54]</ref>
Netherlands
Q2-2008 until Q2-2009 (15 months)
Q2-2011 until Q1-2012 (12 months)
Q3-2012 until Q2-2013 (12 months) New Zealand Q1-2008 until Q2-2009 (18 months)
Q3-2010 until Q4-2010 (6 months) Norway Q1-2009 until Q2-2009 (6 months)
Q2-2010 until Q3-2010 (6 months)
Q1-2011 until Q2-2011 (6 months) OECD (34 member states, PPP-weighted GDP) Q2-2008 until Q1-2009 (12 months) Paraguay Q3-2008 until Q1-2009 (9 months)[55]
Q2-2011 until Q3-2011 (6 months)[55] Peru Q4-2008 until Q2-2009 (9 months)[56] Philippines Q4-2008 until Q1-2009 (6 months)[57][58] Poland None Portugal Q2-2007 until Q3-2007 (6 months)
Q1-2008 until Q1-2009 (15 months)
Q4-2010 until Q1-2013 (30 months) Romania Q4-2008 until Q2-2009 (9 months)
Q4-2009 until Q1-2010 (6 months)
Q4-2011 until Q1-2012 (6 months) Russia Q3-2008 until Q2-2009 (12 months) Serbia Q2-2008 until Q2-2009 (15 months)[59]
Q2-2011 until Q1-2012 (12 months)[59]
Q3-2012 until Q4-2012 (6 months)[59] Singapore Q2-2008 until Q1-2009 (12 months)[60][61][62][63][64] Slovakia None Slovenia Q3-2008 until Q2-2009 (12 months)
Q3-2011 until Q4-2013 (24 months)[65][66] South Africa Q4-2008 until Q2-2009 (9 months) South Korea None Spain Q2-2008 until Q4-2009 (21 months)
Q2-2011 until Q2-2013 (27 months) Sweden Q1-2008 until Q1-2009 (15 months) Switzerland Q4-2008 until Q2-2009 (9 months) Taiwan Q2-2008 until Q1-2009 (12 months)[67]
Q3-2011 until Q4-2011 (6 months)[67] Thailand Q4-2008 until Q1-2009 (6 months)[68] Turkey Q2-2008 until Q1-2009 (12 months) Ukraine Q2-2008 until Q1-2009 (12 months)[69]
Q3-2012 until Q4-2012 (6 months)[69][70][71] United Kingdom Q2-2008 until Q2-2009 (15 months)[72] United States Q3-2008 until Q2-2009 (12 months) Uruguay None<ref name='Uruguay s.a. real GDP 2005-2013'>"Informe Trimestral de Cuentas Nacionales: Julio – Setiembre 2013" (PDF) (in Spanish). Banco Central del Uruguay. 13 December 2013.
See also
References
- ↑ Canada's Economy Takes a Break
- ↑ "dollar hits record low against euro, oil prices rally". Retrieved 6 February 2009.
- ↑ Employment Situation Summary BLS
- ↑ Aversa, Jeannine, "Employers Slash 63,000 Jobs in February, Most in 5 years, Feeding Recession Fears,", Associated Press, March 7, 2008. Accessed July 11, 2008.
- ↑ CJJ Staff, "Massive Job Cuts Across the Country", accessed October 6, 2008
- ↑ "Historical Changes of the Target Federal Funds and Discount Rates". Federal Reserve Bank of New York. 2008-12-22. Archived from the original on 21 December 2008. Retrieved 2009-01-04.
- ↑ "Canadian banks are the soundest in the world: report". Retrieved 2008-10-09.
- ↑ RBC 2008 Investor Day, Royal Bank of Canada, URL accessed 28 December 2008
- ↑ "Canada 'entering a recession,' central bank slashes key rate to 1.5 per cent". OTTAWA: The Canadian Press. 2008-12-09. Archived from the original on 17 December 2008. Retrieved 2009-01-04.
- ↑ Canada's jobless rate could hit 7.5 per cent: OECD, CTV.ca, November 25, 2008
- ↑ Bank declares recession over, The Toronto Star, July 23, 2009
- ↑ Gross domestic product sees first gain in a year this quarter
- 1 2 3 4 Canadian economic growth best in 10 years - May 31, 2010
- ↑ Tories say economy is top priority
- ↑ 'Technical recession' in Canada, despite strong June: StatsCan
- ↑ US Embassy data
- ↑ Elisabeth Malkin (December 30, 2008). "Mexico's Prudence Fails to Avert a Slowdown". Mexico; United States: NYTimes.com. Retrieved 2009-01-04.
- ↑ New, The (December 29, 2008). "Recession is spreading from U.S. to Mexico's economy". Dallas Morning News. The New York Times. Retrieved 2009-01-04.
- ↑ CIA Factbook Data
- ↑ Bank of Mexico official data '(Spanish)
- ↑ abstract of Mexico's recovery
- ↑ Bank of Mexico (Spanish)
- ↑ Ixe-Banif monthly analysis
- ↑ OECD, 22 0ct 2010 (Spanish)
- ↑ Secretariat of Finance and Public Credit estimate (Spanish)
- ↑ National Institute of Statistic and Geography official data (Spanish)
- ↑ National Bank of Mexico (Banamex-Citi Group) estimate (Spanish)
- ↑ ""Subprime": lejos de A. Latina" (in Spanish). BBC Mundo. August 1, 2007. Retrieved 2010-01-05.
- ↑ Poverty Declines Slightly in Latin America and the Caribbean, in Spite of Global Financial Crisis, ECLAC Notes Nº 59 (9 December 2008)
- ↑ "Latin America risks reverting progress in poverty reduction / Global financial crisis will affect region's trade with the rest of the world" (PDF). ECLAC. December 2008. Retrieved 6 February 2009.
- ↑ "Preliminary overview of the economies of Latin America and the Caribbean 2008". ECLAC. December 2008. Retrieved 6 February 2009.
- ↑ "Growth in Latin America and the Caribbean Is Projected to Be 1.9% in 2009". ECLAC. 18 December 2008. Retrieved 6 February 2009.
- ↑ "Amérique latine : fin de six années de croissance soutenue" (in French). RFI. 2008-12-19. Archived from the original on 1 February 2009. Retrieved 6 February 2009.
- ↑ "South America: Recession Can Be Avoided". CEPR. November 16, 2008. Archived from the original on 18 January 2009. Retrieved 6 February 2009.
- 1 2 "Quarterly National Accounts : Quarterly Growth Rates of real GDP, change over previous quarter". Stats.oecd.org. Retrieved 2013-08-17.
- 1 2 "GDP and main components - volumes: Percentage change on previous quarter (seasonally adjusted, and adjusted by working days)". Eurostat. 10 January 2014. Retrieved 10 January 2014.
- 1 2 3 "Albanian Real growth rate from one quarter to the previous quarter, seasonally adjusted (Qt,i/Qt,i-1), (2005=100)" (XLS). INSTAT. 8 January 2014.
- 1 2 3 4 5 6 "Third Quarter GDP Times Series 2013: Gross Domestic Product by Activity, Constant 2000 prices – BZ$ million" (XLS). Statistical Institute of Belize. 18 December 2013.
- 1 2 "PRODUCTO INTERNO BRUTO TRIMESTRAL 2010 Primer Trimestre (each chapter is packed into an overall rar file)" (RAR+PDF). PIBtrimestral1r20104.pdf: Capítulo IV (Ajuste Estacional y Extracción de Señales Por Actividad Económica) - Cuadro N° 04.01.02, BOLIVIA: VARIACIÓN CON RELACIÓN AL PERIODO ANTERIOR DE LA DESESTACIONALIZACIÓN DEL PRODUCTO INTERNO BRUTO POR ACTIVIDAD ECONÓMICA SEGÚN, TRIMESTRE, 1991 - 2010 (En porcentaje) (in Spanish). Instituto Nacional de Estadística de Bolivia. 30 July 2010.
- ↑ "Gross Domestic Product (GDP) at 2005 Constant Prices by Area of Economic Activity - Seasonally Adjusted. Quarterly Since 2000: Quarterly Percentage Change" (XLS). Banco de la República, Colombia. 19 September 2013.
- ↑ "GDP by branch of activity: By branches of economic activity at constant prices for 2005 deseasonalized series / 2000-I a 2013-III" (XLS). Departamento Administrativo Nacional de Estadística (DANE). 19 December 2013.
- ↑ "Gross Domestic Product (1991-2013, at 1991 constant prices): Original Series, Trend Cycle and Seasonally Adjusted Series". Banco Central de Costa Rica. 7 January 2014.
- ↑ "Cuentas Nacionales Trimestrales del Ecuador No.65 (Enero 2009)" (PDF). Cuadro No 1: Oferta - Utilizacion de bienes y servicios, variacion trimestral, tasas de t/t-1, dolares constantes de 2000, P.I.B. (in Spanish). Banco Central del Ecuador. 27 January 2009.
- ↑ "Estadisticas Macroecomicas - Presentacion Coyuntural (Diciembre 2012)" (PDF). PRODUCTO INTERNO BRUTO, PIB, (Precios constantes de 2007, datos desestacionalizados, Tasas de variación, Variación t/t-1) (in Spanish). Banco Central del Ecuador. 1 February 2013.
- ↑ "Estadisticas Macroecomicas - Presentacion Coyuntural (Diciembre 2013)" (PDF). PRODUCTO INTERNO BRUTO - PIB, Precios constantes de 2007, Tasas de variación, Variación t/t-1 (in Spanish). Banco Central del Ecuador. 13 December 2013.
- 1 2 "1- Base de Datos Económica-Financiera > IV.7 Producto Interno Bruto Trimestral (PIBt)" (in Spanish). Banco Central de Reserva de El Salvador. 30 December 2013.
- ↑ "G20 Members". G20.org. Retrieved 15 January 2014.
- ↑ "Statistical Table Customization: Seasonally adjusted GDP and selected expenditure components - percentage changes in real terms over the preceding quarter". Census and Statistics Department (Hong Kong). 15 November 2013.
- 1 2 3 4 5 "Jamaican Economic Statistics: National Accounts: Quarterly Rate of Growth of Value Added GDP by Industry at Constant 2007 Prices (Seasonally Adjusted)". Statistical Institute of Jamaica. 31 December 2013.
- 1 2 "GDP by the production method: Basic indexes - GDP allowing for seasonal fluctuations" (DOC). The Agency of Statistics of the Republic of Kazakhstan. 2012.
- 1 2 "Table: Gross Domestic Product by production approach, by NKD Rev.1, by quarters (volume indices, compared to the corresponding period of the previous year, %)". MAK Stat Database. State Statistical Office of the Republic of Macedonia. 13 December 2013.
- ↑ "Gross Domestic Product 2013 second quarter, seasonal adjustment" (PDF). Table 1B: Seasonally Adjusted GDP at constant 2005 prices - Percentage Change from Preceding Quarter. Department of Statistics, Malaysia. 22 August 2013.
- ↑ "Quarterly Gross Domestic Product 2013 third quarter" (PDF). Chart 3 and Table 6B: Seasonally Adjusted GDP at constant 2005 prices - Percentage Change from Preceding Quarter. Department of Statistics, Malaysia. 15 November 2013.
- 1 2 "Databank table: Seasonally adjustments of Gross Domestic Product and of main elements of use, average prices of 2000, 1995-2010". National Bureau Of Statistics of the Rublic Of Moldova. 31 May 2011.
- 1 2 "CUENTAS NACIONALES DE PARAGUAY - TERCER TRIMESTRE 2013" (PDF). Anexo: Tasas de variacion - PIB desestacionalizado (t/t-1) (in Spanish). Banco Central del Paraguay. 20 December 2013.
- ↑ "Informe Técnico - PBI Trimestral Nº 04 Noviembre 2013: Comportamiento de la Economía Peruana en el Tercer Trimestre de 2013" (PDF). Anexo Nº 4: SERIE DESESTACIONALIZADA POR TIPO DE GASTO, 2002_I - 2013_III (Variación porcentual trimestral del Índice de Volumen Físico respecto al trimestre anterior, Valores a precios constantes de 1994) (in Spanish). Instituto Nacional de Estadística e Informática (INEI). 22 November 2013.
- ↑ "3rd Quarter 2013 National Accounts of the Philippines (multiple files packed as a rar file)" (RAR). 3Q2013_SANA_PUB.XLS (page 3): Summary Table 1 - SEASONALLY ADJUSTED NATIONAL ACCOUNTS SERIES at Constant 2000 Prices: Quarter to quarter in million Pesos (First Quarter 1998 to Third Quarter 2013). National Statistical Coordination Board. 28 November 2013.
- ↑ "The seasonally adjusted national accounts of the Philippines (Third Quarter 2013): SEASONALLY ADJUSTED NATIONAL ACCOUNTS SERIES at Constant 2000 Prices: Quarter to quarter growth rates (First Quarter 1998 to Third Quarter 2013)". National Statistical Coordination Board. 28 November 2013.
- 1 2 3 "Quarterly gross domestic product by production approach, at constant prices, seasonally adjusted data, of the Republic of Serbia". Statistical Office of the Republic of Serbia. 31 December 2013.
- ↑ SingStat Time Series (access to database require payment subscription)
- ↑ "Statistical Tables from Economic Survey of Singapore (Fourth Quarter 2008): GDP by Industry at 2000 prices, Seasonally Adjusted" (PDF). Statistics Singapore. 26 February 2009.
- ↑ "Statistical Tables from Economic Survey of Singapore (Fourth Quarter 2010): GDP by Industry at 2005 prices, Seasonally Adjusted" (PDF). Statistics Singapore. 17 February 2011.
- ↑ "Statistical Tables from Economic Survey of Singapore (Third Quarter 2013): GDP by Industry at 2005 prices, Seasonally Adjusted" (PDF). Statistics Singapore. 21 November 2013.
- ↑ "SingStat Table Builder: National Accounts: M013362 - Gross Domestic Product At 2005 Market Prices, By Industry, Quarterly, (SA) (Period on Period)". Statistics Singapore. 21 November 2013.
- ↑ http://www.24ur.com/novice/gospodarstvo/recesije-je-konec-bruselj-nam-napoveduje-rast.html
- ↑ http://www.sloveniatimes.com/light-at-the-end-of-the-tunnel-slovenia-technically-out-of-recession
- 1 2 "Macro database: GDP by Expenditures - Seasonally Adjusted (Quarterly, at 2006 prices, 1981-2013)". National Statistics - Republic of China (Taiwan). 29 November 2013.
- ↑ "Gross Domestic Product 1993 until Q3/2013: Table 6.1 - Gross National Product and GDP at 1988 Prices (Seasonally Adjusted) q-o-q Growth Rate" (XLS). Office of the National Economic and Social Development Board (Thailand). 18 November 2013.
- 1 2 "Quarterly gross domestic product estimates of Ukraine for 2001 – 2012" (PDF). Seasonally Adjustment of gross domestic product at constant prices of 2007 (Table 5.1 - Gross Domestic Product, page 99). State Statistics Service Of Ukraine. 30 August 2013.
- ↑ "ЕКСПРЕС-ВИПУСК: ВАЛОВИЙ ВНУТРІШНІЙ ПРОДУКТ УКРАЇНИ ЗА 1 КВАРТАЛ - 4 КВАРТАЛ 2012 РОКУ - ВАЛОВИЙ ВНУТРІШНІЙ ПРОДУКТ ВИРОБНИЧИМ МЕТОДОМ (RAPID RELEASE: GROSS DOMESTIC PRODUCT OF UKRAINE Q1-Q4 2012 - Gross domestic product production methods)" (Zip PDF) (in Ukrainian). State Statistics Service Of Ukraine. 17 March 2014.
- ↑ "ЕКСПРЕС-ВИПУСК: ВАЛОВИЙ ВНУТРІШНІЙ ПРОДУКТ УКРАЇНИ ЗА 1 КВАРТАЛ - 4 КВАРТАЛ 2013 РОКУ - ВАЛОВИЙ ВНУТРІШНІЙ ПРОДУКТ ВИРОБНИЧИМ МЕТОДОМ (RAPID RELEASE: GROSS DOMESTIC PRODUCT OF UKRAINE Q1-Q4 2013 - Gross domestic product production methods)" (Zip PDF) (in Ukrainian). State Statistics Service Of Ukraine. 11 March 2014.
- ↑ "Gross Domestic Product Quarter on Quarter growth". Office for National Statistics. 1 July 2016.