Glina, Croatia
| Glina | |
|---|---|
| Town | |
|
Glina in Sisak-Moslavina County | |
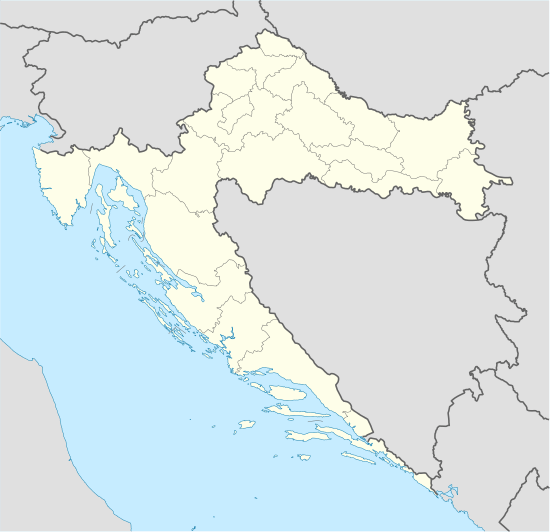 Glina Location of Glina in Croatia | |
| Coordinates: 45°20′N 16°5′E / 45.333°N 16.083°ECoordinates: 45°20′N 16°5′E / 45.333°N 16.083°E | |
| Country |
|
| County |
|
| Government | |
| • Mayor | Stjepan Kostanjević (HDZ) |
| Population (2011)[1] | |
| • Total | 9,283 |
| • City itself | 4,680 |
| Time zone | CET (UTC+1) |
| • Summer (DST) | CEST (UTC+2) |
| Website |
www |

Glina is a small town in central Croatia, located southwest of Petrinja and Sisak in the Sisak-Moslavina County. It lies on the eponymous river of Glina.
History
Glina was first mentioned as a city in June 1284. Later in September 1737, during the threat of the Turks, the Croatian Sabor met in Glina. It was also a post of Ban Jelačić when he became the commander the Military Frontier during the Turkish threat.
During the mid-18th century, Count Ivan Drašković created Freemason lodges in several Croatian cities and towns, including Glina, where officers and other members shared ideas of the Jacobins from the French Revolution, until Emperor Francis II banned them in 1798. In the late 19th and early 20th century, Glina was a district capital in the Zagreb County of the Kingdom of Croatia-Slavonia.
During World War II, Glina was part of the Independent State of Croatia established by the Axis powers as a result of the Invasion of Yugoslavia. There were two Ustaše massacres of Serbs in 1941. On 11–12 May 1941, between 260–300 Serbs died, and on 3 August 1941, as many as 2,000 Serbs were killed, most in the town's Serbian Orthodox Church (see Glina massacre). During the Croatian War of Independence (1991–95), Glina was a town in the unrecognised Republic of Serbian Krajina. On 6 August 1995, Glina became a fully functioning part of Croatia itself after Operation Storm. At the same time, most ethnic Serbs fled. In December 2015, authorities exhumed 56 bodies of Serbs from a mass grave in the Gornje Seliste municipality. They were killed during the Croatian Army's Operation Storm in August 1995. The grave, dug immediately afterward, contained the bodies of Serb civilians and soldiers who died during the military offensive.[2]
Demographics
| Year of census | total | Croats | Serbs | Yugoslavs | Other |
|---|---|---|---|---|---|
| 2011 | 9,283 | 6,468 (69.68%) | 2,549 (27.46%) | 0 (0%) | 266 (2.86%) |
| 2001 | 9,868 | 6,712 (68%) | 2,829 (29%) | 0 (0%) | 327 (3.31%) |
| 1991 | 23,040 | 8,041 (34,90%) | 13,975 (60.65%) | 473 (2.05%) | 551 (2.39%) |
| 1981 | 25,079 | 8,961 (35.73%) | 14,223 (56.71%) | 1,580 (6.30%) | 315 (1.26%) |
| 1971 | 28,336 | 10,785 (38.06%) | 16,936 (59.77%) | 381 (1.34%) | 234 (0.83%) |
| 1961 | 27,747 | 9,152 (33.31%) | 18,388 (66.93%) | 60 (0.22%) | 147 (0,53%) |
The results are for the whole municipality of Glina which was larger during previous censuses. In some censuses, people listed themselves as Yugoslavs (not Serbs or Croats).
| Year of census | total | Croats | Serbs | Yugoslavs | Other |
|---|---|---|---|---|---|
| 2001 | 3,116 | 2,315 (74.29%) | 643 (20.64%) | 0 (0%) | 158 (5.07%) |
| 1991 | 6,933 | 1,448 (20.88%) | 4,831 (69.68%) | 362 (5.22%) | 352 (5.08%) |
| 1981 | 5,790 | 1,262 (21.79%) | 3,531 (60.98%) | 870 (15.02%) | 127 (2,19%) |
| 1971 | 4,558 | 1,394 (30.58%) | 2,873 (63.03%) | 193 (4.23%) | 98 (2.15%) |
| 1961 | 2,412 | 884 (36.65%) | 1,425 (59.08%) | 33 (1.37%) | 70 (2.90%) |
| 1948 | 2,098 | 1,126 (53.67%) | 930 (44.33%) | 0 (0%) | 42 (2%) |
Settlements
The settlements part of the administrative area of Glina, total population 9,283 (census 2011),[1] include:
- Balinac, population 69
- Baturi, population 0
- Bijele Vode, population 67
- Bišćanovo, population 0
- Bojna, population 28
- Borovita, population 17
- Brestik, population 76
- Brezovo Polje, population 24
- Brnjeuška, population 13
- Brubno, population 4
- Buzeta, population 67
- Dabrina, population 86
- Desni Degoj, population 86
- Dolnjaki, population 102
- Donja Bučica, population 54
- Donja Trstenica, population 0
- Donje Jame, population 22
- Donje Selište, population 109
- Donje Taborište, population 40
- Donji Klasnić, population 90
- Donji Selkovac, population 1
- Donji Viduševac, population 179
- Dragotina, population 149
- Drenovac Banski, population 74
- Dvorišće, population 99
- Glina, population 4,680
- Gornja Bučica, population 128
- Gornje Jame, population 0
- Gornje Selište, population 55
- Gornje Taborište, population 56
- Gornji Klasnić, population 41
- Gornji Selkovac, population 0
- Gornji Viduševac, population 468
- Gračanica Šišinečka, population 24
- Hađer, population 50
- Hajtić, population 32
- Ilovačak, population 93
- Joševica, population 37
- Kihalac, population 50
- Kozaperovica, population 46
- Maja, population 168
- Majske Poljane, population 196
- Majski Trtnik, population 36
- Mala Solina, population 15
- Mali Gradac, population 143
- Mali Obljaj, population 34
- Marinbrod, population 93
- Martinovići, population 71
- Momčilovića Kosa, population 36
- Novo Selo Glinsko, population 118
- Prekopa, population 143
- Prijeka, population 57
- Ravno Rašće, population 129
- Roviška, population 46
- Skela, population 41
- Slatina Pokupska, population 88
- Stankovac, population 24
- Svračica, population 44
- Šaševa, population 26
- Šatornja, population 176
- Šibine, population 28
- Trnovac Glinski, population 31
- Trtnik Glinski, population 14
- Turčenica, population 0
- Velika Solina, population 69
- Veliki Gradac, population 126
- Veliki Obljaj, population 22
- Vlahović, population 73
- Zaloj, population 20
Notable people from Glina
- Natko Devčić, Croatian composer
- Slavko Hirsch, Croatian physician
- Zlatko Šulentić, Croatian painter
References
- 1 2 "Population by Age and Sex, by Settlements, 2011 Census: Glina". Census of Population, Households and Dwellings 2011. Zagreb: Croatian Bureau of Statistics. December 2012.
- ↑ Croatia Exhumes 56 from Operation Storm Mass Grave, balkaninsight.com, 9 December 2015; accessed 13 December 2015.
External links
Subdivisions of Sisak-Moslavina County | ||
|---|---|---|
| Cities and towns | ||
| Municipalities | ||