Giebenach
| Giebenach | ||
|---|---|---|
| ||
 Giebenach | ||
|
Location of Giebenach 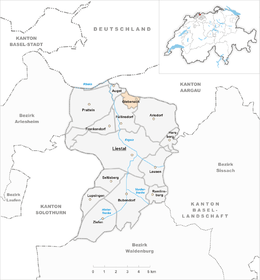 | ||
| Coordinates: 47°31′N 7°45′E / 47.517°N 7.750°ECoordinates: 47°31′N 7°45′E / 47.517°N 7.750°E | ||
| Country | Switzerland | |
| Canton | Basel-Landschaft | |
| District | Liestal | |
| Area[1] | ||
| • Total | 1.34 km2 (0.52 sq mi) | |
| Elevation | 319 m (1,047 ft) | |
| Population (Mar 2016[2]) | ||
| • Total | 1,038 | |
| • Density | 770/km2 (2,000/sq mi) | |
| Postal code | 4304 | |
| SFOS number | 2826 | |
| Surrounded by | Arisdorf, Augst, Füllinsdorf, Kaiseraugst (AG), Olsberg (AG) | |
| Website |
www SFSO statistics | |

Giebenach is a municipality in the district of Liestal in the canton of Basel-Country in Switzerland.
History
Giebenach is first mentioned in 1246 as in villa Gibenacho.[3]
Geography
Giebenach has an area, as of 2009, of 1.34 square kilometers (0.52 sq mi). Of this area, 0.77 km2 (0.30 sq mi) or 57.5% is used for agricultural purposes, while 0.24 km2 (0.093 sq mi) or 17.9% is forested. Of the rest of the land, 0.33 km2 (0.13 sq mi) or 24.6% is settled (buildings or roads).[4]
Of the built up area, housing and buildings made up 14.9% and transportation infrastructure made up 7.5%. Out of the forested land, 16.4% of the total land area is heavily forested and 1.5% is covered with orchards or small clusters of trees. Of the agricultural land, 44.8% is used for growing crops and 10.4% is pastures, while 2.2% is used for orchards or vine crops.[4]
The municipality is located in the Liestal district, at the confluence of the Violen and Arisdorfer streams to the south-east of Augst. It consists of the haufendorf village (an irregular, unplanned and quite closely packed village, built around a central square) of Giebenach.
Coat of arms
The blazon of the municipal coat of arms is Azure, a Pentagram Argent.[5]
Demographics
Giebenach has a population (as of March 2016) of 1,038.[2] As of 2008, 18.3% of the population are resident foreign nationals.[6] Over the last 10 years (1997–2007) the population has changed at a rate of 29.6%.[7]
Most of the population (as of 2000) speaks German (738 or 92.5%), with Italian language being second most common (18 or 2.3%) and French being third (10 or 1.3%).[8]
As of 2008, the gender distribution of the population was 51.1% male and 48.9% female. The population was made up of 824 Swiss citizens (82.4% of the population), and 176 non-Swiss residents (17.6%)[9] Of the population in the municipality 136 or about 17.0% were born in Giebenach and lived there in 2000. There were 182 or 22.8% who were born in the same canton, while 346 or 43.4% were born somewhere else in Switzerland, and 115 or 14.4% were born outside of Switzerland.[8]
In 2008 there were 10 live births to Swiss citizens and were 4 deaths of Swiss citizens. Ignoring immigration and emigration, the population of Swiss citizens increased by 6 while the foreign population remained the same. There were 2 Swiss women who emigrated from Switzerland. At the same time, there were 3 non-Swiss men who immigrated from another country to Switzerland and 1 non-Swiss woman who emigrated from Switzerland to another country. The total Swiss population change in 2008 (from all sources, including moves across municipal borders) was a decrease of 8 and the non-Swiss population increased by 6 people. This represents a population growth rate of -0.2%.[6]
The age distribution, as of 2010, in Giebenach is; 61 children or 6.1% of the population are between 0 and 6 years old and 139 teenagers or 13.9% are between 7 and 19. Of the adult population, 97 people or 9.7% of the population are between 20 and 29 years old. 184 people or 18.4% are between 30 and 39, 168 people or 16.8% are between 40 and 49, and 228 people or 22.8% are between 50 and 64. The senior population distribution is 103 people or 10.3% of the population are between 65 and 79 years old and there are 20 people or 2.0% who are over 80.[9]
As of 2000, there were 312 people who were single and never married in the municipality. There were 409 married individuals, 31 widows or widowers and 46 individuals who are divorced.[8]
As of 2000, there were 314 private households in the municipality, and an average of 2.5 persons per household.[7] There were 57 households that consist of only one person and 20 households with five or more people. Out of a total of 320 households that answered this question, 17.8% were households made up of just one person and 2 were adults who lived with their parents. Of the rest of the households, there are 132 married couples without children, 108 married couples with children There were 10 single parents with a child or children. There were 5 households that were made up unrelated people and 6 households that were made some sort of institution or another collective housing.[8]
In 2000 there were 167 single family homes (or 75.6% of the total) out of a total of 221 inhabited buildings. There were 27 multi-family buildings (12.2%), along with 19 multi-purpose buildings that were mostly used for housing (8.6%) and 8 other use buildings (commercial or industrial) that also had some housing (3.6%). Of the single family homes 10 were built before 1919, while 31 were built between 1990 and 2000. The greatest number of single family homes (59) were built between 1981 and 1990.[10]
In 2000 there were 324 apartments in the municipality. The most common apartment size was 4 rooms of which there were 108. There were 1 single room apartments and 144 apartments with five or more rooms. Of these apartments, a total of 308 apartments (95.1% of the total) were permanently occupied, while 6 apartments (1.9%) were seasonally occupied and 10 apartments (3.1%) were empty.[10] As of 2007, the construction rate of new housing units was 0 new units per 1000 residents.[7] As of 2000 the average price to rent a two-room apartment was about .00 CHF (US$0, £0, €0), a three-room apartment was about 1412.00 CHF (US$1130, £640, €900) and a four-room apartment cost an average of 1540.00 CHF (US$1230, £690, €990).[11] The vacancy rate for the municipality, in 2008, was 0.84%.[7]
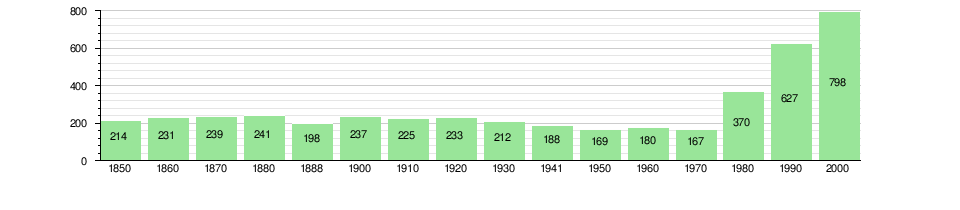
The historical population is given in the following chart:[3][12]
Politics
In the 2007 federal election the most popular party was the SVP which received 39.6% of the vote. The next three most popular parties were the SP (20.44%), the FDP (17.64%) and the Green Party (10.98%). In the federal election, a total of 286 votes were cast, and the voter turnout was 42.4%.[13]
Economy
As of 2007, Giebenach had an unemployment rate of 1.9%. As of 2005, there were 17 people employed in the primary economic sector and about 7 businesses involved in this sector. 42 people were employed in the secondary sector and there were 7 businesses in this sector. 49 people were employed in the tertiary sector, with 19 businesses in this sector.[7] There were 480 residents of the municipality who were employed in some capacity, of which females made up 42.5% of the workforce.
In 2008 the total number of full-time equivalent jobs was 123. The number of jobs in the primary sector was 5, all of which were in agriculture. The number of jobs in the secondary sector was 43, of which 25 or (58.1%) were in manufacturing and 18 (41.9%) were in construction. The number of jobs in the tertiary sector was 75. In the tertiary sector; 40 or 53.3% were in wholesale or retail sales or the repair of motor vehicles, 1 or 1.3% were in the movement and storage of goods, 3 or 4.0% were in a hotel or restaurant, 2 or 2.7% were in the information industry, 1 or 1.3% were the insurance or financial industry, 11 or 14.7% were technical professionals or scientists, 8 or 10.7% were in education.[14]
In 2000, there were 47 workers who commuted into the municipality and 407 workers who commuted away. The municipality is a net exporter of workers, with about 8.7 workers leaving the municipality for every one entering. About 14.9% of the workforce coming into Giebenach are coming from outside Switzerland.[15] Of the working population, 14.6% used public transportation to get to work, and 58.3% used a private car.[7]
Religion
From the 2000 census, 214 or 26.8% were Roman Catholic, while 395 or 49.5% belonged to the Swiss Reformed Church. Of the rest of the population, there were 6 individuals (or about 0.75% of the population) who belonged to the Christian Catholic Church, and there were 25 individuals (or about 3.13% of the population) who belonged to another Christian church. There were 5 individuals (or about 0.63% of the population) who were Jewish, and 8 (or about 1.00% of the population) who were Islamic. There was 1 person who was Buddhist and 4 individuals who were Hindu. 121 (or about 15.16% of the population) belonged to no church, are agnostic or atheist, and 19 individuals (or about 2.38% of the population) did not answer the question.[8]
Education
In Giebenach about 384 or (48.1%) of the population have completed non-mandatory upper secondary education, and 111 or (13.9%) have completed additional higher education (either university or a Fachhochschule). Of the 111 who completed tertiary schooling, 56.8% were Swiss men, 27.0% were Swiss women, 7.2% were non-Swiss men and 9.0% were non-Swiss women.[8]
As of 2000, there were 57 students from Giebenach who attended schools outside the municipality.[15]
References
- ↑ Arealstatistik Standard - Gemeindedaten nach 4 Hauptbereichen
- 1 2 Canton of Basel-Land Statistics, Wohnbevölkerung nach Nationalität und Konfession per 31. März 2016 (German) accessed 30 August 201
- 1 2 Giebenach in German, French and Italian in the online Historical Dictionary of Switzerland.
- 1 2 Swiss Federal Statistical Office-Land Use Statistics 2009 data (German) accessed 25 March 2010
- ↑ Flags of the World.com accessed 3 March 2011
- 1 2 Swiss Federal Statistical Office - Superweb database - Gemeinde Statistics 1981-2008 (German) accessed 19 June 2010
- 1 2 3 4 5 6 Swiss Federal Statistical Office accessed 3 March 2011
- 1 2 3 4 5 6 STAT-TAB Datenwürfel für Thema 40.3 - 2000 (German) accessed 2 February 2011
- 1 2 Canton of Basel-Land Statistics, Wohnbevölkerung nach Nationalität und Konfession per 30. September 2010 (German) accessed 16 February 2011
- 1 2 Federal Statistical Office STAT-TAB - Datenwürfel für Thema 09.2 - Gebäude und Wohnungen (German) accessed 28 January 2011
- ↑ Canton of Basel-Land Statistics, Mieter- und Genossenschafterwohnungen1 nach Zimmerzahl und Mietpreis 2000 (German) accessed 20 February 2011
- ↑ Swiss Federal Statistical Office STAT-TAB Bevölkerungsentwicklung nach Region, 1850-2000 (German) accessed 29 January 2011
- ↑ Swiss Federal Statistical Office, Nationalratswahlen 2007: Stärke der Parteien und Wahlbeteiligung, nach Gemeinden/Bezirk/Canton (German) accessed 28 May 2010
- ↑ Swiss Federal Statistical Office STAT-TAB Betriebszählung: Arbeitsstätten nach Gemeinde und NOGA 2008 (Abschnitte), Sektoren 1-3 (German) accessed 28 January 2011
- 1 2 Swiss Federal Statistical Office - Statweb (German) accessed 24 June 2010
External links
| Wikimedia Commons has media related to Giebenach. |
- Official website (German)
- Giebenach in German, French and Italian in the online Historical Dictionary of Switzerland.