German federal election, December 1924
German federal election, December 1924
.svg.png)
|
| 7 December 1924 (1924-12-07) |
|
|
All 493 seats in the Reichstag
247 seats needed for a majority |
| Turnout |
78.8% |
| |
First party |
Second party |
Third party |
| |
 |
 |
.jpg) |
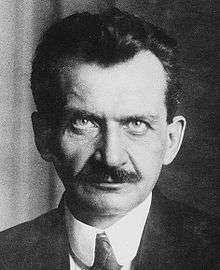
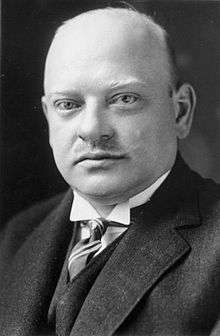
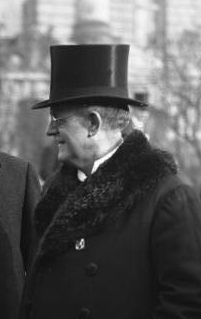
| Leader |
Otto Wels |
Kuno von Westarp |
Wilhelm Marx |
| Party |
SPD |
DNVP |
Centre |
| Leader since |
1919 |
1924 |
1923 |
| Last election |
100 seats |
95 seats |
65 seats |
| Seats won |
131 |
103 |
69 |
| Seat change |
 31 31 |
8 |
4 |
| Popular vote |
7,881,041 |
6,205,802 |
4,118,849 |
| Percentage |
26.0% |
20.5% |
13.6% |
| Swing |
5.5% |
1.0% |
0.2% |
|
| |
Fourth party |
Fifth party |
Sixth party |
| |
 |
|
|
| Leader |
Gustav Stresemann |
? |
Erich Koch-Weser |
| Party |
DVP |
KPD |
DDP |
| Leader since |
1919 |
? |
1924 |
| Last election |
45 seats |
62 seats |
28 seats |
| Seats won |
51 |
45 |
32 |
| Seat change |
6 |
 17 17 |
4 |
| Popular vote |
3,049,064 |
2,709,086 |
1,919,829 |
| Percentage |
10.1% |
9.0% |
6.3% |
| Swing |
0.9% |
3.6% |
0.6% |
|
| |
Seventh party |
Eighth party |
| |
 |
|
| Leader |
Heinrich Held |
|
| Party |
BVP |
NSFP |
| Leader since |
1924 |
|
| Last election |
16 seats |
32 seats |
| Seats won |
19 |
14 |
| Seat change |
3 |
18 |
| Popular vote |
1,134,035 |
907,242 |
| Percentage |
3.7% |
3.0% |
| Swing |
0.5% |
3.5% |
|
|
|
Federal elections were held in Germany on 7 December 1924, the second that year.[1] The Reichstag had been dissolved on 20 October 1924. The Social Democratic Party remained the largest party in the Reichstag with an increased share of the vote, winning 131 of the 493 seats.[2] Voter turnout was 78.8%.[3]
Results
| Party |
Votes |
% |
Seats |
+/– |
|---|
| Social Democratic Party | 7,881,041 | 26.0 | 131 | +31 |
| German National People's Party | 6,205,802 | 20.5 | 103 | +8 |
| Centre Party | 4,118,849 | 13.6 | 69 | +4 |
| German People's Party | 3,049,064 | 10.1 | 51 | +6 |
| Communist Party of Germany | 2,709,086 | 9.0 | 45 | −17 |
| German Democratic Party | 1,919,829 | 6.3 | 32 | +4 |
| Bavarian People's Party | 1,134,035 | 3.7 | 19 | +3 |
| National Socialist Freedom Movement | 907,242 | 3.0 | 14 | −18 |
| Agricultural League | 500,525 | 1.6 | 8 | −2 |
| Economic Party of the German Middle Class | 692,963 | 2.3 | 12 | +5 |
| Bavarian Peasant's and Middle Class Party | 312,442 | 1.0 | 5 | New |
| German-Hanoverian Party | 261,549 | 0.9 | 4 | −1 |
| German Social Party–Reichsbund für Aufwertung | 159,115 | 0.5 | 0 | New |
| Independent Social Democratic Party | 98,842 | 0.3 | 0 | 0 |
| Deutsche Aufwertungs- und Aufbaupartei | 81,944 | 0.3 | 0 | New |
| Polish People's Party | 81,700 | 0.3 | 0 | 0 |
| Wendish People's Party | 5,585 | 0.0 | 0 | 0 |
| Schleswig Club | 5,134 | 0.0 | 0 | 0 |
| Masurian Union | 542 | 0.0 | 0 | 0 |
| Christian Social People's Community | 41,530 | 0.1 | 0 | 0 |
| Free Economy Union FFF | 38,923 | 0.1 | 0 | 0 |
| Aufwertungs- und Wiederaufbaupartei (RWV 23) | 33,656 | 0.1 | 0 | New |
| Party for People's Welfare | 32,496 | 0.1 | 0 | New |
| Haeusserbund | 9,747 | 0.0 | 0 | 0 |
| German Christian People's Party | 4,322 | 0.0 | 0 | New |
| Deutschvölkische Reichspartei | 3,405 | 0.0 | 0 | New |
| Aufwertungs- und Wiederaufbaupartei | 478 | 0.0 | 0 | New |
| Tenants' Party | 246 | 0.0 | 0 | New |
| Invalid/blank votes | 414,934 | – | – | – |
| Total | 30,705,026 | 100 | 493 | +21 |
| Registered voters/turnout | 38,987,324 | 78.8 | – | – |
| Source: Nohlen & Stöver, Gonschior.de |
| Popular Vote |
|---|
|
|
|
|
|
| SPD |
|
26.02% |
| DNVP |
|
20.48% |
| Zentrum |
|
13.51% |
| DVP |
|
10.07% |
| KPD |
|
8.95% |
| DDP |
|
6.34% |
| BVP |
|
3.74% |
| NSFP |
|
3.00% |
| WP |
|
2.29% |
| Other |
|
5.61% |
| Reichstag seats |
|---|
|
|
|
|
|
| SPD |
|
26.57% |
| DNVP |
|
20.89% |
| Zentrum |
|
14.00% |
| DVP |
|
10.34% |
| KPD |
|
9.13% |
| DDP |
|
6.49% |
| BVP |
|
3.85% |
| NSFP |
|
2.84% |
| WP |
|
2.43% |
| Other |
|
3.45% |
References
- ↑ Nohlen, D & Stöver, P (2010) Elections in Europe: A data handbook, p762 ISBN 978-3-8329-5609-7
- ↑ Nohlen & Stöver, p790
- ↑ Nohlen & Stöver, p777