Globe at Night
Globe at Night is an international scientific research program that crowdsources measurements of light pollution in the night sky. At set time periods within each year, the project asks people to count the number of stars that they can see from their location and report it to the project's website. The coordinating researchers compile this information to produce a public, freely available map of global light pollution. By September 2011, almost 70,000 measurements had been made.[1] The use of data collected by the public makes the program an example of citizen science.[2] Globe at Night began as a NASA educational program in the US organized by the NOAO, and was expanded internationally during the 2009 International Year of Astronomy;[3] it is an offshoot of the GLOBE Program, which focusses on school-based science education.
Scientific rationale

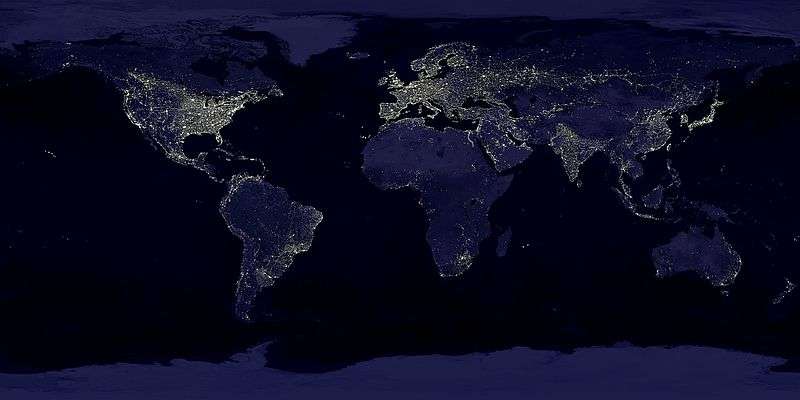
Light pollution, the introduction of artificial light into formerly dark ecosystems, has numerous adverse ecological effects. Exposure to artificial light can prove fatal for some organisms (e.g. moths that fly into a burning flame), can interrupt a life cycle phase for others (e.g. glowworms are unable to attract mates), and can reduce the possibilities for finding food (because of increased risk of predation).[4] Light at night can also interfere with the chronobiology of many animals, including humans, through suppression of melatonin secretion.[5]
There are also cultural and economic reasons for concern about excessive light at night. Skyglow prevents large fractions of the Earth's population from viewing the Milky Way,[6] which drove the development of much of ancient science, mythology, and religion. In the US, the cost of generating wasted light is estimated to be 7 billion US dollars per year;[7] the production of the electricity for this wasted light also results in the release of chemical pollution and greenhouse gases.
The Globe at Night project has two main goals: raise public awareness of light pollution and its effects, and provide global mapping data for light pollution.[1][8][9]
Method

The project asks members of the public to go outside on dark moonless nights and report how many stars are visible in particular constellations.[1][3] The project focuses on students, teachers, and families, and has produced activity packets in 13 languages.[3][10] NASA encourages students in its INSPIRE program to participate.[11]
Participating individuals are asked to go outside on specified dates at least an hour after sunset, let their eyes adjust to the ambient light level, and observe a specific constellation: Orion or Leo in the Northern Hemisphere, Crux in the Southern Hemisphere.[8][10][12] The choice of a two-week span of dates near the new moon removes any effect on sky brightness from scattered moonlight, and observing well after sunset prevents any lingering light from twilight.[13] By comparing the stars they see with star charts showing stellar visibility under different light pollution conditions, they qualitatively measure light pollution.[14][15] Stellar visibility can also be measured for the project using a Sky Quality Meter, a tool used by amateur astronomers.[14] These light pollution data are then submitted to the coordinating website via a web browser.[16][17] The assembled data are provided to researchers and the public via a mapping interface that displays the data overlaid on Google Maps.[18]
With this technique, observers are reporting a naked eye limiting magnitude (NELM) between 1 and 7. Humans are able to observe stars below 7th magnitude, although this may require blocking out other sources of light.[13] Under clear, unpolluted skies, the measurement of NELM should be strongly correlated with the level of light pollution. Other factors, particularly those that reduce the seeing, can reduce NELM:[13]
- atmospheric water content (especially clouds)[19]
- atmospheric aerosols such as dust or air pollution[20]
- visual acuity of the observer[21]
- wind (can cause stars to twinkle, and render dim stars invisible)
- aurora
- airglow,[22] gegenschein, and Zodiacal light[23]
- age of the observer[24]
- Presence of the Milky Way[13]
Globe at Night also distributes teaching kits that demonstrate how fully shielded lights reduce glare and improve the visibility of the night sky.[3][25]
Accuracy of measurements

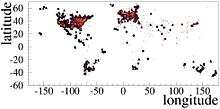
The standard deviation of an individual Globe at Night observation is approximately 1.2 stellar magnitudes.[2] Due to the law of large numbers, when the observations are considered in aggregate, the errors from individual observations cancel each other out, leading to very stable mean values. This means that Globe at Night observations could be used to estimate global or regional trends in sky luminance.[2]
Conversion of measurements into other units
Globe at Night observations identify the dimmest stars that are visible given the surrounding conditions. Assuming normal visible acuity and clear skies, it is possible to approximately convert Globe at Night naked eye limiting maximum estimates into other units:[26]
| NELM | Visible stars | mcd/m2 | mag/arcsec2 |
|---|---|---|---|
| 1 | 10 | 160 | 14.6 |
| 2 | 30 | 60 | 15.6 |
| 3 | 80 | 20 | 16.6 |
| 4 | 250 | 8 | 17.8 |
| 5 | 800 | 3 | 19.0 |
| 6 | 2,500 | 0.8 | 20.4 |
| 7 | 7,000 | 0.2 | 22.0 |
History
The Globe at Night project was launched as a NASA program in the United States.[1] The project quickly expanded internationally, and was part of the outreach effort of the International Year of Astronomy in 2009.[27] The size of the project (in terms of number of observations) expanded dramatically in that year. In 2014, the project expanded to also include data obtained via the Loss of the Night app for Android devices, and the Dark Sky Meter app for iOS devices. In addition, new star charts were added to extend the standard map based campaign throughout the whole year. In 2015, as part of the International Year of Light, two "International Nights of Skyglow Observation" were introduced, to encourage data submission in March and September.[28]
The number of observations for each year are reported on the Globe at Night webpage:[9]
- 2006 - 3,990 total observations
- 2007 - 8,490 total observations
- 2008 - 6,838 total observations
- 2009 - 15,300 total observations
- 2010 - 17,805 total observations
- 2011 - 14,249 total observations
- 2012 - 16,848 total observations
- 2013 - 14,879 total observations
- 2014 - 18,506 total observations
Spinoff research
Data from the Globe at Night program has also been used in a study of the effects of artificial lighting on the foraging habits of bats.[29]
See also
- Bortle Dark-Sky Scale
- Connie Walker (astronomer)
- Earth Hour
- Ecological light pollution
- History of street lighting in the United States
- International Dark Sky Association
References
- 1 2 3 4 Fazekas, Andrew. "GLOBE at Night – Helping to Save the Night Sky". National Geographic. Retrieved 25 January 2012.
- 1 2 3 Kyba, Christopher C. M.; Wagner, Janna M.; Kuechly, Helga U.; Walker, Constance E.; Elvidge, Christopher D.; Falchi, Fabio; Ruhtz, Thomas; Fischer, Jürgen; Hölker, Franz (16 May 2013). "Citizen Science Provides Valuable Data for Monitoring Global Night Sky Luminance". Scientific Reports. 3. Bibcode:2013NatSR...3E1835K. doi:10.1038/srep01835.
- 1 2 3 4 Walker, Constance; Stephen Pompea (3 November 2010). "Global campaign to save energy and fight light pollution". SPIE Newsroom. doi:10.1117/2.1201009.003213.
- ↑ Catherine Rich and Travis Longcore (2006). Ecological consequences of artificial night lighting. Island Press. ISBN 1-55963-128-7.
- ↑ P. Cinzano and F. Falchi and C. D. Elvidge (2001). "The first world atlas of the artificial night sky brightness" (PDF). Mon. Not. R. Astron. Soc. 328 (3): 689–707. arXiv:astro-ph/0108052
 . Bibcode:2001MNRAS.328..689C. doi:10.1046/j.1365-8711.2001.04882.x.
 - ↑ Gallaway, Terrel; Olsen, Reed N.; Mitchell, David M. "The economics of global light pollution". Ecological Economics. 69 (3): 658–665. doi:10.1016/j.ecolecon.2009.10.003.
- 1 2 "Globe at Night - Home page". Globe at Night. Retrieved 14 March 2012.
- 1 2 "Globe at Night - Analyze". Globe at Night. Retrieved 14 March 2012.
- 1 2 "Globe at Night Family Activity Packet". Globe at Night. Retrieved 14 March 2012.
- ↑ http://nasaed.okstate.edu/INSPIRE/enewsarchives/April23_12.html
- ↑ NASA Education Office. "Join the Worldwide Globe at Night 2012 Campaign". spaceref.com. Retrieved 15 March 2012.
- 1 2 3 4 Weaver, Harold F. (1947). "The Visibility of Stars Without Optical Aid". Publications of the Astronomical Society of the Pacific. 59 (350): 232. Bibcode:1947PASP...59..232W. doi:10.1086/125956. Retrieved 12 March 2012.
- 1 2 Beatty, Kelly. "Make the Effort for "Globe at Night"". Sky & Telescope. Retrieved 25 January 2012.
- ↑ "Globe at Night - Magnitude Charts Orion 40 deg N". Globe at Night. Retrieved 14 March 2012.
- ↑ "NSF Current Newsletter - March 2012". National Science Foundation. Retrieved 15 March 2012.
- ↑ "Globe at Night webapp". Globe at Night. Retrieved 14 March 2012.
- ↑ "Globe at Night Interactive Map viewer". Globe at Night. Retrieved 14 March 2012.
- ↑ Kyba, Christopher C. M.; Ruhtz, Thomas; Fischer, Jürgen; Hölker, Franz. "Cloud Coverage Acts as an Amplifier for Ecological Light Pollution in Urban Ecosystems". PLoS ONE. 6 (3): e17307. Bibcode:2011PLoSO...617307K. doi:10.1371/journal.pone.0017307. PMC 3047560. PMID 21399694.
- ↑ Garstang, R. H. (October 1991). "Dust and light pollution". Publications of the Astronomical Society of the Pacific. 103: 1109–1116. Bibcode:1991PASP..103.1109G. doi:10.1086/132933. Retrieved 12 March 2012.
- ↑ Westheimer, G (1 January 1965). "Visual Acuity". Annual Review of Psychology. 16 (1): 359–380. doi:10.1146/annurev.ps.16.020165.002043.
- ↑ Broadfoot, A. Lyle; Kendall, Kenneth R. (1 January 1968). "The Airglow Spectrum, 3100-10,000 A". Journal of Geophysical Research. 73 (1): 426–428. Bibcode:1968JGR....73..426B. doi:10.1029/JA073i001p00426.
- ↑ James, J. F.; Mukai, T.; Watanabe, T.; Ishiguro, M.; Nakamura, R. (1997). "The morphology and brightness of the zodiacal light and gegenschein". Monthly Notices of the Royal Astronomical Society. 288 (4): 1022–1026. Bibcode:1997MNRAS.288.1022J. doi:10.1093/mnras/288.4.1022. Retrieved 12 March 2012.
- ↑ Gittings, Neil S.; Fozard, James L. "Age related changes in visual acuity". Experimental Gerontology. 21 (4-5): 423–433. doi:10.1016/0531-5565(86)90047-1.
- ↑ Walker, CE; Pompea SM; Sparks RT (2010). "Dark Skies From the Ground Up: Before, During and After Globe at Night". ASP Conference Series. Earth and Space Science: Making Connections in Education and Public Outreach. 433.
- ↑ Spoelstra, H. "Dark Skies Awareness: Sky Brightness Nomogram". Retrieved 14 March 2012.
- ↑ Walker, CE; Pompea SM; Isbell D (2007). "GLOBE at Night 2.0: On the Road Toward IYA 2009". ASP Conference Series. EPO and a Changing World: Creating Linkages and Expanding Partnerships. 389.
- ↑ Kyba, Christopher. "Help measure how the night sky is changing". International Year of Light Blog. Retrieved 3 March 2015.
- ↑ Barringer, D; Walker, C. E.; Pompea, S. M.; Sparks, R. T. "Astronomy Meets the Environmental Sciences: Using GLOBE at Night Data". Earth and Space Science: Making Connections in Education and Public Outreach. 433: 373. Retrieved 15 March 2012.