Energy efficiency in transportation

Energy efficiency in transportation is, strictly speaking, useful output (kilometers, miles, etc.) divided by total energy input (kilowatt-hour, amount of gasoline, etc.). This is more precisely known as fuel economy (symbol FE), and may be measured in units of km/L or mi/gal (MPG).[1][2]
Energy efficiency in transportation is often (and confusingly) described in terms of fuel consumption (symbol FC). Fuel consumption is the reciprocal of fuel economy[2] and is occasionally known as energy intensity;[3] it equals fuel (energy) divided by distance, and is often measured in units of liters per 100 kilometers (L/100 km), joules per kilometer (J/km), gallon-equivalent per 100 miles (gale/100 mi), or kilowatt-hours per distance (kW-hr/km or kW-hr/mi).
The energy efficiency in transportation varies by mode of transportation (listed below). Different types of transportation range from some hundred kilojoules per kilometre (kJ/km) for a bicycle to tens of megajoules per kilometer (MJ/km) for a helicopter.
Units of measurement
Both fuel economy and fuel consumption are often given on a per-vehicle basis. More refined units of measurement exist, such as fuel consumption per passenger or fuel consumption per mass of cargo.
Energy efficiency is expressed in terms of fuel economy:[2]
- distance per vehicle per unit fuel volume; e.g., km/L or miles per gallon (US or imperial).
- distance per vehicle per unit fuel mass; e.g., km/kg.[4]
- distance per vehicle per unit energy; e.g., miles per gallon equivalent (mpg-e).
Energy intensity (reciprocal efficiency)[3] is expressed terms of fuel consumption:[2]
- volume of fuel (or total energy) consumed per unit distance per vehicle; e.g. L/100 km or MJ/100 km.
- volume of fuel (or total energy) consumed per unit distance per passenger; e.g., L/(100 passenger·km).
- volume of fuel (or total energy) consumed per unit distance per unit mass of cargo transported; e.g., L/100 kg·km or MJ/t·km.
- electricity used per vehicle per unit distance; e.g., kW·h/100 km.
Transportation types
For freight transport, rail and ship transport are generally much more efficient than trucking, and air freight is much less efficient.[5][6]
Walking

A 68 kg (150 lb) person walking at 4 km/h (2.5 mph) requires approximately 210 kilocalories (880 kJ) of food energy per hour, which is equivalent to 4.55 km/MJ.[7] 1 US gal (3.8 L) of gasoline contains about 114,000 British thermal units (120 MJ)[8] of energy, so this is approximately equivalent to 360 miles per US gallon (0.65 L/100 km).
Velomobile
Velomobiles seem to have the highest energy efficiency in personal transportation. At a speed of 50 km/h (31 mph) the WAW manufacturer claims they need only 0.5 kW·h of food energy per 100 km to transport the passenger, which is around 1⁄5 (20%) of a normal bicycle, and 1⁄50 (2%) of an average fossil fuel or electric car. This corresponds to 4700 miles per US gallon (2000 km/L, 0.05 L/100 km).[9] Other sources give a figure of 1⁄3.4 (29.5%) of the energy use of a normal bicycle.[10]
Bicycling
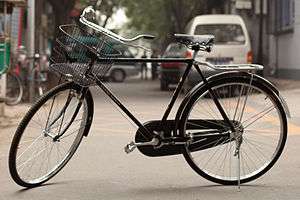
A relatively light and slow vehicle with low-friction tires and an efficient chain-driven drivetrain, the bicycle is one of the most energy-efficient forms of transport. Compared with walking, a 64 kg (140 lb) cyclist riding at 16 km/h (10 mph) requires about half the food energy per unit distance: 43 kcal/mi, 27 kcal/km or 3.1 kW·h (11 MJ) per 100 km.[7] This converts to about 732 mpg-US (0.321 L/100 km; 879 mpg-imp).[11] This figure depends on the speed and mass of the rider: greater speeds give higher air drag and heavier riders consume more energy per unit distance.
A motorized bicycle allows human power and the assistance of a 49 cm3 (3.0 cu in) engine, giving a range of 160 to 200 mpg-US (1.5–1.2 L/100 km; 190–240 mpg-imp). Electric pedal-assisted bikes run on as little as 1.0 kW·h (3.6 MJ) per 100 km, while maintaining speeds in excess of 30 km/h (19 mph). These best-case figures rely on a human doing 70% of the work, with around 3.6 MJ (1.0 kW·h) per 100 km coming from the motor.
Human power
To be thorough, a comparison must also consider the energy costs of producing, transporting and packaging of fuel (food or fossil fuel), the energy incurred in disposing of exhaust waste, and the energy costs of manufacturing the vehicle. This last can be significant given that walking requires little or no special equipment, while automobiles, for example, require a great deal of energy to produce and have relatively short lifespans. In addition, any comparison of electric vehicles and liquid-fuelled vehicles must include the fuel consumed in the power station to generate the electricity. In the UK for instance the efficiency of the electricity generation and distribution system is around 0.40.
Automobiles
%2C_5._April_2012%2C_D%C3%BCsseldorf.jpg)
Automobile fuel efficiency is most commonly expressed in terms of the volume of fuel consumed per one hundred kilometres (L/100 km), but in some countries (including the USA, UK and India) it is more commonly expressed in terms of the distance per volume fuel consumed (km/L or miles per US or imperial gallon). This is complicated by the different energy content of fuels such as petrol and diesel. The Oak Ridge National Laboratory (ORNL) states that the energy content of unleaded gasoline is 115,000 British thermal unit (BTU) per US gallon (32 MJ/L) compared to 130,500 BTU per US gallon (36.4 MJ/L) for diesel.[12]
A second important consideration is the energy costs of producing energy. Bio-fuels, electricity and hydrogen, for instance, have significant energy inputs in their production. Because of this, the 50–70% efficiency of hydrogen production has to be combined with the vehicle efficiency to yield net efficiency.[13]
A third consideration to take into account is the occupancy rate of the vehicle. As the number of passengers per vehicle increases the consumption per unit distance per vehicle increases. However this increase is slight compared to the reduction in consumption per unit distance per passenger. We can compare, for instance, the estimated average occupancy rate of about 1.3 passengers per car in the San Francisco Bay Area[14] to the 2006 UK estimated average of 1.58.[15]
Finally, vehicle energy efficiency calculations would be misleading without factoring the energy cost of producing the vehicle itself. This initial energy cost can of course be depreciated over the life of the vehicle to calculate an average energy efficiency over its effective life span. In other words, vehicles that take a lot of energy to produce and are used for relatively short periods will require a great deal more energy over their effective lifespan than those that do not, and are therefore much less energy efficient than they may otherwise seem. Compare, for example, walking, which requires no special equipment at all, and an automobile, produced in and shipped from another country, and made from parts manufactured around the world from raw materials and minerals mined and processed elsewhere again, and used for a limited number of years.
Driving practices and vehicles can be modified to improve their energy efficiency by about 15%.[16][17]
Example consumption figures
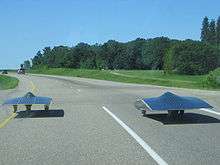
- Solar cars use no fuel, charging the batteries entirely from built-in solar panels, and typically use less than 3 kW·h per 100 miles (67 kJ/km or 1.86 kW·h/100 km).[18]
- The four passenger GEM NER uses 169 Wh/mi (203 mpg-e; 10.5 kW·h/100 km),[19] which equates to 2.6 kW·h/100 km per person when fully occupied, albeit at only 24 mph (39 km/h).
- The General Motors EV1 was rated in a test with a charging efficiency of 373 Wh-AC/mile or 23 kWh/100 km[20] approximately equivalent to 2.6 L/100 km (110 mpg-imp; 90 mpg-US) for petroleum-fuelled vehicles.
- Chevrolet Volt in full electric mode uses 36 kilowatt-hours per 100 miles (810 kJ/km; 96 mpg-e), meaning it may be more energy-efficient than walking for 4 or more passengers.
- The Daihatsu Charade 993cc turbo diesel (1987–1993) won the most fuel efficient vehicle award for going round the United Kingdom consuming an average of 2.82 L/100 km (100 mpg-imp). It was surpassed only recently by the VW Lupo 3 L which consumes about 2.77 L/100 km (102 mpg-imp). Both cars are rare to find on the popular market. The Daihatsu had major problems with rust and structural safety which contributes to its rarity and the quite short production run.
- The Volkswagen Polo 1.4 TDI Bluemotion and the SEAT Ibiza 1.4 TDI Ecomotion, both rated at 3.8 L/100 km (74 mpg-imp; 62 mpg-US) (combined) were the most fuel efficient cars on sale in the UK as of 22 March 2008.[21][22][23]
- Honda Insight – achieves 48 mpg-US (4.9 L/100 km; 58 mpg-imp) under real-world conditions.[24]
- Honda Civic Hybrid- regularly averages around 45 mpg-US (5.2 L/100 km; 54 mpg-imp).
- Toyota Prius – According to the US EPA's revised estimates, the combined fuel consumption for the 2008 Prius is 46 mpg-US (5.1 L/100 km; 55 mpg-imp),[25] making it the most fuel efficient United States car of 2008.[26] In the UK, the official fuel consumption figure (combined) for the Prius is 4.3 L/100 km (66 mpg-imp; 55 mpg-US).[27]
- 2012 Cadillac CTS-V Wagon 6.2 L Supercharged, 14 mpg-US (17 L/100 km; 17 mpg-imp).[28]
- 2012 Bugatti Veyron, 10 mpg-US (24 L/100 km; 12 mpg-imp).[28]
Aircraft
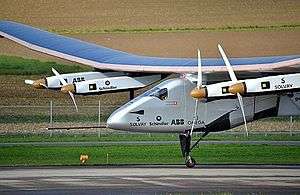
A principal determinant of energy consumption in aircraft is drag, which must be opposed by thrust for the aircraft to progress.
- Drag is proportional to the lift required for flight,[29] which is equal to the weight of the aircraft. As induced drag increases with weight, mass reduction, with improvements in engine efficiency and reductions in aerodynamic drag, has been a principal source of efficiency gains in aircraft, with a rule-of-thumb being that a 1% weight reduction corresponds to around a 0.75% reduction in fuel consumption.[29]
- Flight altitude affects engine efficiency. Jet-engine efficiency increases at altitude up to the tropopause, the temperature minimum of the atmosphere; at lower temperatures, the Carnot efficiency is higher.[29] Jet engine efficiency is also increased at high speeds, but above about Mach 0.85 the airframe aerodynamic losses increase faster.
- Compressibility effects: beginning at transonic speeds of around Mach 0.85, shockwaves form increasing drag.
- For supersonic flight, it is difficult to achieve a lift to drag ratio greater than 5, and fuel consumption is increased in proportion.
| Aircraft | Concorde[30] | Boeing 747-400[31] |
|---|---|---|
| Passenger-miles/imperial gallon | 17 | 109 |
| Passenger-miles/US gallon | 14 | 91 |
| Litres/100 passenger-km | 16.6 | 3.1 |
Passenger airplanes averaged 4.8 l/100 km per passenger (1.4 MJ/passenger-km) (49 passenger-miles per gallon) in 1998. Note that on average 20% of seats are left unoccupied. Jet aircraft efficiencies are improving: Between 1960 and 2000 there was a 55% overall fuel efficiency gain (if one were to exclude the inefficient and limited fleet of the DH Comet 4 and to consider the Boeing 707 as the base case).[32] Most of the improvements in efficiency were gained in the first decade when jet craft first came into widespread commercial use. Compared to advanced piston engine airliners of the 1950s, current jet airliners are only marginally more efficient per passenger-mile.[33] Between 1971 and 1998 the fleet-average annual improvement per available seat-kilometre was estimated at 2.4%. Concorde the supersonic transport managed about 17 passenger-miles to the Imperial gallon; similar to a business jet, but much worse than a subsonic turbofan aircraft. Airbus puts the fuel rate consumption of their A380 at less than 3 l/100 km per passenger (78 passenger-miles per US gallon).[34]

The mass of an aircraft can be reduced by using light-weight materials such as titanium, carbon fiber and other composite plastics. Expensive materials may be used, if the reduction of mass justifies the price of materials through improved fuel efficiency. The improvements achieved in fuel efficiency by mass reduction, reduces the amount of fuel that needs to be carried. This further reduces the mass of the aircraft and therefore enables further gains in fuel efficiency. For example, the Airbus A380 design includes multiple light-weight materials.
Airbus has showcased wingtip devices (sharklets or winglets) that can achieve 3.5 percent reduction in fuel consumption.[35][36] There are wingtip devices on the Airbus A380. Further developed Minix winglets have been said to offer 6 percent reduction in fuel consumption.[37] Winglets at the tip of an aircraft wing smooth out the wing-tip vortex (reducing the aircraft's wing drag) and can be retrofitted to any airplane.[37]
NASA and Boeing are conducting tests on a 500 lb (230 kg) "blended wing" aircraft. This design allows for greater fuel efficiency since the whole craft produces lift, not just the wings.[38] The blended wing body (BWB) concept offers advantages in structural, aerodynamic and operating efficiencies over today's more conventional fuselage-and-wing designs. These features translate into greater range, fuel economy, reliability and life cycle savings, as well as lower manufacturing costs.[39][40] NASA has created a cruise efficient STOL (CESTOL) concept.
Fraunhofer Institute for Manufacturing Engineering and Applied Materials Research (IFAM) have researched a shark skin imitating paint that would reduce drag through a riblet effect.[41] Aircraft are a major potential application for new technologies such as aluminium metal foam and nanotechnology such as the shark skin imitating paint.
Propfan propulsors are a more fuel efficient technology than jets or turboprops, but turboprops have an optimum speed below about 450 mph (700 km/h).[42] This speed is less than used with jets by major airlines today. However, the decrease in speed reduces drag. With the current high price for jet fuel and the emphasis on engine/airframe efficiency to reduce emissions, there is renewed interest in the propfan concept for jetliners that might come into service beyond the Boeing 787 and Airbus A350XWB. For instance, Airbus has patented aircraft designs with twin rear-mounted counter-rotating propfans.[43] NASA has conducted an Advanced Turboprop Project (ATP), where they researched a variable pitch propfan that produced less noise and achieved high speeds.
Related to fuel efficiency is the impact of aviation emissions on climate.
Small aircraft

- Motor-gliders made of composite materials can reach an extremely low fuel consumption for cross-country flights, using thermal air currents and winds.
- At 160 km/h, a diesel powered two-seater Dieselis burns 6 liters of fuel per hour, 1.9 liters per 100 passenger km.[44]
- at 220 km/h, a four-seater 100 hp MCR-4S burns 20 liters of gas per hour, 2.2 liters per 100 passenger km.
- Under continuous motorised flight at 225 km/h, a Pipistrel Sinus burns 11 liters of fuel per flight hour. Carrying 2 people aboard, it operates at 2.4 liters per 100 passenger km.
- Ultralight aircraft Tecnam P92 Echo Classic at cruise speed of 185 km/h burns 17 liters of fuel per flight hour, 4.6 liters per 100 passenger km (2 people).[45] Other modern ultralight aircraft have increased efficiency; Tecnam P2002 Sierra RG at cruise speed of 237 km/h burns 17 liters of fuel per flight hour, 3.6 liters per 100 passenger km (2 people).[46]
- Two-seater and four-seater flying at 250 km/h with old generation engines can burn 25 to 40 liters per flight hour, 3 to 5 liters per 100 passenger km.
- The Sikorsky S-76C++ twin turbine helicopter gets about 1.65 mpg-US (143 L/100 km; 1.98 mpg-imp) at 140 knots (260 km/h; 160 mph) and carries 12 for about 19.8 passenger-miles per gallon (11.9 L per 100 passenger km).
Ships
Queen Elizabeth

Cunard states that RMS Queen Elizabeth 2 travels 49.5 feet per imperial gallon of diesel oil (3.32 m/l or 41.2 ft/US gal), and that it has a passenger capacity of 1777.[47] Thus carrying 1777 passengers we can calculate an efficiency of 16.7 passenger miles per imperial gallon (16.9 l/100 p·km or 13.9 p·mpg–US).
Cruise ships
MS Oasis of the Seas has a capacity of 6,296 passengers and a fuel efficiency of 14.4 passenger miles per US gallon. Voyager-class cruise ships have a capacity of 3,114 passengers and a fuel efficiency of 12.8 passenger miles per US gallon.[48]
Emma Maersk
Emma Maersk uses a Wärtsilä-Sulzer RTA96-C, which consumes 163 g/kW·h and 13,000 kg/h. If it carries 13,000 containers then 1 kg fuel transports one container for one hour over a distance of 45 km. The ship takes 18 days from Tanjung (Singapore) to Rotterdam (Netherlands), 11 from Tanjung to Suez, and 7 from Suez to Rotterdam,[49] which is roughly 430 hours, and has 80 MW, +30 MW. 18 days at a mean speed of 25 knots (46 km/h) gives a total distance of 10,800 nautical miles (20,000 km).
Sailboats
A sailboat, much like a solar car, can locomote without consuming any fuel. A sail boat such as a Dinghy using just wind power requires no input energy in terms of fuel. However some manual energy is required by the crew to steer the boat and adjust the sails using ropes. In addition energy will be needed for demands other than propulsion, such as cooking, heating or lighting. The fuel efficiency of a single-occupancy boat is highly dependent on the size of its engine, the speed at which it travels, and its displacement. Due to the high viscosity of water, with a single passenger, the equivalent energy efficiency will be lower than in a car, train, or plane.
Trains
Trains can be an efficient means of transport for freight and passengers. Efficiency varies significantly with passenger loads, and losses incurred in electricity generation and supply (for electrified systems),[50][51] and, importantly, end-to-end delivery, where stations are not the originating final destinations of a journey.
Actual consumption depends on gradients, maximum speeds, loading and stopping patterns. Data produced for the European MEET project (Methodologies for Estimating Air Pollutant Emissions) illustrate the different consumption patterns over several track sections. The results show the consumption for a German ICE high-speed train varied from around 19 to 33 kW·h/km (68–119 MJ/km; 31–53 kW·h/mi). The data also reflects the weight of the train per passenger. For example, TGV double-deck Duplex trains use lightweight materials, which keep axle loads down and reduce damage to track and also save energy.[52]
Freight
Energy consumption estimates for rail freight vary widely, and many are provided by interested parties. Some are tabulated below.
| Country | Year | Fuel economy (weight of goods) | Energy Intensity |
|---|---|---|---|
| USA[53] | 2007 | 185.363 km/L (1 short ton) | energy/mass-distance |
| UK[54] | — | 87 t·km/L | 0.41 MJ/t·km (LHV) |
Passenger
| Country | Year | Train efficiency | Per passenger-km (kJ) |
|---|---|---|---|
| Japan[55] | 2004 | 17.9 MJ (5.0 kWh)/car-km | 350 kJ/passenger-km |
| EC[56][57] | 1997 | 18 kW·h/km (65 MJ/km) | |
| USA[58][59] | 1.125 mpg-US (209.1 L/100 km; 1.351 mpg-imp) | 468 passenger-miles/US gallon (0.503 L/100 passenger-km) | |
| Switzerland[60] | 2011 | 2300 GWhr/yr | 470 kJ/passenger-km |
| Basel, Switzerland[61][62] | 1.53 kWh/vehicle-km (5.51 MJ/vehicle-km) | 85 kJ/passenger-km (150 kJ/passenger-km at 80% average load) | |
| USA[63] | 2009 | 2,435 BTU/mi (1.60 MJ/km) | |
| Portugal[64] | 2011 | 8.5 kW·h/km (31 MJ/km; 13.7 kW·h/mi) | 77 kJ/passenger-km |
Considering only the energy spent to move the train, and taking as example the urban area of Lisbon, train seems to be on average 20 times more efficient than automobile for transportation of passengers, if we consider energy spent per passenger-km.[64] Considering an automobile which has a consumptions of around 6 l/100 km (47 mpg-imp; 39 mpg-US) of gasoline, the fact the on average cars in Europe have an occupation ratio of around 1.2 passengers per automobile and that one litre of gasoline amounts for about 8826 Wh, one gets on average 441 Wh (1,590 kJ) per passenger-km. On the other hand, a modern urban train with an average occupation of 20% of total capacity, which has a consumption of about 8.5 kW·h/km (31 MJ/km; 13.7 kW·h/mi), one gets 21.5 Wh per passenger-km, 20 times less than the automobile.
Braking losses
Stopping is a considerable source of inefficiency. Modern electric trains like the Shinkansen (the Bullet Train) use regenerative braking to return current into the catenary while they brake. A Siemens study indicated that regenerative braking might recover 41.6% of the total energy consumed. The Passenger Rail (Urban and Intercity) and Scheduled Intercity and All Charter Bus Industries Technological and Operational Improvements – FINAL REPORT states that "Commuter operations can dissipate more than half of their total traction energy in braking for stops." and that "We estimate head-end power to be 35 percent (but it could possibly be as high as 45 percent) of total energy consumed by commuter railways."[65] Having to accelerate and decelerate a heavy train load of people at every stop is inefficient despite regenerative braking which can recover typically around 20% of the energy wasted in braking. Weight is a determinant of braking losses.
Other references
AEA study of road and rail for the United Kingdom Department for Transport: Final report
Buses
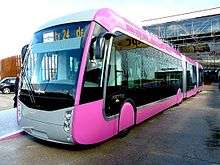
- In July 2005, the average occupancy for buses in the UK was stated to be 9.[67]
- The fleet of 244 40-foot (12 m) 1982 New Flyer trolley buses in local service with BC Transit in Vancouver, Canada, in 1994/95 used 35,454,170 kWh for 12,966,285 vehicle km, or 9.84 MJ/vehicle km. Exact ridership on trolleybuses is not known, but with all 34 seats filled this equates to 0.32 MJ/passenger km. It is quite common to see people standing on Vancouver trolleybuses. This is a service with many stops per kilometre; part of the reason for the efficiency is the use of regenerative braking.
- A commuter service in Santa Barbara, California, USA, found average diesel bus efficiency of 6.0 mpg-US (39 L/100 km; 7.2 mpg-imp) (using MCI 102DL3 buses). With all 55 seats filled this equates to 330 passenger mpg; with 70% filled, 231 passenger mpg.[68]
- In 2011 the fleet of 752 buses in the city of Lisbon had an average speed of 14.4 km/h and an average occupancy of 20.1 passengers per vehicle.[69]
Other
- NASA's Crawler-Transporter is used to move the Shuttle from storage to the launch pad. It uses diesel and has one of the highest fuel consumption rates on record, 150 US gallons per mile (350 l/km; 120 imp gal/mi).[70]
International transport comparisons
UK Public transport
Rail and bus are generally required to serve 'off peak' and rural services, which by their nature have lower loads than city bus routes and inter city train lines. Moreover, due to their 'walk on' ticketing it is much harder to match daily demand and passenger numbers. As a consequence, the overall load factor on UK railways is 35% or 90 people per train:[71]
Conversely, Air services work on point-to-point networks between large population centres and are 'pre-book' in nature. Using yield management overall loads can be raised to around 70–90%. However, recently intercity train operators have been using similar techniques, with loads reaching typically 71% overall for TGV services in France and a similar figure for the UK's Virgin Trains services.[72]
For emissions, the electricity generating source needs to be taken into account.[73][74] [75]
US Passenger transportation
The US Transportation Energy Data Book states the following figures for passenger transportation in 2009:[63]
| Transport mode | Average passengers per vehicle |
BTU per passenger-mile |
MJ per passenger-kilometre |
|---|---|---|---|
| Rail (intercity Amtrak) | 20.9 | 2,435 | 1.596 |
| Motorcycles | 1.16 | 2,460 | 1.61 |
| Rail (transit light & heavy) | 24.5 | 2,516 | 1.649 |
| Rail (commuter) | 32.7 | 2,812 | 1.843 |
| Air | 99.3 | 2,826 | 1.853 |
| Cars | 1.55 | 3,538 | 2.319 |
| Personal trucks | 1.84 | 3,663 | 2.401 |
| Buses (transit) | 9.2 | 4,242 | 2.781 |
| Taxi | 1.55 | 15,645 | 10.257 |
US Freight transportation
The US Transportation Energy book states the following figures for freight transportation in 2010:[63][76][77][78]
| Transportation mode | Fuel consumption | |
|---|---|---|
| BTU per short ton-mile | kJ per tonne-kilometre | |
| Domestic waterborne | 217 | 160 |
| Class 1 railroads | 289 | 209 |
| Heavy trucks | 3,357 | 2,426 |
| Air freight (approx.) | 9,600 | 6,900 |
From 1960 to 2010 the efficiency of air freight has increased 75%, mostly due to more efficient jet engines.[79]
1 gal-US (3.785 l, 0.833 gal-imp) of fuel can move a ton of cargo 857 km or 462 nmi by barge, or 337 km (209 mi) by rail, or 98 km (61 mi) by truck.[80]
Compare:
- Space Shuttle used to transport freight to the other side of the Earth (see above): 40 megajoules per tonne-kilometre.
- Net energy for lifting: 10 megajoules per tonne-kilometre.
Canadian transportation
Natural Resources Canada's Office of Energy Efficiency publishes annual statistics regarding the efficiency of the entire Canadian fleet. For researchers, these fuel consumption estimates are more realistic than the fuel consumption ratings of new vehicles, as they represent the real world driving conditions, including extreme weather and traffic. The annual report is called Energy Efficiency Trends Analysis. There are dozens of tables illustrating trends in energy consumption expressed in energy per passenger km (passengers) or energy per tonne km (freight).[81]
French environmental calculator
The environmental calculator of the French environment and energy agency (ADEME) published in 2007 using data from 2005[82] enables one to compare the different means of transportation as regards the CO2 emissions (in terms of carbon dioxide equivalent) as well as the consumption of primary energy. In the case of an electric vehicle, the ADEME makes the assumption that 2.58 toe as primary energy are necessary for producing one toe of electricity as end energy in France (see Embodied energy#Embodied energy in the energy field).
This computer tool devised by the ADEME shows the importance of public transportation from an environmental point of view. It highlights the primary energy consumption as well as the CO2 emissions due to transportation. However, nothing is said about the production of radioactive waste. Moreover, intermodal passenger transport is probably a key to sustainable transport, by allowing people to use less polluting means of transportation.
Footnotes
- ↑ "Efficiency". Retrieved 2016-09-18.
- 1 2 3 4 "Assessment of Fuel Economy Technologies for Light-duty Vehicles". The National Academies Press. 2011. ISBN 978-0-309-15607-3. Retrieved 2016-09-18.
- 1 2 "Glossary of energy-related terms". U.S. Department of Energy. Retrieved 2016-09-20.
- ↑ Aeroplane Efficiency, Fédération Aéronautique Internationale, "FAI – The World Air Sports Federation"
- ↑ technology.newscientist.com, graph
- ↑ David Strahan, "Green fuel for the airline industry", New Scientist, 13 August 2008, pp. 34-7.
- 1 2 Mackenzie, Brian. "Energy expenditure for walking and running".
- ↑ EPA (2007). "Appendix B, Transportation Energy Data Book". Retrieved 16 November 2010.
- ↑ "Waw:: a practical sports car :: - mobilitylab.be".
- ↑ "The velomobile: high-tech bike or low-tech car?".
- ↑ "Calculation of conversion from dietary calories per mile to miles per gallon gasoline, using the energy density of gasoline listed by Wolfram Alpha". 2011. Retrieved 19 Jul 2011.
- ↑ "Oak Ridge National Laboratory (ORNL)".
- ↑ "Vehicle Technologies Office - Department of Energy" (PDF).
- ↑ Maps and Data – Metropolitan Transportation Commission for the nine-county San Francisco Bay Area, California
- ↑ "Transport trends: current edition". UK Department for Transport. 8 January 2008. Retrieved 23 March 2008.
- ↑ Beusen; et al. (2009). "Using on-board logging devices to study the long-term impact of an eco-driving course". Transportation Research D. 14: 514–520.
- ↑ "Do lower speed limits on motorways reduce fuel consumption and pollutant emissions?". Retrieved 2013-08-12.
- ↑ "MIT Unveils 90 MPH Solar Race Car".
- ↑ "Vehicle Technologies Office - Department of Energy" (PDF).
- ↑ "Vehicle Technologies Office - Department of Energy" (PDF).
- ↑ "Best on CO2 rankings". UK Department for Transport. Retrieved 2008-03-22.
- ↑ "Vehicle details for Polo 3 / 5 Door (from Nov 06 Wk 45>) 1.4 TDI (80PS) (without A/C) with DPF BLUEMOTION M5". UK Vehicle Certification Agency. Retrieved 22 March 2008.
- ↑ "Vehicle details for Ibiza ( from NOV 06 Wk 45 > ) 1.4 TDI 80PS Ecomotion M5". UK Vehicle Certification Agency. Retrieved 22 March 2008.
- ↑ Jerry Garrett (2006-08-27). "The Once and Future Mileage King". The New York Times.
- ↑ "2008 Toyota Prius". EPA. Retrieved 2007-12-25.
- ↑ "2008 Most and Least Fuel Efficient cars (ranked by city mpg)". United States Environmental Protection Agency and United States Department of Energy. Retrieved 2007-12-25.
- ↑ "Vehicle details for Prius 1.5 VVT-i Hybrid E-CVT". UK Vehicle Certification Agency. Retrieved 2008-03-22.
- 1 2 "2016 Best and Worst Fuel Economy Vehicles".
- 1 2 3 Barney L. Capehart (2007). Encyclopedia of Energy Engineering and Technology, Volume 1. CRC Press. ISBN 0-8493-3653-8, ISBN 978-0-8493-3653-9.
- ↑ "Powerplant." concordesst.com. Retrieved: 2 December 2009.
- ↑ "Technical Specifications: Boeing 747-400". Boeing. Retrieved 11 January 2010.
- ↑ National Aerospace Laboratory
- ↑ Peeters P.M., Middel J., Hoolhorst A. (2005). Fuel efficiency of commercial aircraft An overview of historical and future trends. National Aerospace Laboratory, The Netherlands.
- ↑ "The A380: The future of flying". Airbus. Archived from the original on 2007-12-14. Retrieved 2008-03-22.
- ↑ Bradley, Grant (17 November 2009). "'Shark fin' wings give airline chiefs something to smile about" – via New Zealand Herald.
- ↑ "A320 plane shark fins small winglets successfully completed the first flight test".
- 1 2 "Minix wing tip device promises 6% gain in fuel efficiency for airliners".
- ↑ Ecogeek Article
- ↑ "Boeing to Begin Ground Testing of X-48B Blended Wing Body Concept." Boeing, October 27, 2006. Retrieved: April 10, 2012.
- ↑ Lorenz III, Phillip. "AEDC testing brings unique blended wing aircraft closer to flight." AEDC, U.S. Air Force, July 3, 2007. Retrieved: April 10, 2012.
- ↑ Mahony, Melissa. "A sharkskin coating for ships, planes and blades - ZDNet".
- ↑ Spakovszky, Zoltan (2009). "Unified Propulsion Lecture 1". Unified Engineering Lecture Notes. MIT. Retrieved 2009-04-03.
- ↑ US application 2009020643, Airbus & Christophe Cros, "Aircraft having reduced environmental impact", published 2009-01-22
- ↑ Contact, Experimental Aircraft and Powerplant Newsforum for Designers and Builders, Issue 55, March–April 2000
- ↑ "Tecnam P92 Echo Classic". Tecnam costruzioni aeronautiche s.r.l. Retrieved 22 May 2012.
- ↑ "Tecnam P2002 Sierra De Luxe". Tecnam costruzioni aeronautiche s.r.l. Retrieved 22 May 2012.
- ↑ "Queen Elizabeth 2: Technical Information" (PDF). Cunard Line. Retrieved 2008-03-31.
- ↑ "Cruise Ship Gas Mileage".
- ↑ Emma Mærsk schedules Mærsk, 5 December 2011.
- ↑ "Fuel-Efficiency of Travel in the 20th Century: Appendix-Notes".
- ↑ Fuel Efficiency of Travel in the 20th Century)
- ↑ "Commission for integrated transport, Short haul air v High speed rail".
- ↑ "Rail News August 2016 - For Railroad Career Professionals From Progressive Railroading magazine".
- ↑ freightonrail.co.uk
- ↑ Environmental Goals and Results, JR-East Sustainability Report 2005
- ↑ TGV Duplex assuming 3 intermediate stops between Paris and Lyon.
- ↑ Estimating Emissions from Railway Traffic, page 74
- ↑ Colorado Railcar double-deck DMU hauling two Bombardier Bi-level coaches
- ↑ Colorado Railcar: "DMU Performs Flawlessly on Tri-Rail Service Test"
- ↑ SBB Facts and Figures Traffic
- ↑ European Environment Agency Occupancy Rates, page 3
- ↑ Combino – Low Floor Light Rail Vehicles Tests, Trials and Tangible Results
- 1 2 3 Davis, Stacy C.; Susan W. Diegel; Robert G. Boundy (2011). Transportation Energy Data Book: Edition 30. US Department of Energy. pp. Table 2.14. ORNL-6986 (Edition 30 of ORNL-5198). Retrieved 2012-02-22.
- 1 2 "Eficiência energética: carro ou comboio?".
- ↑ Bus and Rail Final Report
- ↑ "Van Hool presents the ExquiCity Design Mettis.". Retrieved 5 June 2012.
- ↑ "Passenger Transport (Fuel Consumption)". Hansard. UK House of Commons. 2005-07-20. Retrieved 2008-03-25.
- ↑ Demonstration of Caterpillar C-10 Duel-Fuel Engines in MCI 102DL3 Commuter Buses
- ↑ Seara.com. "Indicadores de Atividade".
- ↑ "Crawler-Transporter System".
- ↑ "ATOC".
- ↑ "Delivering a sustainable railway - Publications - GOV.UK".
- ↑ "Energy & Emissions Statement" (PDF).
- ↑ Defra 2008 Guidelines to Defra’s GHG Conversion Factors
- ↑ Kilograms of CO2 per passenger kilometre for different modes of transport within the UK
- ↑ US Environmental protection, 2006
- ↑ Energy Efficiency – Transportation sector (from the United States Department of Energy's Energy Information Administration)
- ↑ Energy Table 2.15
- ↑ "Trends in Fuel Efficiency, Selected Passenger Jet Planes".
- ↑ Rodrigue, Dr. Jean-Paul. "Transportation and Energy".
- ↑ 2010 data
- ↑ (fr) ADEME environmental calculator which informs about the CO2 emissions and the primary energy consumption
See also
- ACEA agreement
- Alternative propulsion
- Corporate Average Fuel Economy (CAFE)
- Carbon dioxide equivalent and emission standard
- Gasoline gallon equivalent
- Gas-guzzler
- Life cycle assessment
External links
- Transportation Research at the National Renewable Energy Laboratory
- ECCM Study for rail, road and air journeys between main UK cities
- Transport Energy Consumption Discussion Paper 2004 – Prof. Roger Kemp
- Traction Summary Report 2007- Prof. Roger Kemp
- Transportation Energy Data Book (US)
- Fuel Consumption Ratings
- Energy Efficiency of different modes of transportation by James Strickland, M.Sc. Standford, 2009