Florida's 2nd congressional district
| Florida's 2nd congressional district |
|---|
| Florida's second congressional district - since January 3, 2015. |
| Current Representative |
|
Gwen Graham (D–Tallahassee) |
| Area |
11,141 mi2 |
| Distribution |
62.1% urban, 37.9% rural |
| Population (2000) |
639,295 |
| Median income |
$34,718 |
| Ethnicity |
71.5% White, 22.1% Black, 1.2% Asian, 3.0% Hispanic, 0.5% Native American, 0.1% other |
| Cook PVI |
R+6 |
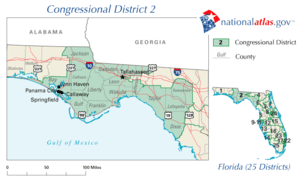
Florida's 2nd congressional district is a congressional district in the U.S. state of Florida. The district consists of the eastern part of the Florida Panhandle along with much of the Big Bend region along the Emerald Coast. It straddles both the Eastern and Central time zones. It is anchored in the state capital of Tallahassee and includes Panama City.
The district is currently represented by Democrat Gwen Graham who is not seeking reelection in 2016.
Characteristics
Florida's 2nd Congressional District consists of all of Bay, Calhoun, Franklin, Gadsden, Gulf, Jackson, Jefferson, Leon, Liberty, Taylor, Wakulla and Washington counties, and portions of Holmes and Madison counties.
The largest population center in the district is Tallahassee, the state capital and county seat of Leon County. While the adjacent 1st and 3rd congressional districts are among the most conservative districts in the state, the 2nd District has historically been more of a swing district. Tallahassee is far more liberal than the rest of the district, and Democrat Barack Obama received 62 percent of the Leon County vote in the 2008 presidential election, but Republican John McCain received 54 percent of the 2nd district's vote overall.[1]
Voting
Voter registration
| Voter Registration and Party Enrollment as of January 3, 2012 |
|---|
| Party |
Voters |
Percentage |
| |
Republican |
158,657 |
34.45% |
| |
Democratic |
234,480 |
50.92% |
| |
No Party Affiliation |
56,039 |
12.17% |
List of representatives
| Representative |
Party |
Years |
District home |
Notes |
| District created March 4, 1875 |
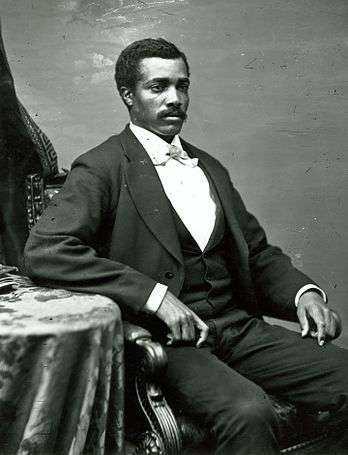 Josiah T. Walls Josiah T. Walls |
Republican |
March 4, 1875 – April 19, 1876 |
|
Redistricted from the At-large district, Lost contested election |
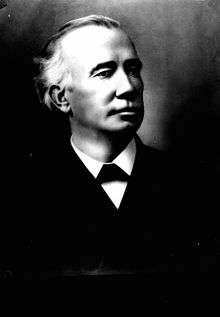
 Jesse J. Finley Jesse J. Finley |
Democratic |
April 19, 1876 – March 3, 1877 |
|
Won contested election |
 Horatio Bisbee, Jr. Horatio Bisbee, Jr. |
Republican |
March 4, 1877 – February 20, 1879 |
|
Lost contested election |
| Jesse J. Finley |
Democratic |
February 20, 1879 – March 3, 1879 |
|
Won contested election |
 Noble A. Hull Noble A. Hull |
Democratic |
March 4, 1879 – January 22, 1881 |
|
Lost contested election |
| Horatio Bisbee, Jr. |
Republican |
January 22, 1881 – March 3, 1881 |
|
Won contested election |
| Jesse J. Finley |
Democratic |
March 4, 1881 – June 1, 1882 |
|
Lost contested election |
| Horatio Bisbee, Jr. |
Republican |
June 1, 1882 – March 3, 1885 |
|
Won contested election |
 Charles Dougherty Charles Dougherty |
Democratic |
March 4, 1885 – March 3, 1889 |
|
|
 Robert Bullock Robert Bullock |
Democratic |
March 4, 1889 – March 3, 1893 |
|
|
 Charles M. Cooper Charles M. Cooper |
Democratic |
March 4, 1893 – March 3, 1897 |
|
|
 Robert W. Davis Robert W. Davis |
Democratic |
March 4, 1897 – March 3, 1905 |
|
|
 Frank Clark Frank Clark |
Democratic |
March 4, 1905 – March 3, 1925 |
|
|
 Robert A. Green Robert A. Green |
Democratic |
March 4, 1925 – January 3, 1943 |
|
Redistricted to the At-large district |
 Emory H. Price Emory H. Price |
Democratic |
January 3, 1943 – January 3, 1949 |
|
|
 Charles E. Bennett Charles E. Bennett |
Democratic |
January 3, 1949 – January 3, 1967 |
|
Redistricted to the 3rd district |
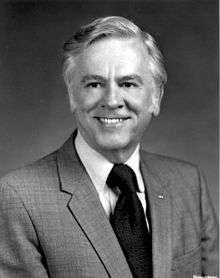
 Don Fuqua Don Fuqua |
Democratic |
January 3, 1967 – January 3, 1987 |
|
Redistricted from the 9th district |
 James W. Grant James W. Grant |
Democratic |
January 3, 1987 – February 21, 1989 |
|
Changed political affiliation |
| Republican |
February 21, 1989 – January 3, 1991 |
Defeated |
 Pete Peterson Pete Peterson |
Democratic |
January 3, 1991 – January 3, 1997 |
|
Retired |
 Allen Boyd Allen Boyd |
Democratic |
January 3, 1997 – January 3, 2011 |
Monticello |
Defeated |
 Steve Southerland Steve Southerland |
Republican |
January 3, 2011 – January 3, 2015 |
Panama City |
Defeated |
.jpg) Gwen Graham Gwen Graham |
Democratic |
January 3, 2015 – January 3, 2017 |
Tallahassee |
Retiring |
| Neal Dunn |
Republican |
January 3, 2017 – |
Panama City |
|
Election results
2002
Florida's 2nd Congressional District Election (2002)
| Party |
Candidate |
Votes |
% |
|
Democratic |
Allen Boyd* |
152,164 |
66.90 |
|
Republican |
Tom McGurk |
75,275 |
33.10 |
| Total votes |
227,439 |
100.00 |
| Voter turnout |
% |
|
Democratic hold |
2004
Florida's 2nd Congressional District Election (2004)
| Party |
Candidate |
Votes |
% |
|
Democratic |
Allen Boyd* |
201,577 |
61.65 |
|
Republican |
Bev Kilmer |
125,399 |
38.35 |
| Total votes |
326,976 |
100.00 |
| Voter turnout |
% |
|
Democratic hold |
2006
Florida's 2nd Congressional District Election (2006)
| Party |
Candidate |
Votes |
% |
|
Democratic |
Allen Boyd* |
' |
100.00 |
| Total votes |
' |
100.00 |
| Voter turnout |
% |
|
Democratic hold |
2008
Florida's 2nd Congressional District Election (2008)
| Party |
Candidate |
Votes |
% |
|
Democratic |
Allen Boyd* |
216,804 |
61.88 |
|
Republican |
Mark Mulligan |
133,404 |
38.08 |
|
No party |
Others |
159 |
0.05% |
| Total votes |
350,367 |
100.00 |
| Voter turnout |
% |
|
Democratic hold |
2010
2012
2014
Living former Members of the U.S. House of Representatives from Florida's 2nd congressional district
As of May 2015, there are four former members of the U.S. House of Representatives from Florida's 2nd congressional district who are currently living at this time.
Historical district boundaries
References
Notes
External links
Coordinates: 30°16′58″N 84°43′49″W / 30.28278°N 84.73028°W / 30.28278; -84.73028
.tif.png)