Fishing down the food web
Fishing down the food web is the process whereby fisheries in a given ecosystem, "having depleted the large predatory fish on top of the food web, turn to increasingly smaller species, finally ending up with previously spurned small fish and invertebrates."[1]
The process was first demonstrated by the fisheries scientist Daniel Pauly and others in an article published in the journal Science in 1998.[2] Large predator fish with higher trophic levels have been depleted in wild fisheries. As a result, the fishing industry has been systematically "fishing down the food web", targeting fish species at progressively decreasing trophic levels.
The trophic level of a fish is the position it occupies on the food chain. The article establishes the importance of the mean trophic level of fisheries as a tool for measuring the health of ocean ecosystems. In 2000, the Convention on Biological Diversity selected the mean trophic level of fisheries catch, renamed the "Marine Trophic Index" (MTI), as one of eight indicators of ecosystem health. However, many of the world's most lucrative fisheries are crustacean and mollusk fisheries, which are at low trophic levels and thus result in lower MTI values.[3]
Overview
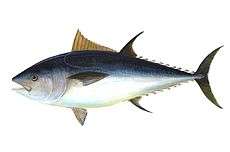


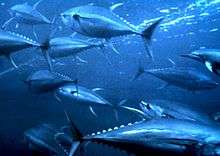
Over the last 50 years, the abundance of large predator fish, such as cod, swordfish and tuna, has dropped 90 percent.[5] Fishing vessels now increasingly pursue the smaller forage fish, such as herrings, sardines, menhaden and anchovies, that are lower on the food chain.[2] “We are eating bait and moving on to jellyfish and plankton” says Pauly.[6] Beyond this, the overall global volume of fish captured has been declining since the late 1980s.[7]
Mean trophic level
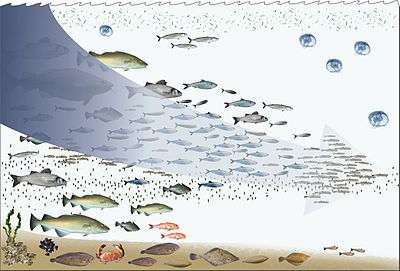
The mean trophic level is calculated by assigning each fish or invertebrate species a number based on its trophic level. The trophic level is a measure of the position of an organism in a food web, starting at level 1 with primary producers, such as phytoplankton and seaweed, then moving through the primary consumers at level 2 that eat the primary producers to the secondary consumers at level 3 that eat the primary consumers, and so on. In marine environments, trophic levels range from two to five for the apex predators.[8] The mean trophic level can then be calculated for fishery catches by averaging trophic levels for the overall catch using the datasets for commercial fish landings.[9][10]
Ecopath
Pauly's team used the catch data from the FAO[11] which it fed into an Ecopath model. Ecopath is a computerised ecosystem modelling system.[12] The functioning of an ecosystem can be described using path analysis to track the direction and influence of the many factors controlling the ecosystem. The original Ecopath model was applied to a coral reef food web. Scientists tracked tiger sharks at the top of the food web and collected data on their feeding behaviour, what they ate and how much. Likewise, they collected feeding data on the other organisms in the food chains down to the primary producers, such as algae. This data was fed into an Ecopath model, which then described the energy flow, in terms of food, as it moved from the primary producers up the food web to the apex predator. Such models allow scientists to compute the complex effects that occur, both direct and indirect, from the interactions of the many ecosystem components.[13]
The model showed that over the last 50 years the mean trophic level of fish catches has declined by somewhere between 0.5 and 1.0 trophic levels.[2] This decline applied both globally, on a worldwide scale, and more locally on a scale specific to oceans, that is, for the separate FAO subareas: the Atlantic, Indian and Pacific Oceans, and the Mediterranean-Black Seas.[14]
FAO critical rejoinder
Pauly's team argued in their 1998 paper that the larger, more valuable predatory fish, such as tuna, cod and grouper, had been systematically overfished, with the result that fishing effort was shifting to less desirable species further down the food chain. This "fishing down the food web," said Pauly, would in time reduce people to a diet of "jellyfish and plankton soup". The colourful language and innovative statistical modelling by Pauly's team triggered critical reactions. Later in the same year, Caddy and his team from the FAO argued a counter position in a paper also published in Science. They argued that Pauly's team had oversimplified the situation and may have "misinterpreted the FAO statistics".[15] The response of Pauly's team was published in the same paper, claiming that the corrections suggested by the FAO, such as accounting for aquaculture, actually made the trend worse.[16]
The concerns raised by the FAO were further countered by Pauly and others in 2005.[9][17] Other researchers have established that "fishing down" also applies to smaller, regional areas, such as the Mediterranean, North Sea, Celtic Sea, and in Canadian, Cuban and Icelandic waters.[17]
Marine Trophic Index
|
|
In 2000, the Convention on Biological Diversity, an international treaty aimed at sustaining biodiversity which has been adopted by 193 member countries, selected the mean trophic level of fisheries catch as one of eight indicators for immediate testing. They renamed it the "Marine Trophic Index" (MTI), and have mandated that member countries report over time on changes in ocean trophic levels as a primary indicator of marine biodiversity and health.[18][19]
The Marine Trophic Index is a measure of the overall health and stability of a marine ecosystem or area. The index is also a proxy measure for overfishing and an indication of how abundant and rich the large, high trophic level fish are.[20]
Changes in the Marine Trophic Index over time can function as an indicator of the sustainability of a country’s fish resources. It can indicate the extent that the fishing effort within a country's fishing grounds is modifying its fish stocks. A negative change generally indicates that larger predator fish are becoming depleted, and an increasing number of smaller forage fish are being caught. A zero or positive change in the Marine Trophic Index indicates the fishery is stable or improving.[9]
Ecology of fishing down
Fishing down is a succession which reverses the usual evolutionary sequence.
It consists of a gradual loss of large organisms, species diversity, and structural diversity, and a gradual replacement of recently evolved, derived groups (marine mammals, bony fishes) by more primitive groups (invertebrates, notably jellyfishes, and bacteria). – Daniel Pauly[19]
Ecologically, the decline in the mean trophic level is explained by the relationship between the size of the fish captured and their trophic level. The trophic level of fishes usually increases with their size, and fishing tends to selectively capture the larger fishes. This applies both between species as well as within species. When the fishing is intense, the relative abundance of the larger fish positioned high in the food chain is reduced. Consequently, over time, small fishes start to dominate the fisheries catches, and the mean trophic level of the catches declines.[14] Recently the market value of small forage fishes and invertebrates, which have low trophic levels, has sharply increased to the point where they can be considered to be subsidizing fishing down.[19]
Daniel Pauly has suggested a framework for the ecological impacts fishing down can have on marine ecosystems. The framework distinguishes three phases:[19]
- Pristine – the first phase. Pristine environments are the states ocean ecosystem were in before fishing made strong impacts. Some outlier areas of the South Pacific may still be pristine. For most of the world what these pristine states may have been can only be inferred from archaeological data, historical accounts and anecdotes. In pristine ocean environments, the biomass of the large predator fish are 10 to 100 times greater than their present biomass. This implies a large supporting biomass of small prey fishes and invertebrates. On the seafloor, the benthos is dominated by deposit feeders which prevent resuspension of sediments, and filter feeders which keep the phytoplankton down. Thus the water column tends to be oligotrophic, free of both suspended particles and of the nutrients that leach from them.[19]
- Exploited – the second phase. Exploited is the phase we are currently in. It is characterized by declines in the biomass of large predator fish, declines in the diversity, size and trophic level of captured fish, and declines in the benthos. Bottom trawlers progressively destroy the biogenic structures built over many years on the seafloor by the filter and detritus feeders. As these structures and animals that were filtering the phytoplankton and consuming the detritus (marine snow) disappear, they are replaced with the polyp stages of jellyfish and other small errant benthic animals. Storms resuspend the marine snow, and the water column gradually eutrophies. In the early part of this phase, cascade effects compensate these declines with the emergence of new fisheries for opportunistic feeders, such as squid, shrimp and other invertebrates. But eventually this decline also.[19]
- Fully degraded – the third phase. The dead zone is the biological endpoint of a fully degraded marine ecosystem. The dead zone is a zone with excessive nutrients in the water column, resulting in the depletion of oxygen and the elimination of multicellular organisms. The abundant detritus and marine snow are processed by bacteria rather than by the benthic animals. These dead zones are currently growing throughout the world in places such as the Bohai Sea in China, the northern Adriatic Sea, and the northern Gulf of Mexico. Some estuaries, such as the Chesapeake Bay estuary, also display features associated with a fully degraded marine ecosystem. In the Chesapeake Bay, overfishing eliminated the benthic filter feeders such as oysters, and most predators larger than a striped bass, the current apex predator. One hundred and fifty years ago, the oysters formed giant reefs and filtered the waters of Chesapeake Bay every three days. Because the oysters are gone, pollution entering the estuary from rivers now produces harmful algal blooms.[19]
Fishing through the web
- Essington† TE, Beaudreau AH, Wiedenmann J (2006) "Fishing through marine food webs" PNAS, 103 (9): 3171-3175.
- Shopping list gets longer -- not less choosy -- in some of world's largest fisheries University of Washington news, February 14, 2006.
- National Research Council (Authors) (2006) Dynamic Changes in Marine Ecosystems: Fishing, Food Webs, and Future Options National Academies Press. ISBN 978-0-309-10050-2
Farming up the web
While the mean trophic level in wild fisheries has been decreasing, the mean trophic level amongst farmed fish has been increasing.[21]
| Herbivores | Intermediate predators | Top-level predators |
|---|---|---|
| The production of bivalves, such as mussels and oysters, increased from about 2,000 tonnes in 1970 to 100,000 tonnes in 2004 | The mariculture of species such as sea bream increased from 20 tonnes in 1983 to 140,000 tonnes in 2004 | The production of the bluefin tuna has gone from almost zero in 1986 to 30,000 tonnes by 2005 |
As an example, the table above shows trends in the trophic levels of fish farmed in the Mediterranean. However, the farming of bluefin tuna is restricted to a fattening process. Juvenile tuna are captured from the wild and put in pens for fattening. Wild stocks of bluefin are now threatened, and the fisheries scientist Konstantinos Stergiou and colleagues argue that the “fact that the capacity of tuna farms greatly exceeds the total allowable catch indicates lack of conservation planning in development of the tuna-fattening industry, which, ideally, should have been linked to fisheries management policies, and may lead to illegal fishing."[14]
Also, fish farming in the Mediterranean is a net fish consumer. Large amounts of animal feed are needed to feed a high trophic fish like the bluefin tuna. This feed consists of fishmeal processed from forage fishes like sardines and anchovies that humans would otherwise consume directly. In addition to ecological issues, this raises ethical issues. Much of the fish suitable for direct human consumption is being used to grow higher trophic level fish to indulge a relatively small group of affluent consumers.[14]
See also
- Biodiversity
- Shifting baselines
- 2010 Biodiversity Indicators Partnership
- List of harvested aquatic animals by weight
Notes
- ↑ Pauly, Daniel and Watson, Reg (2009) "Spatial Dynamics of Marine Fisheries" In: Simon A. Levin (ed.) The Princeton Guide to Ecology. Pages 501–509.
- 1 2 3 Pauly D, Christensen V, Dalsgaard J, Froese R and Torres F (1998) "Fishing down marine food webs" Science, 279: 860-863.
- ↑ "Global fishery development patterns are driven by profit but not trophic level"
- ↑ Jellyfish for lunch? It's no joke, says scientist Seattle Post-Intelligencer, May 4, 2004.
- ↑ Myers RA and Worm B (2003) "Rapid worldwide depletion of predatory fish communities" Nature 423: 280-283.
- ↑ UBC PublicAffairs: News 5 October 2006.
- ↑ Watson, R and Pauly D (2001) "Systematic distortions in world fisheries catch trends" Nature 414: 534-536.
- ↑ A users’ guide to biodiversity indicators Page 38. European Academy of Science, Advisory Council, 2004.
- 1 2 3 Pauly D and Watson R (2005) "Background and interpretation of the ‘Marine Trophic Index’ as a measure of biodiversity" Philosophical Transactions of the Royal Society: Biological Sciences 360: 415-423.
- ↑ Yale Center for Environmental Law and Policy: Environmental Performance Index: Marine Trophic Index 2008.
- ↑ FAO Statistics FishBase. Retrieved 22 March 2010.
- ↑ Pauly D, Christensen V and Walters C (2000) "Ecopath, Ecosim, and Ecospace as tools for evaluating ecosystem impact of fisheries" ICES Journal of Marine Science, 57: 697–706.
- ↑ ECOPATH Modeling: Precursor to an Ecosystem Approach to Fisheries Management NOAA
- 1 2 3 4 Stergiou KI (2005) Fisheries impact on trophic levels: long-term trends in Hellenic waters pp. 326-329. In: Papathanassiou E, Zenetos A (Eds) State of the Hellenic marine environment, Hellenic Centre for Marine Research, Athens, Greece.
- ↑ Caddy JF, Csirke J, Garcia SM and Grainger JRJ (1998) "How Pervasive Is "Fishing Down Marine Food Webs"?" Science, 282 (5393): 1383.
- ↑ David Malakoff M (2002) "Daniel Pauly profile: Going to the Edge to Protect the Sea" Science, 296 (5567): 458-461.
- 1 2 Pauly, D. and M.L. Palomares (2005) "Fishing down marine food webs: it is far more pervasive than we thought" Bulletin of Marine Science 76(2): 197-211.
- ↑ Jacquet JL (2008) Fishing Down the Food Web Turns 10! Shifting Baselines.
- 1 2 3 4 5 6 7 Pauly, D. 2005. "The ecology of fishing down marine food webs" Society for Conservation Biology Newsletter, 12 (4).
- ↑ Marine Trophic Index Conference Board of Canada. Retrieved 22 March 2010.
- ↑ Pauly D, Tyedmers P, Froese R and Liu Y (2001) "Fishing down and farming up the food web" Conservation Biology in Practice 2 (4): 25.
- ↑ Stergiou KI, Tsikliras AC and Pauly D (2009) Farming Up the Food Web in the Mediterranean Conservation Biology, 23(11): 230-232. Upload
References
- 2010 Biodiversity Indicators Partnership – main website
- Pauly, D., V. Christensen, R. Froese and M.L.D. Palomares (2000) "Fishing down aquatic food webs" American Scientist, 88: 46-51.
- Christensen V (1996) "Managing fisheries involving top predator and prey species components" Review in Fish Biology and Fisheries, 6:417-442. (First published description of "fishing down the food web" concept)
- Bhathal, B. and D. Pauly (2008) "‘Fishing down marine food webs’ and spatial expansion of coastal fisheries in India, 1950-2000" Fisheries Research, 91: 26-34.
- Morato, T., R. Watson, T.J. Pitcher and D. Pauly (2006) "Fishing down the deep" Fish and Fisheries 7(1): 24-34.
- Cury, P. M., L.J. Shannon, J.-P. Roux, G. Daskalov, A. Jarre, D. Pauly and C.L Moloney (2005) "Trophodynamic indicators for an ecosystem approach to fisheries" ICES Journal of Marine Science '62: 430-442.
- Pauly, D., and R. Watson. 2005. "Background and interpretation of the 'Marine Trophic Index' as a measure of biodiversity" Philosophical Transactions of the Royal Society: Biological Sciences 360: 415-423.
- Christensen, V. and D. Pauly (2004) "Placing fisheries in their ecosystem context, an introduction" Ecological Modelling 172: 103-107.
- Christensen, V., S. Guénette, J. J. Heymans, C.J. Walters, R. Watson, D. Zeller and D. Pauly (2003) "Hundred-year decline of North Atlantic predatory fishes" Fish and Fisheries 4(1): 1-24.
- Pauly, D., J. Alder, E. Bennett, V. Christensen, P. Tyedmers and R. Watson (2003) "The future for fisheries" Science 302: 1359-1361.
- Pauly, D. M.L. Palomares, R. Froese, P. Sa-a, M. Vakily, D. Preikshot, and S. Wallace 2001) "Fishing down Canadian aquatic food webs" Canadian Journal of Fisheries and Aquatic Science 58: 51-62.
External links
- Fishing Down Marine Food Webs Sea Around Us Project, University of British Columbia. A website dedicated to fishing down.
- Fishing down food chain' fails global test Scientific American, 10 November 2010.