The aim of this page is to act as a comparison between the sovereign states of Europe regarding economic, financial and social factors.
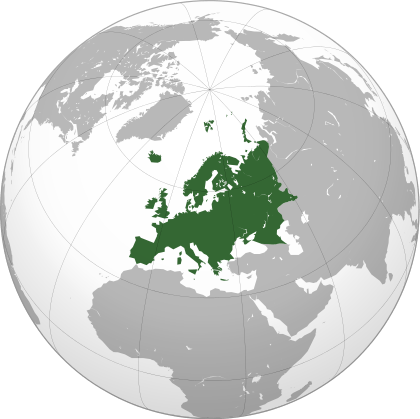
Map of Europe according to the United Nations Geoscheme for Europe
Definition of Europe
For the purposes of comparison the broader definition of Europe will be used. A sovereign state must meet at least one of the following criteria to be included:
Economic
Countries by GDP (nominal)

Volkswagen AG's headquarters in Wolfsburg is the base for Germany's largest company by revenue

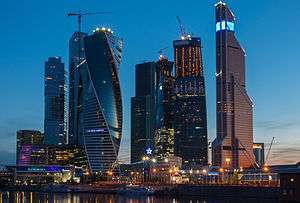
London is considered (along with New York City) to be the world's leading financial capital, with the UK set to become Europe's largest economy by 2030
Data provided is by the International Monetary Fund (2013)[1]
| Rank | Country | GDP (Millions of US$) |
|---|
| |  European Union[n 1] European Union[n 1] | 17,512,109 |
| 1 |  Germany Germany | 3,635,959 |
| 2 |  France France | 2,807,306 |
| 3 |  United Kingdom United Kingdom | 2,523,216 |
| 4 |  Russia Russia | 2,096,774[n 2] |
| 5 |  Italy Italy | 2,071,955 |
| 6 |  Spain Spain | 1,358,687 |
| 7 |  Netherlands Netherlands | 853,806 |
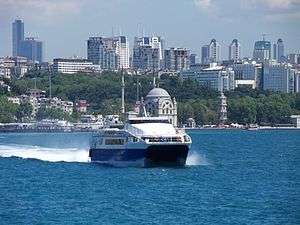
| 8 |  Turkey Turkey | 819,990 |
| 9 |  Switzerland Switzerland | 650,431 |
| 10 |  Sweden Sweden | 558,949 |
| 11 |  Poland Poland | 517,705 |
| 12 |  Norway Norway | 512,581 |
| 13 | .svg.png) Belgium Belgium | 508,275 |
| 14 |  Austria Austria | 416,062 |
| 15 |  Denmark Denmark | 330,614 |
| 16 |  Finland Finland | 267,412 |
| 17 |  Greece Greece | 241,796 |
| 18 |  Ireland Ireland | 232,150 |
| 19 |  Portugal Portugal | 220,062 |
| 20 |  Czech Republic Czech Republic | 198,450 |
| 21 |  Romania Romania | 188,893 |
| 22 |  Ukraine Ukraine | 178,313 |
| 23 |  Hungary Hungary | 132,260 |
| 24 |  Slovakia Slovakia | 95,805 |
| 25 |  Azerbaijan Azerbaijan | 73,537 |
| 26 |  Belarus Belarus | 71,710 |
| 27 |  Luxembourg Luxembourg | 60,402 |
| 28 |  Croatia Croatia | 57,371 |
| 29 |  Bulgaria Bulgaria | 53,046 |
| 30 |  Slovenia Slovenia | 48,005 |
| 31 |  Lithuania Lithuania | 46,507 |
| 32 |  Serbia Serbia | 42,492 |
| 33 |  Latvia Latvia | 30,953 |
| 34 |  Estonia Estonia | 24,888 |
| 35 |  Cyprus Cyprus | 21,919 |
| 36 |  Bosnia and Herzegovina Bosnia and Herzegovina | 17,828 |
| 37 |  Georgia Georgia | 16,162 |
| 38 |  Iceland Iceland | 14,656 |
| 39 |  Albania Albania | 12,724 |
| 40 |  Armenia Armenia | 10.431 |
| 41 |  Macedonia Macedonia | 10,238 |
| 42 |  Malta Malta | 9,545 |
| 43 |  Moldova Moldova | 7,935 |
| 44 |  Monaco Monaco | 6,075[n 3] |
| 45 |  Liechtenstein Liechtenstein | 4,826[n 3] |
| 46 |  Montenegro Montenegro | 4,377 |
| 47 |  Andorra Andorra | 3,712[n 3] |
| 48 |  San Marino San Marino | 1,802 |
Projected GDP (nominal)
Data provided is from December 2014 update by the Centre for Economics and Business Research.
[2]
2019
| Rank | Country | GDP (Millions of US$) |
|---|
| 1 | Germany | 3,519,000 |
| 2 | United Kingdom | 2,953,000 |
| 3 | France | 2,666,000 |
| 4 | Russia | 2,246,000 |
| 5 | Italy | 1,936,000 |
| 6 | Spain | 1,242,000 |
| 7 | Turkey | 1,052,000 |
| 8 | Switzerland | 816,000 |
| 9 | Sweden | 788,000 |
| 10 | Netherlands | 766,000 |
|
|
2024
| Rank | Country | GDP (Millions of US$) |
|---|
| 1 | Germany | 3,953,000 |
| 2 | United Kingdom | 3,645,000 |
| 3 | France | 3,039,000 |
| 4 | Russia | 2,816,000 |
| 5 | Italy | 2,155,000 |
| 6 | Turkey | 1,564,000 |
| 7 | Spain | 1,382,000 |
| 8 | Sweden | 1,067,000 |
| 9 | Poland | 975,000 |
| 10 | Switzerland | 966,000 |
|
|
2029
| Rank | Country | GDP (Millions of US$) |
|---|
| 1 | Germany | 4,324,000 |
| 2 | United Kingdom | 4,281,000 |
| 3 | France | 3,395,000 |
| 4 | Russia | 3,295,000 |
| 5 | Italy | 2,356,000 |
| 6 | Turkey | 2,343,000 |
| 7 | Spain | 1,513,000 |
| 8 | Sweden | 1,438,000 |
| 9 | Poland | 1,284,000 |
| 10 | Switzerland | 1,137,000 |
|
|
2030
| Rank | Country | GDP (Millions of US$) |
|---|
| 1 | United Kingdom | 4,421,000 |
| 2 | Germany | 4,397,000 |
| 3 | France | 3,469,000 |
| 4 | Russia | 3,383,000 |
| 5 | Turkey | 2,547,000 |
| 6 | Italy | 2,397,000 |
| 7 | Spain | 1,540,000 |
| 8 | Sweden | 1,526,000 |
| 9 | Poland | 1,357,000 |
| 10 | Switzerland | 1,175,000 |
|
|
GDP growth rate

Sweden is possibly the only developed European economy which is seen to continually grow

Azerbaijan is among the fastest growing economies in Europe, in part due to the country's growing energy sector
Turkey will overtake Italy to become Europe's fifth largest economy by 2030, with many predicting Turkey will become a great power in European politics
The real GDP growth rates provided are the 2015 estimates (unless otherwise indicated) as recorded in the CIA World Factbook.[3]
GDP (nominal) per capita

Monaco is home to one of the world's wealthiest populations, and has the highest level of GDP per capita in Europe

Like Monaco, the small size of Liechtenstein has led to it being among the highest ranked European states for GDP per capita
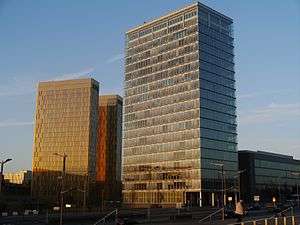
Luxembourg is home to an established financial sector as well as one of Europe's richest populations

Despite having the highest GDP growth rate in Europe, Moldova is among its poorest states, and also has Europe's smallest GDP per capita
The GDP (nominal) per capita values provided are the 2013 figures (unless otherwise indicated) as recorded in the CIA World Factbook.[4]
| Rank | Country | GDP per capita (US$) |
|---|
| 1 | Monaco | 159,400 |
| 2 | Liechtenstein | 139,300 |
| 3 | Luxembourg | 110,700 |
| 4 | Norway | 101,400 |
| 5 | Switzerland | 80,800 |
| 6 | Denmark | 58,300 |
| 7 | San Marino | 57,900 |
| 8 | Sweden | 57,200 |
| 9 | Finland | 49,200 |
| 10 | Austria | 49,100 |
| 11 | Netherlands | 47,600 |
| 12 | Andorra | 46,418[n 4] |
| 13 | Iceland | 46,200 |
| 14 | Ireland | 46,000 |
| 15 | Belgium | 45,600 |
| 16 | Germany | 44,300 |
| 17 | France | 41,700 |
| 18 | United Kingdom | 39,600 |
| | European Union[n 1] | 34,000 |
| 19 | Italy | 33,600 |
| 20 | Spain | 28,600 |
| 21 | Cyprus | 25,200 |
| 22 | Slovenia | 22,700 |
| 23 | Malta | 22,600 |
| 24 | Greece | 21,800 |
| 25 | Portugal | 21,000 |
| 26 | Czech Republic | 18,861[n 4] |
| 27 | Estonia | 18,300 |
| 28 | Slovakia | 17,700 |
| 29 | Latvia | 15,400 |
| 30 | Lithuania | 15,300 |
| 31 | Russia | 14,600 |
| 32 | Croatia | 13,400 |
| 33 | Poland | 13,300 |
| 34 | Hungary | 13,100 |
| 35 | Turkey | 10,700 |
| 36 | Romania | 8,900 |
| 37 | Azerbaijan | 7,900 |
| 38 | Belarus | 7,500 |
| 39 | Bulgaria | 7,300 |
| 40 | Montenegro | 6,800 |
| 41 | Serbia | 6,000 |
| 42 | Macedonia | 5,000 |
| 43 | Bosnia and Herzegovina | 4,800 |
| 44 | Albania | 4,400 |
| 45 | Ukraine | 3,800 |
| 46 | Georgia | 3,600 |
| 47 | Armenia | 3,400 |
| 48 | Moldova | 2,200 |
GDP (PPP)
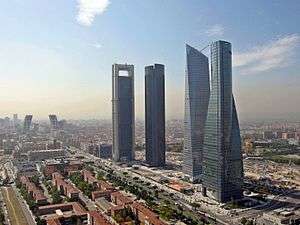
Madrid is the financial capital of Spain, and one of the most important financial centres in Europe
Data provided is by the International Monetary Fund (2013)[5]
Net National Wealth

Tourism to monuments such as the Eiffel Tower is important to the French economy

Along with Zurich, Geneva is one of Switzerland's leading financial centres, with both cities also being among the most important service orientated cities in world
The top 15 estimates are part of the 2014 data by Credit Suisse.[6]
| Rank | Country | GDP (Billions of US$) |
|---|
| 1 | France | 15,304 |
| 2 | United Kingdom | 14,157 |
| 3 | Germany | 14,156 |
| 4 | Italy | 12,580 |
| 5 | Spain | 5,033 |
| 6 | Switzerland | 3,554 |
| 7 | Netherlands | 2,722 |
| 8 | Belgium | 2,529 |
| 9 | Sweden | 2,436 |
| 10 | Russia | 2,156 |
| 11 | Austria | 1,529 |
| 12 | Norway | 1,345 |
| 13 | Denmark | 1,230 |
| 14 | Turkey | 1,061 |
| 15 | Greece | 1,015 |
Financial
Current account balance
The current account balance values provided are the 2013 figures (unless otherwise indicated) as recorded in the CIA World Factbook.[7] Figures for Andorra, Liechtenstein, Monaco and San Marino are unavailable.
| Rank | Country | Current Account Balance (US$) |
|---|
| 1 | Germany | 257,100,000,000 |
| 2 | Russia | 74,800,000,000 (2012 est.) |
| 3 | Norway | 67,400,000,000 |
| 4 | Netherlands | 65,870,000,000 |
| 5 | Switzerland | 65,600,000,000 |
| 6 | Sweden | 39,000,000,000 |
| 7 | Denmark | 19,600,000,000 |
| 8 | Azerbaijan | 13,280,000,000 |
| 9 | Austria | 10,600,000,000 |
| 10 | Ireland | 7,300,000,000 |
| 11 | Slovakia | 3,315,000,000 |
| 12 | Slovenia | 2,954,000,000 |
| 13 | Luxembourg | 2,700,000,000 |
| 14 | Spain | 2,100,000,000 |
| 15 | Greece | 2,021,000,000 |
| 16 | Hungary | 1,722,000,000 |
| 17 | Portugal | 1,000,000,000 |
| 18 | Malta | 133,100,000 |
| 19 | Iceland | -100,000,000 |
| 20 | Croatia | -102,300,000 |
| 21 | Bulgaria | -182,300,000 |
| 22 | Macedonia | -194,100,000 |
| 23 | Estonia | -352,300,000 |
| 24 | Cyprus | -358,200,000 |
| 25 | Moldova | -507,700,000 |
| 26 | Lithuania | -567,000,000 |
| 27 | Latvia | -613,900,000 |
| 28 | Armenia | -720,600,000 |
| 29 | Bosnia and Herzegovina | -939,500,000 |
| 30 | Albania | -1,280,000,000 |
| 31 | Georgia | -1,375,000,000 |
| 32 | Serbia | -1,807,000,000 |
| 33 | Montenegro | -1,938,000,000 (2012 est.) |
| 34 | Romania | -1,986,000,000 |
| 35 | Finland | -2,000,000,000 |
| 36 | Italy | -2,400,000,000 |
| 37 | Czech Republic | -3,270,000,000 |
| 38 | Belarus | -4,245,000,000 |
| 39 | Belgium | -9,100,000,000 |
| 40 | Poland | -11,060,000,000 |
| 41 | Ukraine | -11,920,000,000 |
| | European Union[n 1] | -34,490,000,000 (2011 est.) |
| 42 | Turkey | -58,350,000,000 |
| 43 | France | -58,970,000,000 |
| 44 | United Kingdom | -93,600,000,000 |
Public debt
The public debt values provided are the 2013 figures (unless otherwise indicated) as recorded in the CIA World Factbook.[8] Figures for Liechtenstein and Monaco are unavailable.
Unemployment rate
The unemployment rate values provided are the most recent figures provided by varying sources, namely data released by state Governments.
Average wage
The average wage values provided are 2014 figures (unless otherwise stated) as recorded by varying sources, namely releases by respective Governments. The values are for monthly average wage (annual wage divided by 12 months) for net income (after taxes) in Euro currency.
| Rank | Country | Net wage (Euro €) |
|---|
| 1 | Liechtenstein | 6,003 (2010) |
| 2 | Switzerland | 5049 (2011) |
| 3 | Monaco | 4,436 (2012) |
| 4 | Norway | 4,424 (2013) |
| 5 | Luxembourg | 3,189 (2010) |
| 6 | Denmark | 3,122 (2012) |
| 7 | Sweden | 2,835 |
| 8 | United Kingdom | 2,723 (2013) |
| 9 | San Marino | 2,390 (2013) |
| 10 | Finland | 2,330 |
| 11 | Iceland | 2,253 |
| 12 | Andorra | 2,230 (2012) |
| 13 | Ireland | 2,160 (2013) |
| 14 | Netherlands | 2,136 (2012) |
| 15 | France | 2,128 (2011) |
| 16 | Austria | 2,114 (2012) |
| 17 | Germany | 2,054 (2013) |
| 18 | Belgium | 1,946 (2013) |
| 19 | Italy | 1,923 |
| 20 | Cyprus | 1,833 (2013) |
| 21 | Spain | 1,734 (2013) |
| 22 | Malta | 1,092 (2013) |
| 23 | Slovenia | 1,044 (2012) |
| 24 | Greece | 1,004 (2013) |
| 25 | Portugal | 985 |
| 26 | Estonia | 903(2015) |
| 27 | Poland | 739 |
| 28 | Croatia | 710 |
| 29 | Czech Republic | 702 |
| 30 | Slovakia | 647 |
| 31 | Turkey | 632 (2012) |
| 32 | Latvia | 566 |
| 33 | Lithuania | 541 |
| 34 | Hungary | 487 |
| 35 | Montenegro | 486 (2013) |
| 36 | Bosnia and Herzegovina | 423 (2013) |
| 37 | Azerbaijan | 402 |
| 38 | Romania | 398 (2013) |
| 39 | Georgia | 385 (2013) |
| 40 | Russia | 378 |
| 41 | Serbia | 373 |
| 42 | Macedonia | 353 |
| 43 | Bulgaria | 332 (2013) |
| 44 | Belarus | 327 (2015) |
| 45 | Albania | 320 (2013) |
| 46 | Armenia | 232 |
| 47 | Moldova | 199 |
| 48 | Ukraine | 162 (2015) |
Minimum wage
The minimum wage figures provided are the 2013 figures by The Federation of International Employers. Currency conversions from non-Euro currencies being based on the exchange rates of 2012.[9]
Social
Human Development Index
The Human Development Index values provided are the 2014 estimates for 2013 (unless otherwise stated), as included in the United Nations Development Programme's Human Development Report.[10]
Percentage living below poverty line
The percentage figures for citizens living below the poverty line are the latest available as provided by either the CIA World Factbook or the World Bank.[11][12][13] There is no data available for eleven European states.
Social Progress Index
The Social Progress Index figures are provided by the nonprofit Social Progress Imperative and represent 2014. Eight European states are not represented as data is not available.[14]
Opportunity
The Opportunity figures are included in the 2014 Social Progress Index by the nonprofit Social Progress Imperative. Eight European states are not represented as data is not available[14]
World Happiness Report
The World Happiness Report is a measure of happiness published by the United Nations Sustainable Development Solutions Network, with the figures provided being the 2013 edition for the 2010 to 2012 period.[15]
Summary
Economic
- Azerbaijan is the second fastest growing economy in Europe, and the fastest growing transcontinental economy
- Cyprus is the weakest growing economy in Europe, the European Union, the Eurozone and the European members of the Commonwealth of Nations
- France has the highest Net National Wealth of any European state
- Germany is the current largest economy in Europe, the European Union and the Eurozone, with Germany remaining the Eurozone's largest economy even once the United Kingdom has surpassed Germany to become Europe's largest economy
- Latvia is the fastest growing economy in both the Eurozone and the European Union
- Luxembourg is home to the highest GDP (nominal) per capita in both the European Union and Eurozone
- Malta is the smallest economy in the Eurozone as well as the European Union, and is the fastest growing European economy in the Commonwealth of Nations
- Moldova is the fastest growing economy in Europe, but is also one of Europe's poorest countries, with the lowest GDP (nominal) per capita of any European state
- Monaco has the highest GDP (nominal) per capita of any European state
- Russia is the largest transcontinental European economy and will remain so until at least 2030
- San Marino is Europe's smallest economy, and is also the third weakest growing economy in Europe
- United Kingdom is the largest European economy in the Commonwealth of Nations, and is also the largest none Eurozone economy in Europe, with the UK set to surpass Germany to become Europe's largest economy by 2030
Financial
- Austria has the lowest unemployment rate in the European Union and the Eurozone
- Belarus has the lowest unemployment rate in Europe, although this figure includes underemployment
- Bulgaria has the smallest average wage and monthly minimum wage in the European Union
- Estonia has the smallest public debt (as a percentage of GDP) of any state in Europe, as well as in the European Union and Eurozone
- France has the largest financial deficit of any state in the Eurozone
- Georgia has the lowest monthly minimum wage in Europe
- Germany has the largest financial surplus of any country in Europe as well as the remainder of the world
- Greece has the highest public debt (as a percentage of GDP) of any European state, as well as having the largest unemployment rate in the European Union and Eurozone
- Macedonia has the highest unemployment rate of any European state
- Liechtenstein has the highest average wage of any state in Europe
- Lithuania has the smallest average wage and monthly minimum wage in the Eurozone
- Luxembourg has the highest average wage in the European Union and Eurozone as well as the highest monthly minimum wage in the entirety of Europe
- Russia has the largest surplus of those European countries not a member of either (or both) the EU or Eurozone
- Ukraine has the smallest average wage in Europe, mostly as a result of ongoing political and military struggles
- United Kingdom has the largest deficit of any country in Europe and the European Union
Social
- Armenia has the largest percentage living under the poverty line of any state in Europe
- Azerbaijan has the smallest rating for Opportunity in Europe
- Bulgaria has the lowest Human Development Index figure in the European Union, as well as the largest percentage living under the poverty line in the EU, along with ranking last on the Social Progress Index in the EU, and being ranked last on the World Happiness Index in Europe
- Croatia has the smallest rating for Opportunity in the European Union
- Denmark ranks highest on the World Happiness Report in Europe and the European Union
- Greece has the largest percentage living under the poverty line in the Eurozone, and is also ranked last on the Social Progress Index among Eurozone members, including for Opportunity
- Ireland has the highest rating for Opportunity in Europe, the European Union and the Eurozone
- Latvia has the weakest Human Development Index and World Happiness Index figures in the Eurozone
- Lithuania has the smallest percentage living below the poverty line in Europe
- Moldova ranks lowest on the Human Development Index and Social Progress Index in Europe
- Netherlands has highest Human Development Index figure in the European Union and the Eurozone, and also ranks first in the EU and Eurozone on the Social Progress Index, as well as being the highest ranked country in the Eurozone on the World Happiness Index
- San Marino has the highest Human Development Index figure in Europe
- Switzerland ranks highest in Europe on the Social Progress Index
Notes
- 1 2 3 4 5 The European Union (EU) is an economic and political union of 28 member states that are located primarily in Europe. As the EU is not a country, it is not ranked on this list.
- ↑ Excludes data for the Republic of Crimea and Sevastopol.
- 1 2 3 As data by the IMF is unavailable, 2013 data by the World Bank is used.
- 1 2 As data by the CIA World Factbook is unavailable, 2013 data by the World Bank is used.
- 1 2 3 As data by the IMF is unavailable, the latest available data by the CIA World Factbook is used.
- ↑ Data for Belorussian unemployment does not take into account underemployment.
- ↑ Data for Austrian unemployment includes only those who were previously employed.
References
- ↑ "World Economic Outlook Database, October 2014".
- ↑ "World Economic League Table 2015 , December 2014".
- ↑ "GDP - Real Growth Rate, 2013".
- ↑ "GDP (Official Exchange Rate, 2013".
- ↑ "Report for Selected Countries and Subjects (PPP valuation of country GDP)".
- ↑ "Global Wealth Databook 2014".
- ↑ "Country Comparison - Current Account Balance, 2013".
- ↑ "Country Comparison - Current Account Balance, 2013".
- ↑ "Minimum Wage Rates".
- ↑ "Human Development Report 2014 – "Sustaining Human Progress: Reducing Vulnerabilities and Building Resilience"". HDRO (Human Development Report Office) United Nations Development Programme. Retrieved 25 July 2014.
- ↑ "World Databank". Databank.worldbank.org. Retrieved 2012-11-17.
- ↑ Population below poverty line, The World Factbook, CIA, accessed on July 25, 2012.
- ↑ Poverty data: http://www.state.gov/g/drl/rls/hrrpt/2007/100577.htm Norway. Country Reports on Human Rights Practices - 2007], US Department of State; Population: Norway - CIA The World Factbook.
- 1 2 "Social Progress Index: Measuring National Progress". Social Progress Imperitive. Retrieved 2 August 2013.
- ↑ Helliwell, John; Layard, Richard; Sachs, Jeffrey (September 9, 2013). "World Happiness Report 2013". United Nations Sustainable Development Solutions Network. Archived from the original (PDF) on June 4, 2011. Retrieved 2014-06-29.
|
|---|
|
| History | |
|---|
|
| Geography | |
|---|
|
| Politics | |
|---|
|
| Economy | | | | Intergovernmental | |
|---|
| | Sovereign states by | |
|---|
|
|
|---|
|
| Society | |
|---|
|
|