Farrell Area School District
| Farrell Area School District south sharon | |
|---|---|
 | |
| Address | |
|
1700 Roemer Boulevard Farrell, Pennsylvania, Mercer County United States | |
| Information | |
| Type | Public |
| Closed | John Hetra Early Childhood Education Center (2012) |
| School board | 9 elected members |
| Superintendent | Rev. Lora Adams-King |
| Administrator |
William Dungee, Business Manager |
| Principal | Tracy Hood , HS |
| Principal | Japraunika Wright, ES |
| Head teacher |
Michelle Schwartz, Supervisor of Special Education Matthew Vannoy, Athletic Director |
| Staff | 99 non teaching staff members 2011 |
| Faculty | 78 teachers 2011 |
| Grades | PreK-12 |
| Age | 4-year-old preschool to 21-year-old special education |
| Number of students | 801 (2011), 800 (2009-2010) |
| • Kindergarten | 79 |
| • Grade 1 | 69 |
| • Grade 2 | 64 |
| • Grade 3 | 63 |
| • Grade 4 | 60 |
| • Grade 5 | 68 |
| • Grade 6 | 76 |
| • Grade 7 | 55 |
| • Grade 8 | 64 |
| • Grade 9 | 65 |
| • Grade 10 | 66 |
| • Grade 11 | 47 |
| • Grade 12 | 51 |
| • Other | Enrollment projected to decline to 600 pupils by 2019.[1] |
| Student to teacher ratio | 10:1 |
| Budget |
$15,886,372 (2013-14[2] |
| Per pupil spending | $15,602 (2008) |
| Per pupil spending | $19,887.27 (2011) rank 36th in PA |
| Website | http://www.farrellareaschools.com/ |
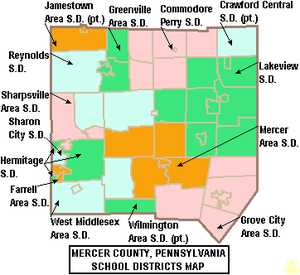
The Farrell Area School District is a diminutive, rural, public school district serving parts of Mercer County, Pennsylvania. Farrell Area School District encompasses approximately 3 square miles (7.8 km2) including: the communities of Farrell and Wheatland, both of which are adjacent to the much larger Sharon, Pennsylvania. According to 2000 federal census data, it serves a resident population of 6,798. By 2010, the District's population declined to 5,739 people.[6] In 2009, Farrell Area School District residents' per capita income was $14,623, while the median family income was $29,821.[7]
For the 1997-98 school year, the Farrell Area School Board approved a budget of approximately $10.2 million to educate 1,203 students. Per District officials, in school year 2007-08, the Farrell Area School District provided basic educational services to 953 pupils through the employment of 97 teachers, 8 full-time and part-time support personnel, and 4 administrators. Farrell Area School District received more than $9.9 million in state funding in school year 2007-08. The District reported having 860 pupils enrolled in 2009-10. It employed: 94 teachers, 63 full-time and part-time support personnel, and 5 administrators. Farrell Area School District received $9.2 million in state funding in the 2009-10 school year.
Farrell Area School District operates one elementary school and a combined junior/senior high school.
Governance
The school district is governed by 9 individually elected board members (serve four-year terms), the Pennsylvania State Board of Education, the Pennsylvania Department of Education and the Pennsylvania General Assembly.[8] The federal government controls programs it funds like Title I funding for low-income children in the Elementary and Secondary Education Act and the No Child Left Behind Act, which mandates the district focus resources on student success in acquiring reading and math skills.
The Commonwealth Foundation for Public Policy Alternatives Sunshine Review gave the school board and district administration a "D-" for transparency based on a review of "What information can people find on their school district's website". It examined the school district's website for information regarding; taxes, the current budget, meetings, school board members names and terms, contracts, audits, public records information and more.[9]
Academic achievement
In July 2012, the Pennsylvania Department of Education (PDE) released a report identifying both Farrell Area School District schools as among the lowest achieving schools for reading and mathematics in 2011. They were among 15% lowest achieving schools in the Commonwealth. Parents and students may be eligible for scholarships to transfer to another public or nonpublic school through the state's Opportunity Scholarship Tax Credit Program passed in June 2012.[10] The scholarships are limited to those students whose family's income is less than $60,000 annually, with another $12,000 allowed per dependent. Maximum scholarship award is $8,500, with special education students receiving up to $15,000 for a year's tuition. Parents pay any difference between the scholarship amount and the receiving school's tuition rate. Students may seek admission to neighboring public school districts. Each year the PDE publishes the tuition rate for each individual public school district.[11] According to the report, parents in 414 public schools (74 school districts) were offered access to these scholarships. For the 2012-13 school year, eight public school districts in Pennsylvania had all of their schools placed on the list including: Farrell Area School District, Sto-Rox School District, Chester Upland School District, Clairton City School District, Duquesne City School District, Wilkinsburg Borough School District, William Penn School District and Steelton-Highspire School District.[12] Funding for the scholarships comes from donations by businesses which receive a state tax credit for donating.
Farrell Area School District was identified as a chronically low performing, turnaround school district, in the Pennsylvania Department of Education Race to the Top Grant application made in December 2009.[13]
In 2009, the academic achievement of the students of the Farrell Area School District was in the bottom 1 percentile of Pennsylvania's 500 school districts. Scale (0-99; 100 is state best) [14]
- Statewide ranking
In 2013, Farrell Area School District ranked 488th out of 498 Pennsylvania districts by the Pittsburgh Business Times.[15] The ranking was based on student academic achievement as demonstrated on the last three years of the PSSAs for: reading, writing, math and science.[16] The PSSAs are given to all children in grades 3rd through 8th and the 11th grade in high school. Adapted examinations are given to children in the special education programs.
- 2012 - 490th
- 2011 - 489th[17]
- 2010 - 491st [18]
- 2009 - 490th
- 2008 - 488th
- 2007 - 487th out of 501 districts [19]
- Overachiever statewide ranking
In 2013, the Pittsburgh Business Times also reported an Overachievers Ranking for 498 Pennsylvania school districts. Farrell Area School District ranked 145th. In 2011, the District ranked 279th. [20] The editor describes the ranking as: "a ranking answers the question - which school districts do better than expectations based upon economics? This rank takes the Honor Roll rank and adds the percentage of students in the district eligible for free and reduced-price lunch into the formula. A district finishing high on this rank is smashing expectations, and any district above the median point is exceeding expectations."[21]
District AYP status history
In 2012, Farrell Area School District declined toWarning AYP status due to chronic low student in reading and mathematics.[22] In 2011, the District achieved Adequate Yearly Progress (AYP). In 2011, 94 percent of the 500 Pennsylvania public school districts achieved the No Child Left Behind Act progress level of 72% of students reading on grade level and 67% of students demonstrating on grade level math. In 2011, 46.9 percent of Pennsylvania school districts achieved Adequate Yearly Progress (AYP) based on student performance. An additional 37.8 percent of Pennsylvania public school districts made AYP based on a calculated method called safe harbor, 8.2 percent on the growth model and 0.8 percent on a two-year average performance.[23] School District achieved AYP status each year from 2005 to 2010, while in 2004 and 2003 the District was in Warning status due to lagging student achievement in reading and mathematics.[24]
Graduation rate
In 2012, The District’s graduation rate was 97%.[25] In 2011, the graduation rate was also 97%.[26] In 2010, the Pennsylvania Department of Education issued a new, 4-year cohort graduation rate. Farrell Area School District's rate was 97% for 2010.[27]
According to traditional graduation rate calculations:
High school
Farrell High School is located at 1700 Roemer Blvd, Farrell. According to the National Center for Education Statistics, in 2010, the School reported an enrollment of 352 pupils in grades 7th through 12th, with 349 pupils eligible for a federal free or reduced price lunch due to the family meeting the federal poverty level. The school is a federally designated Title I school. The school employed 39 teachers yielding a student-teacher ratio of 9:1.[31] According to a report by the Pennsylvania Department of Education, 10 teachers were rated "Non‐Highly Qualified" under No Child Left Behind.[32] The school provided grades 7 through 12 with 364 students in 2010 and 38 teachers.[33]
In 2012, Farrell High School declined further to Corrective Action II 4th Year, due to missing every academic metric in reading and mathematics. In accordance with NCLB, the administration must notify parents of the low student achievement and offer the opportunity to transfer to a performing school within the DIstrict. In 2011, the Farrell High School was in Making Progress: in Corrective Action II status due to improving student achievement.[34] In 2010, Farrell High School declined to Corrective Action II 3rd Year status due to chronic, low student achievement. In 2009, the School was in Making Progress: in Corrective Action II status.[35] Farrell High School administration was required by the Pennsylvania Department of Education, to develop a School Improvement Plan to address the school's low student achievement. Under the Pennsylvania Accountability System, Farrell School District must pay for additional tutoring for struggling students.[36]
- PSSA Results
- 11th Grade Reading:
- 2012 - 38% on grade level (33% below basic). State - 67% of 11th graders are on grade level.[37]
- 2011 - 40% (29% below basic). State - 69.1%[38]
- 2010 - 33% (38% below basic). State - 66%[39]
- 2009 - 23%, State - 65% [40]
- 2008 - 30%, State - 65% [41]
- 2007 - 28%, State - 65% [42]
11th Grade Math:
- 2012 - 37% on grade level (43% below basic). In Pennsylvania, 59% of 11th graders are on grade level.[43]
- 2011 - 34% (36% below basic). State - 60.3%[44]
- 2010 - 24% (70% below basic). State - 59%
- 2009 - 26%. State - 56% [45]
- 2008 - 18%. State - 56%
- 2007 - 33%. State - 53%
- 11th Grade Science:
- 2012 - 10% (53% below basic). State - 42%[46]
- 2011 - 5% (56% below basic). State - 40%[47]
- 2010 - 8%, State - 39%
- 2009 - 5%, State - 40%
- 2008 - 7%, State - 39% [48]
- Science in Motion
Farrell High School did not utilize a state program called Science in Motion which brought college professors and sophisticated science equipment to the school to raise science awareness and to provide inquiry-based experiences for the students. The Science in Motion program was funded by a state appropriation and cost the school nothing to participate.[49] Westminster College provides the enrichment experiences to schools in the region.
College Remediation
According to a Pennsylvania Department of Education study released in January 2009, 28% of Farrell Area High School graduates required remediation in mathematics and or reading before they were prepared to take college level courses in the Pennsylvania State System of Higher Education or community colleges.[50] Less than 66% of Pennsylvania high school graduates, who enroll in a four-year college in Pennsylvania, will earn a bachelor's degree within six years. Among Pennsylvania high school graduates pursuing an associate degree, only one in three graduate in three years.[51] Per the Pennsylvania Department of Education, one in three recent high school graduates who attend Pennsylvania's public universities and community colleges takes at least one remedial course in math, reading or English.
Dual enrollment
Farrell High School offers a dual enrollment program. This state program permits high school students to take courses, at local higher education institutions, to earn college credits. Students remain enrolled at their high school. The courses count towards high school graduation requirements and towards earning a college degree. The students continue to have full access to activities at their high school. The college credits are offered at a deeply discounted rate. The state offers a small grant to assist students in costs for tuition, fees and books.[52] Under the Pennsylvania Transfer and Articulation Agreement, many Pennsylvania colleges and universities accept these credits for students who transfer to their institutions.[53] The Pennsylvania College Credit Transfer System reported in 2009, that students saved nearly $35.4 million by having their transferred credits count towards a degree under the new system.[54] For the 2009-10 funding year, the school district received a state grant of $9,964 for the program.[55]
SAT scores
In 2012, 42 Farrell Area School District students took the SAT exams. The District's Verbal Average Score was 393. The Math average score was 389. The Writing average score was 370. The statewide Verbal SAT exams results were: Verbal 491, Math 501, Writing 480. In the USA, 1.65 million students took the exams achieving scores: Verbal 496, Math 514, Writing 488. According to the College Board the maximum score on each section was 800, and 360 students nationwide scored a perfect 2,400.
In 2011, 25 Farrell Area School District students took the SAT exams. The district's Verbal Average Score was 359. The Math average score was 374. The Writing average score was 241.[56] Pennsylvania ranked 40th among state with SAT scores: Verbal - 493, Math - 501, Writing - 479.[57] In the United States 1.65 million students took the exam in 2011. They averaged 497 (out of 800) verbal, 514 math and 489 in writing.[58]
Graduation requirements
The Farrell Area School Board has determined that a high school student must earn 24 credits in order to graduate, including: English 4 credits, Social Studies 4 credits, Mathematics 4 credits, Science 3 credits, Physical Education 2 credits, Health 0.5 credit, Computer 0.5 credit, Arts/Humanities 0.5 credit, Graduation Project 1 credit and 5 elective credits.[59]
By law, all Pennsylvania secondary school students must complete a project as a part of their eligibility to graduate from high school. The type of project, its rigor and its expectations are set by the individual school district.[60] Effective with the graduating class of 2017, the Pennsylvania State Board of Education eliminated the state mandate that students complete a culminating project in order to graduate.[61]
By Pennsylvania School Board regulations, beginning with the class of 2017, public school students must demonstrate successful completion of secondary level course work in Algebra I, Biology, and English Literature by passing the Keystone Exams.[62] The exam is given at the end of the course. Keystone Exams replace the PSSAs for 11th grade. Students have several opportunities to pass the exam, with those who do not able to perform a project in order to graduate.[63][64] For the class of 2019, a Composition exam will be added. For the class of 2020, passing a civics and government exam will be added to the graduation requirements.[65] In 2011, Pennsylvania high school students field tested the Algebra 1, Biology and English Lit exams. The statewide results were: Algebra 1 38% on grade level, Biology 35% on grade level and English Lit - 49% on grade level.[66] Individual student, school or district reports were not made public, although they were reported to district officials by the Pennsylvania Department of Education. Students identified as having special needs and qualifying for an Individual Educational Program (IEP) may graduate by meeting the requirements of their IEP.
Eighth grade
8th Grade Reading
- 2012 - 63% on grade level (20% below basic). In Pennsylvania, 79% of 8th graders on grade level.[43]
- 2011 - 63%, Boys - 58%/Girls-67% (21% below basic). State - 81.8%
- 2010 - 62%, Boys - 67%/Girls-76% (16% below basic). State - 81% [67]
- 2009 - 61% (18% below basic), State - 80%
- 2008 - 48% (38% below basic), State - 78% [68]
- 2007 - 49% (25% below basic), State - 75%
8th Grade Math:
- 2012 - 58% (20% below basic). State - 76%
- 2011 - 47%, Boys - 50%/Girls-42% (19% below basic). State - 76.9%
- 2010 - 45%, Boys - 38%/Girls-53% (32% below basic). State - 75%[69]
- 2009 - 47%, Boys - 50%/Girls-44% (27% below basic), State - 71% [70]
- 2008 - 43% (37% below basic), State - 70%
- 2007 - 36% (41% below basic), State - 68%
8th Grade Science:
- 2012 - 26% on grade level (53% below basic). State - 59%
- 2011 - 19% (56% below basic). State – 58.3%
- 2010 - 21% (63% below basic). State - 57%
- 2009 - 17% (58% below basic), State - 55% [71]
- 2008 - 20%, (50% below basic), State - 52% [72]
Seventh grade
|
7th Grade Reading:
|
7th Grade Math:
|
Farrell Area Elementary School
Farrell Area Elementary School is located at 1600 Roemer Blvd, Farrell. According to the National Center for Education Statistics, in 2011, the school reported an enrollment of 449 pupils in grades preschool through 6th, with 446 pupils receiving a federal free or reduced price lunch due to family poverty. The school is a federally designated Title I school. The school employed 39 teachers yielding a student-teacher ratio of 11:1.[73] According to a report by the Pennsylvania Department of Education, 100% of its teachers were rated "Highly Qualified" under No Child Left Behind.[74] Farrell Area School District provides a universal full day kindergarten. While proponents of full day kindergarten claim it will reduce special education numbers and it will raise primary student academic achievement especially in reading and math, those outcomes have not been realized in Farrell Area School District. Reading achievement in particular has significantly declined.[75] A preschool program is offered by Community Action Partnership of Mercer County.
In 2012, Farrell Area Elementary school declined to Corrective Action II 1st Year, due to lagging student achievement in reading and mathematics. In 2011, the School remained in Corrective Action I status.[76] In 2010, Farrell Area Elementary School declined to Corrective Action I status due to chronic, low student achievement.[77] The School was required, under the federal No Child Left Behind law, to notify parents of the school's pupils of their right to transfer to a better performing school within the district.[78] In 2009, the school was in Making Progress: in School Improvement II status. The school administration was required by the Pennsylvania Department of Education to develop a school improvement plan to raise student reading and math achievement. In 2011 the school had a 94% attendance rate. The Elementary School's administration was required to develop a School Improvement plan that focuses on raising student achievement in reading and mathematics. The school is eligible for School Improvement grants.
PSSA results:
|
6th Grade Reading:
|
6th Grade Math:
|
|
5th Grade Reading:
|
5th Grade Math:
|
|
|
- 4th Grade Science
- 2012 - 50%, (25% below basic). State - 82%
- 2011 - 54%, Boys 53%/Girls 55% (21% below basic). State – 82.9%
- 2010 - 56%, Boys 53%/Girls 60% (24% below basic). State - 81%
- 2009 - 61%, Boys 58%/Girls 65% (4% below basic). State - 83%
- 2008 - 73%, (7% below basic), State - 81%
|
|
Special education
In December 2011, Farrell Area School District Administration reported that 153 pupils or 17.8% of the district's pupils received Special education services, with 41% of identified students having a specific learning disability. In December 2009, the district administration reported that 165 pupils or 18.9% of the district's pupils received Special Education services.[86][87]
The school district engages in identification procedures to ensure that eligible students receive an appropriate educational program consisting of special education and related services, individualized to meet student needs. At no cost to the parents, these services are provided in compliance with state and federal law; and are reasonably calculated to yield meaningful educational benefit and student progress. To identify students who may be eligible for special education, various screening activities are conducted on an ongoing basis. These screening activities include: review of group-based data (cumulative records, enrollment records, health records, report cards, ability and achievement test scores); hearing, vision, motor, and speech/language screening; and review by the Special Education administration. When screening results suggest that the student may be eligible, the District seeks parental consent to conduct a multidisciplinary evaluation. Parents who suspect their child is eligible may verbally request a multidisciplinary evaluation from a professional employee of the District or contact the Supervisor of Special Education.[88]
In 2010, the state of Pennsylvania provided $1,026,815,000 for Special Education services. The funds were distributed to districts based on a state policy which estimates that 16% of the district's pupils are receiving special education services. This funding is in addition to the state's basic education per pupil funding, as well as, all other state and federal funding.[89] The Special Education funding structure is through the federal Individuals with Disabilities Education Act (IDEA) funds and state appropriations. IDEA funds are appropriated to the state on an annual basis and distributed through intermediate units (IUs) to school districts, while state funds are distributed directly to the districts. Total funds that are received by school districts are calculated through a formula. The Pennsylvania Department of Education oversees four appropriations used to fund students with special needs: Special Education; Approved Private Schools; Pennsylvania Chartered Schools for the Deaf and Blind; and Early Intervention. The Pennsylvania Special Education funding system assumes that 16% of the district’s students receive special education services. It also assumes that each student’s needs accrue the same level of costs.[90] Over identification of students, in order to increase state funding, has been an issue in the Commonwealth. Some districts have more than 20% of its students receiving special education services while others have 10% supported through special education.[91] The state requires each public school district and charter school to have a three-year special education plan to meet the unique needs of its special education students.[92] In 2012, the Obama Administration's US Department of Education issued a directive that schools include students with disabilities in extracurricular activities, including sports.[93]
Farrell Area School District received a $748,236 supplement for special education services in 2010.[94] For the 2011-12, 2012–13 and 2013-14 school years, all Pennsylvania public school districts received the same level of funding for special education that they received in 2010. This level funding is provided regardless of changes in the number of pupils who need special education services and regardless of the level of services the respective students required.[95][96] Additionally, the Commonwealth provides supplemental funding for extraordinarily impacted students. The District must apply for this added funding.
Gifted education
The District Administration reported that 7 or 0.80% of its students were gifted in 2009.[97] By law, the district must provide mentally gifted programs at all grade levels. The referral process for a gifted evaluation can be initiated by teachers or parents by contacting the student’s building principal and requesting an evaluation. All requests must be made in writing. To be eligible for mentally gifted programs in Pennsylvania, a student must have a cognitive ability of at least 130 as measured on a standardized ability test by a certified school psychologist. Other factors that indicate giftedness will also be considered for eligibility.[98]
Bullying policy and school safety
In 2012, Farrell Area School District administration reported there were no incidents of bullying in the district. There were 8 incidents that involved law enforcement including 1 sexual assault and 3 arrests. In 2010, the administration reported there were no incidents of bullying in the district.[99][100]
The Farrell Area School Board prohibits bullying by district students and faculty. The policy defines bullying and cyberbullying. The Board directs that complaints of bullying shall be investigated promptly, and corrective action shall be taken when allegations are verified. No reprisals or retaliation may occur as a result of good faith reports of bullying.[101] The board expects staff members to be responsible to maintain an educational environment free from all forms of bullying. All Pennsylvania schools are required to have an anti-bullying policy incorporated into their Code of Student Conduct. The policy must identify disciplinary actions for bullying and designate a school staff person to receive complaints of bullying. The policy must be available on the school's website and posted in every classroom. All Pennsylvania public schools must provide a copy of its anti-bullying policy to the Office for Safe Schools every year, and shall review their policy every three years. Additionally, the district must conduct an annual review of that policy with students.[102] The Center for Schools and Communities works in partnership with the Pennsylvania Commission on Crime & Delinquency and the Pennsylvania Department of Education to assist schools and communities as they research, select and implement bullying prevention programs and initiatives.[103]
Education standards relating to student safety and antiharassment programs are described in the 10.3. Safety and Injury Prevention in the Pennsylvania Academic Standards for Health, Safety and Physical Education.[104]
Enrollment and Consolidation
Enrollment continues to decline in the Farrell Area School District. The Class of 2011 had just 41 students. According to the Pennsylvania Department of Education, there are fewer than 900 students enrolled in Farrell Area SD, K-12, in 2010. There were 53 students in the Class of 2010. The District's class of 2009 had 62 students. Enrollment in the Farrell Area School District is projected, by the Pennsylvania Department of Education, to continue to decline to 600 pupils K-12 total enrollment, by 2020.[105] Farrell Area School District administrative costs per pupil in 2008 was $779.68 per pupil. This is ranked 221st among in the 500 school districts in the Commonwealth of Pennsylvania. The lowest administrative cost per pupil in Pennsylvania was $398 per pupil.[106]
A Standard and Poors study found that an optimal school district size, to conserve administrative costs, was at least 3000 pupils.[107] Consolidation of the administration with an adjacent school district would achieve substantial administrative cost savings for people in both communities.[108] According to a proposal made in 2009, by Governor Edward G. Rendell, the excessive administrative overhead dollars could be redirected to improve lagging academic achievement, to enrich the academic programs or to substantially reduce property taxes.[109] Consolidation of two districts' central administrations into one would not require the closing of any local schools.
In March 2011, the Pennsylvania Institute of Certified Public Accountants Fiscal Responsibility Task Force released a report which found that consolidating school district administrations with one neighboring district would save the Commonwealth $1.2 billion without forcing the consolidation of any school buildings.[110] The study noted that while the best school districts spent 4% of the annual budget on administration, others spend over 15% on administration.[111]
More than 40 percent of elementary schools and more than 60 percent of secondary schools in western Pennsylvania have been experiencing significant enrollment decreases (15 percent or greater).[112]
Pennsylvania has one of the highest numbers of school districts in the nation. In Pennsylvania, 80% of the school districts serve student populations under 5,000, and 40% serve less than 2,000. This results in excessive school administration bureaucracy and not enough course diversity.[113] In a survey of 88 superintendents of small districts, 42% of the 49 respondents stated that they thought consolidation would save money without closing any schools.[114]
Budget
Pennsylvania public school districts budget and expend funds according to procedures mandated by the General Assembly and the Pennsylvania Department of Education (PDE). An annual operating budget is prepared by school district administrative officials. A uniform form is furnished by the PDE and submitted to the board of school directors for approval prior to the beginning of each fiscal year on July 1.
Under Pennsylvania’s Taxpayer Relief Act, Act 1 of the Special Session of 2006, all school districts of the first class A, second class, third class and fourth class must adopt a preliminary budget proposal. The proposal must include estimated revenues and expenditures and the proposed tax rates. This proposed budget must be considered by the Board no later than 90 days prior to the date of the election immediately preceding the fiscal year. The preliminary budget proposal must also be printed and made available for public inspection at least 20 days prior to its adoption. The board of school directors may hold a public hearing on the budget, but are not required to do so. The board must give at least 10 days’ public notice of its intent to adopt the final budget according to Act 1 of 2006.[115]
In 2012, the Farrell Area School Board agreed to a four-year pact with the local teachers union that froze wages in 2011-12. The contract commits to a 2 percent salary increase in 2012-2013 and 2013-2014 and a 2.3 percent raise in 2013-2014. In August 2012, the School Board reinstated six teachers who were furloughed in June 2012, when the board initially approved its 2012-13 budget. This created a deficit in excess of $1 million for the 2013-14 school year.
In 2011, the District reported employing 93 teachers and administrators, with the average teacher salary in Farrell Area School District was $57,053 a year, while the cost of the benefits teachers received was $20,922 per employee, for a total annual average teacher compensation of $77,976.71.[116] The top salary was $101,000.
In 2010, a former High School Principal sued the District for wrongful termination. The Secretary o Education reviewed the case and found the individual demonstrated persistent negligence in the performance of his job duties and his persistent and willful failure to comply with school laws. The Court reversed the Board's actions.[117] In May 2013, the individual was hired by Wilkinsburg Borough School District as Superintendent of schools.
In 2009, the District employed 90 teachers. The average teacher salary in the district was $53,237 for 186 days worked. The beginning salary was $40,627, while the highest salary was $89,495.[118] Teachers work a 7-hour day 15 minutes with one planning period and a paid 30 minute lunch included. Teachers who mentor new teachers receive an additional $575 and teachers who prepare IEPS are paid an extra $500. Additionally, the teachers received a defined benefit pension, health insurance (employee contributes $50 per month), professional development reimbursement of 75% of costs, 2-3 paid personal days, 10 paid sick days which accumulate, 1 emergency leave day, 4 paid bereavement leave days and many other benefits. The district offers an extensive retirement/longevity package which includes payment for unused sick days accumulated in Farrell Area School District and a retirement bonus. The union gets nine paid days to conduct union business, including travel outside the district.[119] According to Rep. Glen Grell, a trustee of the Public School Employees’ Retirement System Board of Trustees, a 40-year educator can retire with a pension equal to 100 percent of their final salary.[120][121]
In 2007, the Farrell Area School District employed 74 teachers working 186 days with 182 days of pupil instruction. The average teacher salary in the district was $54,548. The average teacher salary in Pennsylvania was $49,596.[122] As of 2007, Pennsylvania ranked in the top 10 states in average teacher salaries. When adjusted for cost of living Pennsylvania ranked fourth in the nation for teacher compensation.[123]
Per pupil spending In 2008, per pupil spending at Farrell Area School District was ranked 51st in the state at $15,602 for each child.[124] In 2010, the per pupil spending in Farrell Area School District rose to $18,683.33, which ranked 23rd in the Commonwealth. In 2011, Pennsylvania’s per pupil spending was $13,467, ranking 6th in the United States.[125] In 2007, the Pennsylvania per pupil total expenditures was reported as $12,759.[126] The U.S. Census Bureau reported that Pennsylvania spent $8,191 per pupil in school year 2000-01.[127]
Among the fifty states, Pennsylvania’s total per pupil revenue (including all sources) ranked 11th at $15,023 per student, in 2008-09.[128] Pennsylvania’s total revenue per pupil rose to $16,186 ranking 9th in the nation in 2011.[129]
Reserves In 2008, the Farrell Area School District reported an unreserved designated fund balance of $1.6 million and an unreserved-undesignated fund balance of $1,532,956.[130] In 2010, the unreserved designated fund balance was zero. The district's unreserved-undesignated fund balance was reported as -$64,217. In 2012, the District reported to the PDE, that it held$2.3 million in reserves. PA school district reserve funds are divided into two categories – designated and undesignated. The undesignated funds are not committed to any planned project. Designated funds and any other funds, such as capital reserves, are allocated to specific projects. School districts are required by state law to keep 5 percent of their annual spending in the undesignated reserve funds to preserve bond ratings. According to the Pennsylvania Department of Education, from 2003 to 2010, as a whole, Pennsylvania school districts amassed nearly $3 billion in reserved funds.[131]
Audits In 2002, the District administration was the subject of a special investigation by the Pennsylvania Auditor General's office. The District was cited for violations of state law.[132] In April 2011, the Pennsylvania Auditor General conducted a performance audit on the district. Several findings were reported to the school board and administration. The auditors noted that the amount paid pupil transportation contractors greatly exceeds the PA Department of Education final formula allowances.[133] In June 2013, the District was audited again by the Pennsylvania Auditor General. Multiple serious issues were found. They included improperly utilizing monies from a special Capital Reserve Fund to pay back wages; errors in reporting pupil membership on which state funding is based; the amount paid pupil transportation contractors greatly exceeds PDE final formula allowance among others.[134]
Tuition Students who live in the Farrell Area School District's attendance area may choose to attend one of Pennsylvania's 157 public charter schools. A student living in a neighboring public school district or a foreign exchange student may seek admission to Farrell Area School School District. For these cases, the Pennsylvania Department of Education sets an annual tuition rate for each school district. It is the amount the public school district pays to a charter school for each resident student that attends the charter and it is the amount a nonresident student's parents must pay to attend the Farrell Area School District's schools. The 2012 tuition rates are Elementary School - $11,999.57, High School - $14,599.52.[135]
Farrell Area School District is funded by a combination of: a local tax on income 0.5%, a property tax, a real estate transfer tax 0.5%, coupled with substantial funding from the Commonwealth of Pennsylvania and the federal government. Grants can provide an opportunity to supplement school funding without raising local taxes. Interest earnings on accounts also provide nontax income to the District. In the Commonwealth of Pennsylvania, pension income and Social Security income are exempted from state personal income tax and local earned income tax, regardless of the level of the individual’s personal wealth.[136] The average Pennsylvania public school teacher pension in 2011 exceeds $60,000 a year plus they receive federal Social Security benefits: both are free of Pennsylvania state income tax and local income tax which funds local public schools.[137]
State basic education funding
For the 2013-14 school year, the Farrell Area School District will receive a 1.1% increase or $6,881,581 in Pennsylvania Basic Education Funding. This is $75,636 more than its 2012-13 state BEF to the District. Additionally, Farrell Area School District will receive $99,439 in Accountability Block Grant funding to focus on academic achievement and level funding for special education services. Among the public school districts in Mercer County, Hermitage School District received the highest percentage increase at 2.2%. The District has the option of applying for several other state and federal grants to increase revenues. The Commonwealth’s budget increased Basic Education Funding statewide by $123 million to over $5.5 billion. Most of Pennsylvania’s 500 public school districts received an increase of Basic Education Funding in a range of 0.9% to 4%. Eight public school districts received exceptionally high funding increases of 10% to 16%. The highest increase in state funding was awarded to Austin Area School District which received a 22.5% increase in Basic Education Funding.[138] The state funded the PSERS (Pennsylvania school employee pension fund) with $1,017,000,000 and Social Security payments for school employees of $495 million.[139]
For the 2012-13 school year, the Farrell Area School District received $6,805,945.05.[140] The Governor's Executive Budget for 2012-2013 included $9.34 billion for kindergarten through 12th grade public education, including $5.4 billion in basic education funding, which was an increase of $49 million over the 2011-12 budget. In addition, the Commonwealth provided $100 million for the Accountability Block Grant (ABG) program. Farrell Area School District received $99,439 in Accountability Block GrantThe state also provided a $544.4 million payment for School Employees’ Social Security and $856 million for School Employees’ Retirement fund called PSERS.[141] This amount was a $21,823,000 increase (0.34%) over the 2011-2012 appropriations for Basic Education Funding, School Employees' Social Security, Pupil Transportation, Nonpublic and Charter School Pupil Transportation. Since taking office, Corbett’s first two budgets have restored more than $918 million in support of public schools, compensating for the $1 billion in federal stimulus dollars lost at the end of the 2010-11 school year.
In 2011-12 school year, Farrell Area School District received $6,805,945 in state Basic Education Funding.[142][143] Additionally, the District received $99,439 in Accountability Block Grant funding. The enacted Pennsylvania state Education budget includes $5,354,629,000 for the 2011-2012 Basic Education Funding appropriation. This amount is a $233,290,000 increase (4.6%) over the enacted State appropriation for 2010-2011.[144] In 2010, Farrell Area School District reported that 735 pupils received a free or reduced-price lunch due to their family meeting the federal poverty level.
For the 2010-11 budget year, Farrell Area School District received a 2% increase in state basic education funding for a total of $6,942,063.95. In Mercer County, the highest increase went to Greenville Area School District which received a 7.54% increase in state funding. One hundred fifty school districts in Pennsylvania received a 2% base increase for budget year 2010-11. The highest increase in the state was awarded to Kennett Consolidated School District of Chester County, which was given a 23.65% increase in state basic education funding.[145] Fifteen (15) Pennsylvania public school districts received a BEF increase of greater than 10%. The state's hold harmless policy regarding state basic education funding continued where each district received at least the same amount as it received the prior school year, even when enrollment had significantly declined. The amount of increase each school district received was set by Governor Edward Rendell and then Secretary of Education Gerald Zahorchak, as a part of the state budget proposal given each February. This was the second year of Governor Rendell’s policy to fund some public school districts at a far greater rate than others.[146]
In the 2009-2010 budget year, the Commonwealth of Pennsylvania provided a 3.85% increase in Basic Education funding for a total of $6,942,064. Three county school districts received increases of over 6% in Basic Education Funding in 2009-10. Sharon City School District received a 7.59% increase. In Pennsylvania, 15 school districts received Basic Education Funding increases in excess of 10% in 2009. Muhlenberg School District in Berks County received the highest with a 22.31% increase in funding. The state's Basic Education Funding to the Farrell Area School District in 2008-09 was $6,805,945.058.[147] The amount of increase each school district received was determined by the Governor Edward G. Rendell and then Secretary of Education Gerald Zahorchak, through the allocation set in the state budget proposal made in February each year.[148] In 2008, the district reported that 820 pupils received a free or reduced-price lunch due to their family meeting the federal poverty level.
Accountability Block Grant
The state provides additional education funding to schools in the form of Accountability Block Grants. The use of these funds is strictly focused on specific state approved uses designed to improve student academic achievement. Farrell Area School District uses its $269,902 to fund extensive teacher training through teacher coaches. These annual funds are in addition to the state's basic education funding.[149] Schools Districts applied each year for Accountability Block Grants and were required to report how the dollars were used.[150] In 2009-10, the state provided $271.4 million in Accountability Block grants $199.5 million went to providing all-day kindergartens.[151]
Classrooms for the Future grant
The Classroom for the Future state program provided districts with hundreds of thousands of extra state funding to buy laptop computers for each core curriculum high school class (English, Science, History, Math) and paid for teacher training to optimize the computers use. The program was funded from 2006-2009. Farrell Area School District was denied funding in 2006-07. In 2007-08, the District received $105,664 in funding. For the 2008-09, school year the District received $45,413. Of the 501 public school districts in Pennsylvania, 447 of them received Classrooms for the Future grant awards.[152]
Science It’s Elementary grant
Farrell Area Elementary School successfully applied to participate and received a Science It’s Elementary grant in 2008-09. For the 2008-09 school year, the program was offered in 143 schools reaching 66,973 students across the Commonwealth of Pennsylvania.[153] In 2007, the Pennsylvania Department of Education initiated an effort to improve science instruction in the Commonwealth’s public elementary schools. Called Science: It’s Elementary, the program was a hands on instruction approach for elementary science classes that develops problem-solving and critical thinking skills.[154] To encourage schools to adopt the program’s standards aligned curriculum, the state provided a grant to cover the costs of materials and extensive mandatory teacher training.[155] The district was required to develop a three-year implementation plan for the participating school. The school district administration was required to appoint a district liaison who was paid $3,000 by PDE to serve as the conduit of all information between the district and the Department and its agents along with submitting orders and distributing supplies to implementing teachers. For the 2006-07 state education budget, $10 million was allocated for the program. The grant program was expanded to $14.5 million in the 2008-09 budget. The grant was discontinued in the state’s 2011 budget by Governor Edward G. Rendell.
Education Assistance Grant
The state's EAP funding provides for the continuing support of tutoring services and other programs to address the academic needs of eligible students. Funds are available to eligible school districts and full-time career and technology centers (CTC) in which one or more schools have failed to meet at least one academic performance target, as provided for in Section 1512-C of the Pennsylvania Public School Code. In 2010-11 the Farrell Area School District received $74,721.[156]
Other grants
Farrell Area School District did not participate in: Pennsylvania Department of Environmental Protection's Environmental Education annual grants nor the 2012 Striving Readers Comprehensive Literacy grant.
Federal stimulus grant
The Farrell Area School District received $2,343,000. in ARRA - Federal stimulus money to be used in specific programs like special education and meeting the academic needs of low-income students. This funding includes $917,000 for Title 1-A programs, $1,088,200 for construction and $337,800 for IDEA programs.[157] This funding was for 2009-10 and 2010-2011 school years.
Race to the Top grant
Farrell Area School District officials did not apply for the Race to the Top federal grant which would have brought the district up to million additional federal dollars for improving student academic achievement.[158] Participation required the administration, the school board and the local teachers' union to sign an agreement to prioritize improving student academic success.[159] The district administration and teachers union rejected applying for the grant because of its requirements, for the district as a low performing, turnaround district.[160] In Pennsylvania, 120 public school districts and 56 charter schools agreed to participate.[161] Pennsylvania was not approved for the grant. The failure of districts to agree to participate was cited as one reason that Pennsylvania was not approved.[162]
21st Century learning grant
In July 2003 and 2004, Farrell Area School District received a federal grant which is run by the PDE. The grant called for the establishment and sustainability of community learning centers that provide additional educational services to students in high-poverty and low-performing schools. The grant was competitive. Applications for the grants were reviewed and scored by a panel of representatives from the educational field and professional grant writers. The District received $289,010 in 2003 and $356,400 in 2004.[163] The District did not participate in the 2010-12 program funding.
Library grant
Farrell Area School District received a $200,000 federal appropriation grant to improve the school district's libraries.[164]
Common Cents state initiative
The Farrell Area School District School Board participated in the Pennsylvania Department of Education Common Cents program. The program called for the state to audit the district, at no cost to local taxpayers, to identify ways the district could save tax dollars.[165] After the review of the information, the district was not required to implement the recommended cost savings changes. The report found multiple opportunities for savings within the District.[166] This was on the heels of a report from State Auditor General Bob Casey Jr. which in 2002, pointed out many examples of how the district could save money. Among them was the gross overstaffing of custodians in the district.[167]
Real estate taxes
In 2013, the Farrell Area School Board set the property taxes rate at 61.965 mills for the 2013-14 school year. A mill is $1 of tax for every $1,000 of a property's assessed value. Property taxes, in the Commonwealth of Pennsylvania, apply only to real estate - land and buildings. The property tax is not levied on cars, business inventory, or other personal property. Certain types of property are exempt from property taxes, including: places of worship, places of burial, private social clubs, charitable and educational institutions and government property. Irregular property reassessments have become a serious issue in the commonwealth as it creates a significant disparity in taxation within a community and across a region. Additionally, service related, disabled US military veterans may seek an exemption from paying property taxes. Pennsylvania school district revenues are dominated by two main sources: 1) Property tax collections, which account for the vast majority (between 75-85%) of local revenues; and 2) Act 511 tax collections, which are around 15% of revenues for school districts.[168]
The average yearly property tax paid by Mercer County residents amounts to about 2.88% of their yearly income. Mercer County ranked 672nd out of the 3143 United States counties for property taxes as a percentage of median income.[176] According to a report prepared by the Pennsylvania Department of Education, the total real estate taxes collected by all school districts in Pennsylvania rose from $6,474,133,936 in 1999-00 to $10,438,463,356 in 2008-09 and to $11,153,412,490 in 2011.[177] Property taxes in Pennsylvania are relatively high on a national scale. According to the Tax Foundation, Pennsylvania ranked 11th in the U.S. in 2008 in terms of property taxes paid as a percentage of home value (1.34%) and 12th in the country in terms of property taxes as a percentage of income (3.55%).[178]
Act 1 Adjusted index
The Act 1 of 2006 Index regulates the rates at which each school district can raise property taxes in Pennsylvania. Districts are not permitted to raise taxes above that index, unless they allow voters to vote by referendum, or they seek an exception from the Pennsylvania Department of Education. The base index for the 2011-2012 school year is 1.4 percent, but the Act 1 Index can be adjusted higher, depending on a number of factors, such as property values and the personal income of district residents. Act 1 included 10 exceptions, including: increasing pension costs, increases in special education costs, a catastrophe like a fire or flood, increase in health insurance costs for contracts in effect in 2006 or dwindling tax bases. The base index is the average of the percentage increase in the statewide average weekly wage, as determined by the PA Department of Labor and Industry, for the preceding calendar year and the percentage increase in the Employment Cost Index for Elementary and Secondary Schools, as determined by the Bureau of Labor Statistics in the U.S. Department of Labor, for the previous 12-month period ending June 30. For a school district with a market value/personal income aid ratio (MV/PI AR) greater than 0.4000, its index equals the base index multiplied by the sum of .75 and its MV/PI AR for the current year.[179] With the 2011 state education budget, the General Assembly voted to end most of the Act 1 exceptions leaving only special education costs and pension costs. The cost of construction projects will go to the voters for approval via ballot referendum.[180] A specific timeline for Act I Index decisions is published annually, by the Pennsylvania Department of Education.[181]
The School District Adjusted Index for the Farrell Area School District 2006-2007 through 2012-2013.[182]
|
|
For the 2013-14 budget year, Farrell Area School Board did not apply for exceptions to exceed their Act 1 Index limit. For the school budget year 2013-14, 311 Pennsylvania public school districts adopted a resolution certifying that tax rates would not be increased above their index. Another 171 school districts adopted a preliminary budget leaving open the option of exceeded the Index limit. For the exception for pension costs, 89 school districts received approval to exceed the Index in full while others received a partial approval of their request. For special education costs, 75 districts received approval to exceed their tax limit. For the pension costs exception, 169 school districts received approval to exceed the Index. Eleven Pennsylvania public school districts received an approval for grandfathered construction debts.[184]
For the 2012-13 budget year, Farrell Area School Board also did not apply for exceptions to exceed the Act 1 Index. For 2012-2013, 274 school districts adopted a resolution certifying that tax rates would not be increased above their index; 223 school districts adopted a preliminary budget leaving open the option of exceeded the Index limit. For the exception for pension costs, 194 school districts received approval to exceed the Index. For special education costs, 129 districts received approval to exceed the tax limit.[185]
For the 2011-12 school year, Farrell Area School Board again did not apply for exceptions to exceed the Act 1 Index. Each year, the Farrell Area School Board has the option of adopting either 1) a resolution in January certifying they will not increase taxes above their index or 2) a preliminary budget in February. A school district adopting the resolution may not apply for referendum exceptions or ask voters for a tax increase above the inflation index. A specific timeline for these decisions is publisher each year by the Pennsylvania Department of Education.[181]
According to a state report, for the 2011-2012 school year budgets, 247 school districts adopted a resolution certifying that tax rates would not be increased above their index; 250 school districts adopted a preliminary budget. Of the 250 school districts that adopted a preliminary budget, 231 adopted real estate tax rates that exceeded their index. Tax rate increases in the other 19 school districts that adopted a preliminary budget did not exceed the school district’s index. Of the districts who sought exceptions 221 used the pension costs exemption and 171 sought a Special Education costs exemption. Only 1 school district sought an exemption for Nonacademic School Construction Project, while 1 sought an exception for Electoral debt for school construction.[186]
Farrell Area School Board did not apply for exceptions to exceed the Act 1 index for the budgets in 2009-10 or in 2010-11.[187][188] In the Spring of 2010, 135 Pennsylvania school boards asked to exceed their adjusted index. Approval was granted to 133 of them and 128 sought an exception for pension costs increases.[189]
Property tax relief
In 2011, property tax relief for 1,333 approved residents of Farrell Area School District was set at $199.[190] In 2009, the Homestead/Farmstead Property Tax Relief from gambling for the Farrell Area School District was $210 per approved permanent primary residence. In the district, 1,269 property owners applied for the tax relief.[191] The relief was subtracted from the total annual school property tax bill. Property owners apply for the relief through the county Treasurer's office. Farmers can qualify for a farmstead exemption on building used for agricultural purposes. The farm must be at least 10 contiguous acres (40,000 m2) and must be the primary residence of the owner. Farmers can qualify for both the homestead exemption and the farmstead exemption.[192]
Additionally, the Pennsylvania Property Tax/Rent Rebate program is provided for low income Pennsylvanians aged 65 and older; widows and widowers aged 50 and older; and people with disabilities age 18 and older. The income limit is $35,000 for homeowners. The maximum rebate for both homeowners and renters is $650. Applicants can exclude one-half (1/2) of their Social Security income, consequently individuals who have income substantially more than $35,000, may still qualify for a rebate. Individuals must apply annually for the rebate. This can be taken in addition to Homestead/Farmstead Property Tax Relief.[193]
Wellness policy
Farrell Area School Board established a district wellness policy.[194] The policy deals with nutritious meals served at school, the control of access to some foods and beverages during school hours, age appropriate nutrition education for all students, and physical education for students K-12. The policy is in response to state mandates and federal legislation (P.L. 108 – 265). The law dictates that each school district participating in a program authorized by the Richard B. Russell National School Lunch Act (42 U.S.C. 1751 et seq) or the Child Nutrition Act of 1966 (42 U.S.C. 1771 et seq) "shall establish a local school wellness policy by School Year 2006." Most districts identified the superintendent and school foodservice director as responsible for ensuring local wellness policy implementation.[195]
The legislation placed the responsibility of developing a wellness policy at the local level so the individual needs of each district can be addressed. According to the requirements for the Local Wellness Policy, school districts must set goals for nutrition education, physical activity, campus food provision, and other school-based activities designed to promote student wellness. Additionally, districts were required to involve a broad group of individuals in policy development and to have a plan for measuring policy implementation. Districts were offered a choice of levels of implementation for limiting or prohibiting low nutrition foods on the school campus. In final implementation these regulations prohibit some foods and beverages on the school campus.[196] The Pennsylvania Department of Education required the district to submit a copy of the policy for approval.
Farrell Area School District provides a universal, free school breakfast and free lunch program. All students attending the school can eat breakfast and lunch at no charge regardless of family income. No annual application from the family is required.[197] A free salad bar is provided to grades 6 through 12 at Farrell Junior Senior High School. The meals are partially funded with federal dollars through the United States Department of Agriculture.[198] The District removed sodas and sugary snacks from its vending machines, and making healthier substitutions in the school’s snack shop.
In 2013, the USDA issued new restrictions to foods in public schools. The rules apply to foods and beverages sold on all public school district campuses during the day. They limit vending machine snacks to a maximum of 200 calories per item. Additionally, all snack foods sold at school must meet competitive nutrient standards, meaning they must have fruits, vegetables, dairy or protein in them or contain at least 10 percent of the daily value of fiber, calcium, potassium, and Vitamin D.[199] In order to comply with the Healthy, Hunger-Free Kids Act of 2010 all US public school districts are required to raise the price of their school lunches to $2.60 regardless of the actual cost of the lunch.[200]
Farrell Area School District provides health services as mandated by the Commonwealth and the federal government. Nurses are available in each building to conduct annual health screenings (data reported to the PDE and state Department of Health) and to dispense prescribed medications to students during the school day. Students can be excluded from school unless they comply with all the State Department of Health’s extensive immunization mandates. School nurses monitor each pupil for this compliance.[201]
Highmark Healthy High 5 grant
In 2011, the Farrell Area School District received funding through a Highmark Healthy High 5 grant. Farrell High School received $8,640, which was used to fund ist Can Too program. Farrell Elementary School also received $8,640, which was also used for Can Too.[202] Beginning in 2006, Highmark Foundation engaged in a 5-year, $100 million program to promote lifelong healthy behaviors in children and adolescents through local nonprofits and schools.
Extracurriculars
Farrell Area School District offers a variety of clubs, activities and an extensive, costly sports program. Eligibility to participate is determined by school board policies.[203][204] The District operates a large indoor pool.
By Pennsylvania law, all K-12 students in the district, including those who attend a private nonpublic school, cyber charter school, charter school and those homeschooled, are eligible to participate in the extracurricular programs, including all athletics. They must meet the same eligibility rules as the students enrolled in the district's schools.[205]
Sports
The District funds:
|
|
- Junior High School Sports
|
|
According to PIAA directory July 2013 [206]
The Farrell Steelers have won 21 PIAA State Championships (8 girls volleyball, 7 boys basketball, 3 wrestling, 2 football, 1 girls track). The Steelers have also won a PA record 7 PIAA State Championships in boys basketball (1952,1954,1956,1959,1960,1969 and 1972) as well as a WPIAL record 13 WPIAL boys basketball championships (1951,1952,1954,1956,1959,1960,1969,1971,1972,1974,1976,1984,1992). Former coach Ed McCluskey led the school to all 7 state titles and is widely considered to be one of the best basketball coaches ever. He coached numerous Division 1 and professional players. The girls volleyball program won 8 PIAA state championships in the 1980s, 1990s, and 2000s under Harriett Morrison.
References
- ↑ Pennsylvania Department of Education (January 2009). "Farrell Area School District Enrollment and Projections,".
- ↑ Davidson, Tom., Tax hike brings pay raises, The Herald, June 11, 2013
- ↑ Davidson, Tom., School board OKs tax increase, layoffs, The Herald, June 26, 2012
- ↑ Leiker, Joy., Final budget cuts six teacher jobs, The Herald, June 30, 2011
- ↑ Federal Education Budget Project (2010). "Farrell Area School District data report".
- ↑ US Census Bureau, 2010 Census Poverty Data by Local Educational Agency, 2011
- ↑ American Fact Finder, US Census Bureau, 2009
- ↑ Pennsylvania General Assembly. "Pennsylvania Public School Code Governance 2010 - Title-22".
- ↑ The Commonwealth Foundation for Public Policy Alternatives. "The Pennsylvania Project". Retrieved July 2011. Check date values in:
|access-date=(help) - ↑ Pennsylvania Department of Education (July 2012). "Opportunity Scholarship Tax Credit Program".
- ↑ Pennsylvania Department of Education (May 2012). "Tuition rate Fiscal Year 2011-2012".
- ↑ Olsen, Laura, State list of failing schools has 53 in county, Pittsburgh Post Gazette, July 26, 2012
- ↑ Pennsylvania Department of Education (2009). "Race to the Top for Pennsylvania Schools".
- ↑ The Morning Call (2009). "2009 PSSA RESULTS Farrell Area School District".
- ↑ Pittsburgh Business Times (April 5, 2013). "Guide to Pennsylvania Schools Statewide ranking 2013".
- ↑ "Statewide Honor Roll Rankings 2013". Pittsburgh Business Times. April 5, 2013.
- ↑ Pittsburgh Business Times (April 2, 2011). "Statewide Honor Roll Rankings Information,".
- ↑ Pittsburgh Business Times (April 20, 2010). "Statewide Honor Roll Rankings,".
- ↑ Pittsburgh Business Times (2007). "Three of top school districts in state hail from Allegheny County".
- ↑ Pittsburgh Business Times, Statewide Overachivers Ranking Information, April 4, 2013
- ↑ "Overachiever statewide ranking". Pittsburgh Business Times. May 6, 2010.
- ↑ Pennsylvania Department of Education (September 21, 2012). "Farrell Area School District AYP Overview 2012".
- ↑ Pennsylvania Department of Education, Pennsylvania Public School District AYP History, 2011
- ↑ Pennsylvania Department of Education, Pennsylvania District AYP History 2003-2010, 2011
- ↑ Pennsylvania Department of Education (September 21, 2012). "Farrell Area School District AYP Data Table 2012".
- ↑ Pennsylvania Department of Education, Farrell Are School District AYP Data Table 2011, September 29, 2011
- ↑ Pennsylvania Department of Education (March 15, 2011). "New 4-year Cohort Graduation Rate Calculation Now Being Implemented".
- ↑ Pennsylvania Department of Education (2010). "Farrell Area High School /UMS - School AYP Data Table".
- ↑ Pennsylvania Department of Education (2009). "Farrell Area High School UMC Academic Achievement Report Card 2009".
- ↑ Pennsylvania Partnership for Children (2008). "PA High School Graduation Info by School District 2007".
- ↑ National Center for Education Statistics, Common Care Data - Farrell High School, 2010
- ↑ Pennsylvania Department of Education, Professional Qualifications of Teachers Farrell High School 2012, September 21, 2012
- ↑ National Center for Education Statistics, Common Core Data - Farrell Area Upper MIddle School/High School, 2010
- ↑ Pennsylvania Department of Education, Farrell High School AYP Overview2011, September 29, 2011
- ↑ Pennsylvania Department of Education (July 2011). "FARRELL AREA HS/UMS - School AYP Overview".
- ↑ US Department of Education, (2003). "NCLB Parental Notices" (PDF).
- ↑ Pennsylvania Department of Education (September 29, 2012). "2011-2012 PSSA and AYP Results".
- ↑ Pennsylvania Department of Education (September 29, 2011). "2010-2011 PSSA and AYP Results".
- ↑ Pennsylvania Department of Education (2010). "Farrell Area High School/UMS Academic Achievement Report Card 2010" (PDF).
- ↑ Pennsylvania Department of Education (2009). "PSSA Math and Reading results by School 2009".
- ↑ Pennsylvania Department of Education (2008). "PSSA Math and Reading results by School 2008".
- ↑ Pennsylvania Department of Education (2007). "PSSA Math and Reading results by School 2007".
- 1 2 3 Pittsburgh Post Gazette (October 15, 2012). "How is your school doing?".
- ↑ Pennsylvania Department of Education, Farrell Area High School Academic Achievement Report Card 2011, September 29, 2011
- ↑ Pennsylvania Department of Education (September 14, 2009). "Farrell Area High School/UMS Academic Achievement Report Card 2009".
- ↑ Pennsylvania Department of Education (September 21, 2012). "Farrell High School Academic Achievement Report Card 2012" (PDF).
- ↑ Pennsylvania Department of Education (September 29, 2011). "2010-2011 PSSA results in Science".
- ↑ Pennsylvania Department of Education (August 2008). "Report on Science PSSA 2008".
- ↑ The Pennsylvania Basic Education/Higher Education Science and Technology Partnership, Science in Motion annual report, 2012
- ↑ Pennsylvania Department of Education (January 2009). "Pennsylvania College Remediation Report".
- ↑ National Center for Education Statistics
- ↑ Pennsylvania Department of Education (2010). "Dual Enrollment Guidelines".
- ↑ Commonwealth of Pennsylvania (March 2010). "Pennsylvania Transfer and Articulation Agreement".
- ↑ Pennsylvania Department of Education (April 29, 2010). "PA College Credit Transfer System Makes Higher Education More Affordable, Accessible,".
- ↑ Pennsylvania Department of Education (August 2009). "Dual Enrollment Fall Grants 2009-10.".
- ↑ Pennsylvania Department of Education (2011). "Public School SAT Scores 2011".
- ↑ College Board (September 2011). "SAT Scores State By State - Pennsylvania".
- ↑ "While U.S. SAT scores dip across the board, N.J. test-takers hold steady". NJ.com. September 2011.
- ↑ Farrell Area School District Administration (2010). "Farrell Area School District Graduation Requirements" (PDF).
- ↑ "Pennsylvania Code §4.24 (a) High school graduation requirements".
- ↑ Pennsylvania State Board of Education, Proposed changes to Chapter 4, May 10, 2012
- ↑ Pennsylvania Department of Education (2010). "Keystone Exam Overview" (PDF).
- ↑ Pennsylvania Department of Education (September 2011). "Pennsylvania Keystone Exams Overview".
- ↑ Pennsylvania State Board of Education (2010). "Rules and Regulation Title 22 PA School Code CH. 4".
- ↑ Pennsylvania Department of Education, State Board of Education Finalizes Adoption of Pennsylvania Common Core State Academic Standards and High School Graduation Requirements, March 14, 2013
- ↑ Pennsylvania Department of Education (2011). "Keystone Exams".
- ↑ Pennsylvania Department of Education (2010). "Farrell Area School District Academic Achievement Report Card 2010" (PDF).
- ↑ Pennsylvania Department of Education (August 2008). "Reading and Math PSSA 2008 by Schools".
- ↑ Pennsylvania Department of Education Report (September 14, 2010). "2010 PSSAs: Reading, Math, Writing and Science Results".
- ↑ 2009 PSSAs: Reading, Math, Writing and Science Results Pennsylvania Department of Education Report
- ↑ Pennsylvania Department of Education Report (August 2009). "Science PSSA 2009 by Schools".
- ↑ Pennsylvania Department of Education Report (August 2008). "Science PSSA 2008 by Schools".
- ↑ National Center for Education Statistics, Common Care Data – Farrell Area Elementary School, 2011
- ↑ Pennsylvania Department of Education, Professional Qualifications of Teachers Farrell Area Elementary School, September 21, 2012
- ↑ Pennsylvania Department of Education, Farrell Area School District Academic Report Card 2012, 2012
- ↑ Pennsylvania Department of Education (September 29, 2011). "FARRELL AREA Elementary School /Lower Middle School".
- ↑ Pennsylvania Department of Education, Farrell Area Elementary School AYP Overview 2010, October 20, 2010
- ↑ Farrell Area School District Administration (August 2010). "Farrell Area Elementary School Notice of Adequate Yearly Progress" (PDF).
- ↑ Pennsylvania Department of Education (September 21, 2012). "FARRELL AREA Elementary School Academic Achievement Report Card 2012" (PDF).
- ↑ Pennsylvania Department of Education, FARRELL AREA Elementary School Academic Achievement Report Card 2011, September 29, 2011
- ↑ Pennsylvania Department of Education, FARRELL AREA Elementary School Academic Achievement Report Card 2010, October 20, 2010
- ↑ Pennsylvania Department of Education, FARRELL AREA Elementary School Academic Achievement Report Card 2009, September 14, 2009
- ↑ Pennsylvania Department of Education, FARRELL AREA Elementary School Academic Achievement Report Card 2008, August 14, 2008
- ↑ Pennsylvania Department of Education, FARRELL AREA Elementary School Academic Achievement Report Card 2007, 2007
- ↑ Pennsylvania Department of Education (September 29, 2011). "FARRELL AREA Elementary School Academic Achievement Report Card 2011" (PDF).
- ↑ Pennsylvania Bureau of Special Education Services (2010). "Farrell Area SD Special Education Data Report LEA Performance on State Performance Plan (SPP) Targets".
- ↑ Pennsylvania House Majority Policy Committee (2010). "PA House Majority Policy Committee May 12, 2010 Hearing Testimony and Handouts".
- ↑ Farrell Area School District Administration (2010). "Farrell Area School District Annual Public Notice 2010" (PDF).
- ↑ Pennsylvania Department of Education. "Pennsylvania Special Education Funding".
- ↑ Browne, Patrick., Senate Education Committee Hearing on Special Education Funding & Accountability testimony, November 1, 2011
- ↑ Kintisch, Baruch., Public Hearing: Special Education Funding & Accountability Testimony, Education Law Center, November 11, 2011
- ↑ Amy Morton, Executive Deputy Secretary, Public Hearing: Special Education Funding & Accountability Testimony, Pennsylvania Department of Education, November 11, 2011
- ↑ US Department of Education, U.S. Department of Education Clarifies Schools' Obligation to Provide Equal Opportunity to Students with Disabilities to Participate in Extracurricular Athletics, January 25, 2013
- ↑ Pennsylvania Department of Education (July 2010). "Special Education Funding from Pennsylvania State_2010-2011".
- ↑ Pennsylvania Department of Education (2011). "Special Education Funding 2011-2012 Fiscal Year".
- ↑ Pennsylvania Department of Education, (April 2012). "Investing in PA kids,".
- ↑ Pennsylvania Department of Education (Revised December 1, 2009 Child Count (Collected July 2010)). "Gifted Students as Percentage of Total Enrollment by School District/Charter School" (PDF). Check date values in:
|date=(help) - ↑ Pennsylvania Department of Education and Pennsylvania School Board. "CHAPTER 16. Special Education For Gifted Students". Retrieved February 4, 2011.
- ↑ Pennsylvania Department of Education (2010). "Farrell Area SD School Safety Annual Report 2009 - 2010" (PDF).
- ↑ Pennsylvania Department of Education (2010). "Pennsylvania Safe Schools Online Reports".
- ↑ Farrell Area School District Administration (2009). "Farrell Area School District Student Handbook 2010" (PDF).
- ↑ Pennsylvania General Assembly (2007). "Regular Session 2007-2008 House Bill 1067, Act 61 Section 6 page 8".
- ↑ Center for Safe Schools of Pennsylvania, (2008). "Bullying Prevention advisory".
- ↑ Pennsylvania State Board of Education (January 11, 2003). "Pennsylvania Academic Standards".
- ↑ Pennsylvania Department of Education (July 20, 2010). "Pennsylvania Public School Enrollments and enrollment projections by school district A-F.".
- ↑ Fenton, Jacob. (February 2009). "Pennsylvania School District Data: Will School Consolidation Save Money?". The Morning Call.
- ↑ Pennsylvania Legislative Budget; Finance Committee (2007). "Study of the cost-effectiveness of consolidating".
- ↑ Fenton, Jacob, (July 2009). "Administrative Costs for Mercer County School Districts 2007-08,". The Morning Call.
- ↑ Edward Rendell, Governor and Mary Soderberg, Secretary of the Budget. (February 2009). "2009-10 Executive Budget Facts Pennsylvania School District Consolidation," (PDF).
- ↑ "Report of the Fiscal Responsibility Task Force" (PDF). Retrieved April 2011. Check date values in:
|access-date=(help) - ↑ Jeff Blumenthal (March 7, 2011). "Pennsylvania accountants share budget-cutting ideas". Pennsylvania Business Journal.
- ↑ The Center for Rural Pennsylvania. (October 2009). "Research Analyzes Rural School District Enrollment and Building Capacity" (PDF).
- ↑ Rendell, E.; Soderberg, M. (2009). "Pennsylvania school district consolidation. 2009-10 Executive Budget Fast Facts." (PDF). Pennsylvania Office of the Governor.
- ↑ New York: Standard & Poor’s School Evaluation Services (2007). "Study of the cost-effectiveness of consolidating Pennsylvania districts.".
- ↑ Pennsylvania General Assembly, Taxpayer Relief Act, Act 1 of the Special Session of 2006, June 27, 2006
- ↑ Pennsylvania Department of Education (2012). "Investing in Pennsylvania Students".
- ↑ Commonwealth Court of Pennsylvania (2010). "McFERREN v. FARRELL AREA SCHOOL DISTRICT".
- ↑ Openpagov.com (2009). "Farrell Area School District Payroll report".
- ↑ Farrell Area School Board. "Farrell Area Teacher Union Employment Contract 2006-11". Retrieved 2011. Check date values in:
|access-date=(help) - ↑ Legislature must act on educators' pension hole. The Patriot News. February 21, 2010
- ↑ Pennsylvania School Board Association. "School Pension Information".
- ↑ Fenton, Jacob., Average classroom teacher salaries in Mercer County, 2006-07, The Morning Call, March 2009
- ↑ Teachers need to know enough is enough, PaDelcoTimes, April 20, 2010.
- ↑ "Per Pupil Spending in Pennsylvania Public Schools in 2008 Sort by Administrative Spending". 2008.
- ↑ US Census Bureau, States Ranked According to Per Pupil Public Elementary-Secondary School System Finance Amounts: Fiscal Year 2011, May 2013
- ↑ US Census Bureau (2009). "Total and current expenditures per pupil in fall enrollment in public elementary and secondary education, by function and state or jurisdiction: 2006-07".
- ↑ US Census Bureau (March 2003). "Public Education Finances 2000-01 Annual Survey of Local Government Finances" (PDF).
- ↑ United States Census Bureau (2009). "States Ranked According to Per Pupil Elementary-Secondary Public School System Finance Amounts: 2008-09" (PDF).
- ↑ US Census Bureau (May 2013). "States Ranked According to Per Pupil Public Elementary-Secondary School System Finance Amounts: Fiscal Year 2011" (PDF).
- ↑ Pennsylvania Department of Education Report 2008 (2008). "General Reserved Fund Balance by School District 1996-2008,".
- ↑ Jan Murphy (September 22, 2010). "Pennsylvania's public schools boost reserves".
- ↑ Pennsylvania Auditor General (2002). "Special Investigation Farrell Area School District" (PDF).
- ↑ Pennsylvania Auditor General (April 2011). "Farrell Area School District, Pennsylvania Performance Audit Report".
- ↑ Pennsylvania Auditor General (June 2013). "Farrell Area School District MERCER COUNTY, PENNSYLVANIA PERFORMANCE AUDIT REPORT 2013" (PDF).
- ↑ Pennsylvania Department of Education (May 2012). "Pennsylvania Public School District Tuition Rates".
- ↑ Pennsylvania Department of Revenue (April 2010). "Personal Income Taxation Guidelines".
- ↑ John Finnerty (2013). "PA teachers pensions". CNHI Harrisburg Bureau.
- ↑ Democrat Appropriations Committee, Report on Education funding by LEA, July 2, 2013
- ↑ Pennsylvania Office of the Budget, 2013-14 State Budget Highlights, 2013
- ↑ Senator Jake Corman (June 28, 2012). "Pennsylvania Education funding by Local School District" (PDF).
- ↑ Pennsylvania General Assembly Sen Jake Corman (June 29, 2012). "SB1466 of 2012 General Fund Appropriation".
- ↑ Pennsylvania Department ofEducation (July 2011). "Pennsylvania 2011-2012 Estimated Basic Education Funding".
- ↑ PA Senate Appropriations Committee (June 28, 2011). "School District 2011-12 funding Report".
- ↑ Pennsylvania Department of Education (June 30, 2011). "Basic Education Funding 2011-2012 Fiscal Year".
- ↑ Pennsylvania House Appropriations Committee (June 2010). "PA Basic Education Funding-Printout2 2010-2011".
- ↑ Office of the Budget (February 2010). "Pennsylvania Budget Proposal 2010".
- ↑ Pennsylvania Department of Education (October 2009). "Basic Education Funding report".
- ↑ Office of Budget, (February 2010). "Governor's Budget Proposal 2010,".
- ↑ Pennsylvania Department of Education (2010). "ACCOUNTABILITY BLOCK GRANT Awards".
- ↑ Pennsylvania Department of Education (2006). "PA-PACT Information".
- ↑ Pennsylvania Department of Education (2010). "2009–2010 Accountability block Grant Mid-year report" (PDF).
- ↑ Pennsylvania Auditor General (2008-12-22). "Special Performance Audit Classrooms For the Future grants" (PDF).
- ↑ Pennsylvania Department of Education, Science: It’s Elementary Grantees Students in 143 Schools Benefit from Intensive Science Curriculum, July 22, 2008
- ↑ Patricia Vathis Pennsylvania Department of Education, Grants and Subsidies Science: It’s Elementary, 2006
- ↑ Pennsylvania Department of Education, 2010-11 Science: It’s Elementary Application Guidelines, July 2010
- ↑ Pennsylvania Department of Education (2010). "Educational Assistance Program Funding 2010-2011 Fiscal Year".
- ↑ Courtney L. Anderson (January 2009). "Local schools would share $14.6 million of stimulus package". The Herald.
- ↑ Governor's Press Office. (January 20, 2010). "Pennsylvania's 'Race to the Top' Fueled by Effective Reforms, Strong Local Support,".
- ↑ Pennsylvania Department of Education Secretary Gerald Zahorchek (December 2009). "Pennsylvania Race to the Top Letter to Superintendents".
- ↑ Courtney L. Anderson (January 16, 2010). "Schools eye 'Race to the Top' Seek share of U.S. education grant".
- ↑ Pennsylvania's 'Race to the Top' Fueled by Effective Reforms, Strong Local Support
- ↑ U.S. Department of Education (March 29, 2010). "Race to the Top Fund".
- ↑ Afterschoolalliance.org, 21st Century Community Learning Grants in Pennsylvania, 2005
- ↑ Sharon Herald (August 19, 2010). "Funding for Farrell High School Library".
- ↑ Pennsylvania Department of Education. "Common Cents program - Making Every Dollar Count". Retrieved February 1, 2011.
- ↑ Pennsylvania Department oF Education (July 2011). "Common Cents – Making Every Dollar Count".
- ↑ Pennsylvania Auditor General Bob Casey Jr. (2002). "Casey School District Performance Review - Farrell Area School District".
- ↑ Pennsylvania Department of Education (2004). "Act 511 Tax Report".
- ↑ Joy Leiker (June 30, 2011). "Final budget cuts six teacher jobs".
- ↑ Pennsylvania Department of Education (2010). "Real Estate Tax Millage by School District,".
- ↑ Pennsylvania Department of Education (2009). "Real Estate Tax Millage by School District,".
- ↑ Pennsylvania Department of Education (2008). "Pennsylvania School District Real Estate Tax Rates 2008-09".
- ↑ Pennsylvania Department of Education (2008). "Real Estate Tax Millage by School District,".
- ↑ Pennsylvania Department of Education, Real Estate Tax Millage by School District, 2006
- ↑ Pennsylvania Department of Education, Real Estate Tax Millage by School District, 2005
- ↑ Tax-rates.org., The 2013 Tax Resource County Property Taxes 2012, 2012
- ↑ Pennsylvania Department of Education, Pennsylvania School Finances - Summaries of Annual Financial Report Data 2010-11, 2011
- ↑ New Census Data on Property Taxes on Homeowners, Tax Foundation, September 22, 2009.
- ↑ Pennsylvania Department of Education 2010-11 Act 1 of 2006 Referendum Exception Guidelines.
- ↑ Pittsburgh Post Gazette (July 28, 2011). "Law could restrict school construction projects". Pittsburgh Post-Gazette.
- 1 2 Pennsylvania Department of Education (2011). "Special Session Act 1 of 2006 the Taxpayer Relief Act information".
- ↑ Pennsylvania Department of Education (May 2010). "Special Session Act 1 of 2006 School District Adjusted Index for 2006-2007 through 2011-2012,".
- ↑ Pennsylvania Department of Education, 2013-2014 School District Adjusted Index, May 2012
- ↑ Pennsylvania Department of Education, Report on Referendum Exceptions For School Year 2013-2014, April 2013
- ↑ Pennsylvania Department of Education, Report on Referendum Exceptions For School Year 2012-2013, March 30, 2012
- ↑ Pennsylvania Department of Education (April 2011). "Report on Exceptions".
- ↑ Pennsylvania Department of Education (April 2010). "Pennsylvania SSAct1_Act1 Exceptions Report 2010-2011 April 2010".
- ↑ Pennsylvania Department of Education (April 2009). "Pennsylvania SSAct1 Exception requests Report_2009-2010_May 2009".
- ↑ Scarcella, Frank; Pursell, Tricia, (May 25, 2010). "Local school tax assessments exceed state averages". The Daily Item.
- ↑ Pennsylvania Department of Education (May 3, 2010). "Tax Relief per Homestead".
- ↑ Pennsylvania Department of Education (May 1, 2009). "Estimated Tax Relief Per Homestead and Farmstead 2009" (PDF).
- ↑ Pennsylvania Auditor General Office (February 23, 2010). "Special Report Pennsylvania Property Tax Relief,".
- ↑ Pennsylvania Department of Education. "Property Tax/Rent Rebate Program".
- ↑ Farrell Area School Board Policy Manual, Student Wellness Policy, 2006
- ↑ Probart C, McDonnell E, Weirich JE, Schilling L, Fekete V (September 2008). "Statewide assessment of local wellness policies in Pennsylvania public school districts.". J Am Diet Assoc. 108 (9): 1497–502. doi:10.1016/j.jada.2008.06.429. PMID 18755322.
- ↑ Pennsylvania Department of Education – Division of Food and Nutrition (July 2008). "Nutrition Standards for Competitive Foods in Pennsylvania Schools for the School Nutrition Incentive".
- ↑ USDA, Child Nutrition Programs - Eligibility Manual for School Meals, 2012
- ↑ Pennsylvania Hunger Action Center, The Pennsylvania School Breakfast Report Card, 2009
- ↑ USDA, Child Nutrition Programs, June 27, 2013
- ↑ United States Department of Agriculture (2011). "Food and Nutrition Service Equity in School Lunch Pricing Fact Sheet" (PDF).
- ↑ Pennsylvania State Department of Health (2010). "Pennsylvania Bulletin Doc. No. 10-984 School Immunizations; Communicable and Noncommunicable Diseases".
- ↑ Highmark Foundation, 2011 School Challenge Grants, 2011
- ↑ Farrell Area School Board (March 14, 1994). "Farrell Area School District Co-Curricular Activities Policy 122".
- ↑ Farrell Area School Board, Farrell Area School District Interscholastic Athletics Policy 123, March 14, 1994
- ↑ Home-Schooled, Charter School Children Can Participate in School District Extracurricular Activities, Pennsylvania Office of the Governor Press Release, November 10, 2005
- ↑ Pennsylvania Interscholastic Athletics Association, PIAA School Directory, 2013
Mercer County, Pennsylvania Schools | |||||||||||||||||||||||||||||||||||||||||||||||||
|---|---|---|---|---|---|---|---|---|---|---|---|---|---|---|---|---|---|---|---|---|---|---|---|---|---|---|---|---|---|---|---|---|---|---|---|---|---|---|---|---|---|---|---|---|---|---|---|---|---|
| |||||||||||||||||||||||||||||||||||||||||||||||||
| |||||||||||||||||||||||||||||||||||||||||||||||||