Demographics of Kyrgyzstan
| Demographics of Kyrgyzstan | |
|---|---|
|
Population of Kyrgyzstan (in millions) from 1950-2009 | |
| Population | 5,776,500 (2014 est.)[1] |
| Density | 27.4/km2; 71/sq mi |
| Growth rate | 1.32/1,000 population (2010 est.) |
| Birth rate | 22.88 births/1,000 population (2010 est.) |
| Death rate | 2.69 deaths/1,000 population (2010 est.) |
| Life expectancy | 69.43 years |
| • male | 65.53 years |
| • female | 73.64 years (2009 est.) |
| Fertility rate | 2.65 children born/woman (2010 est.) |
| Infant mortality rate | 31.26 deaths/1,000 live births |
| Age structure | |
| 0–14 years | 23.6% |
| 15–64 years | 62.9% |
| 65 and over | 6.2% |
| Sex ratio | |
| At birth | 1.05 male(s)/female |
| Under 15 | 1.04 male(s)/female |
| 15–64 years | 0.96 male(s)/female |
| 65 and over | 0.64 male(s)/female |
| Nationality | |
| Nationality | Kyrgyzstani |
| Major ethnic | Kyrgyz |
| Minor ethnic | Russian, Uzbek, Dungan, Uyghur |
| Language | |
| Official | Kyrgyz |
| Spoken | Kyrgyz, Russian |

The Demographics of Kyrgyzstan is about the demographic features of the population of Kyrgyzstan, including population growth, population density, ethnicity, education level, health, economic status, religious affiliations, and other aspects of the population. The name Kyrgyz, both for the people and the country, means "forty girls" or "forty tribes", a reference to the epic hero Manas who unified forty tribes against the Oirats, as symbolized by the 40-ray sun on the flag of Kyrgyzstan.
Demographic trends
Kyrgyzstan's population increased from 2.1 million to 4.8 million between the censuses of 1959 and 1999.[2] Official estimates set the population at 5.2 million in 2007.[1] Of those, 34.4% are under the age of 15 and 6.2% are over the age of 65. The country is rural: only about one-third of Kyrgyzstan's population live in urban areas. The average population density is 69 people per square mile (29 people per km²).
The nation's largest ethnic group are the Kyrgyz, a Turkic people, which comprise 70.9% of the population (2009 census). Other ethnic groups include Russians (9.0%) concentrated in the north and Uzbeks (14.5%) living in the south. Small but noticeable minorities include Dungans (1.9%), Uyghurs (1.1%), Tajiks (1.1%), Kazakhs (0.7%) and Ukrainians (0.5%), and other smaller ethnic minorities (1.7%). Of the formerly sizable Volga German community, exiled here by Joseph Stalin from their earlier homes in the Volga German Republic, most have returned to Germany, and only a few small groups remain. A small percentage of the population are also Koreans, who are the descendants of the Koreans deported in 1937 from the Soviet Far East to Central Asia.
Kyrgyzstan has undergone a pronounced change in its ethnic composition since independence.[3][4] The percentage of ethnic Kyrgyz increased from around 50% in 1979 to nearly 70% in 2007, while the percentage of European ethnic groups (Russians, Ukrainians and Germans) dropped from 35% to about 10%.[1][2]
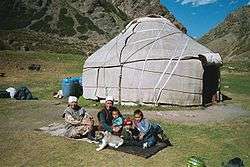
The Kyrgyz have historically been semi-nomadic herders, living in round tents called yurts and tending sheep, horses and yaks. This nomadic tradition continues to function seasonally (see transhumance) as herding families return to the high mountain pasture (or jailoo) in the summer. The retention of this nomadic heritage and the freedoms that it implies continue to affect the political atmosphere in the country.
Vital statistics
Births and deaths
Statistics are taken from the United Nations Demographic Yearbook, the National Statistical Committee of the Republic of Kyrgyzstan, the Demographic Annual of the Kyrgyz Republic, and Demoskop Weekly.[5][6][7][8][9][10]
| Average population (x 1000) | Live births | Deaths | Natural change | Crude birth rate (per 1000) | Crude death rate (per 1000) | Natural change (per 1000) | TFR | |
|---|---|---|---|---|---|---|---|---|
| 1950 | 1 740 | 56 471 | 14 845 | 41 626 | 32.5 | 8.5 | 23.9 | |
| 1951 | 1 768 | 58 828 | 13 927 | 44 901 | 33.3 | 7.9 | 25.4 | |
| 1952 | 1 788 | 57 632 | 13 868 | 43 764 | 32.2 | 7.8 | 24.5 | |
| 1953 | 1 818 | 60 755 | 14 288 | 46 467 | 33.4 | 7.9 | 25.6 | |
| 1954 | 1 859 | 63 803 | 13 684 | 50 119 | 34.3 | 7.4 | 26.7 | |
| 1955 | 1 903 | 63 883 | 14 923 | 48 960 | 33.6 | 7.8 | 25.7 | |
| 1956 | 1 941 | 65 667 | 11 918 | 53 749 | 33.8 | 6.1 | 27.7 | |
| 1957 | 1 978 | 68 644 | 12 275 | 56 369 | 34.7 | 6.2 | 28.5 | |
| 1958 | 2 030 | 70 521 | 12 324 | 58 197 | 34.7 | 6.1 | 28.7 | |
| 1959 | 2 099 | 70 501 | 12 930 | 57 571 | 33.6 | 6.2 | 27.4 | |
| 1960 | 2 172 | 80 209 | 13 259 | 66 950 | 36.9 | 6.1 | 30.8 | |
| 1961 | 2 256 | 80 671 | 15 175 | 65 496 | 35.8 | 6.7 | 29.1 | |
| 1962 | 2 333 | 79 010 | 15 141 | 63 869 | 33.9 | 6.5 | 27.4 | |
| 1963 | 2 413 | 80 279 | 14 986 | 65 293 | 33.3 | 6.2 | 27.1 | |
| 1964 | 2 495 | 79 342 | 15 834 | 63 508 | 31.8 | 6.3 | 25.5 | |
| 1965 | 2 573 | 80 812 | 16 693 | 64 119 | 31.4 | 6.5 | 24.9 | |
| 1966 | 2 655 | 81 771 | 17 888 | 63 883 | 30.8 | 6.7 | 24.1 | |
| 1967 | 2 737 | 83 609 | 19 550 | 64 059 | 30.5 | 7.1 | 23.4 | |
| 1968 | 2 818 | 86 741 | 19 840 | 66 901 | 30.8 | 7.0 | 23.8 | |
| 1969 | 2 896 | 87 210 | 21 683 | 65 527 | 30.1 | 7.5 | 22.6 | |
| 1970 | 2 964 | 90 442 | 21 828 | 68 614 | 30.5 | 7.4 | 23.1 | |
| 1971 | 3 028 | 95 932 | 21 343 | 74 589 | 31.7 | 7.0 | 24.7 | |
| 1972 | 3 094 | 94 923 | 23 157 | 71 766 | 30.7 | 7.5 | 23.2 | |
| 1973 | 3 160 | 97 421 | 24 181 | 73 240 | 30.8 | 7.7 | 23.1 | |
| 1974 | 3 230 | 99 433 | 23 747 | 75 686 | 30.8 | 7.4 | 23.4 | |
| 1975 | 3 299 | 101 287 | 26 920 | 74 367 | 30.7 | 8.2 | 22.5 | |
| 1976 | 3 365 | 106 606 | 27 864 | 78 742 | 31.7 | 8.3 | 23.4 | |
| 1977 | 3 430 | 104 971 | 28 510 | 76 461 | 30.6 | 8.3 | 22.3 | |
| 1978 | 3 495 | 106 176 | 28 385 | 77 791 | 30.4 | 8.1 | 22.3 | |
| 1979 | 3 558 | 107 091 | 29 578 | 77 513 | 30.1 | 8.3 | 21.8 | |
| 1980 | 3 628 | 107 278 | 30 460 | 76 818 | 29.6 | 8.4 | 21.2 | |
| 1981 | 3 699 | 113 434 | 29 591 | 83 843 | 30.7 | 8.0 | 22.7 | |
| 1982 | 3 775 | 117 235 | 29 194 | 88 041 | 31.1 | 7.7 | 23.4 | |
| 1983 | 3 857 | 120 708 | 30 241 | 90 467 | 31.3 | 7.8 | 23.5 | |
| 1984 | 3 937 | 126 075 | 32 603 | 93 472 | 32.0 | 8.3 | 23.7 | |
| 1985 | 4 014 | 128 460 | 32 332 | 96 128 | 32.0 | 8.1 | 23.9 | |
| 1986 | 4 093 | 133 728 | 29 083 | 104 645 | 32.7 | 7.1 | 25.6 | |
| 1987 | 4 173 | 136 588 | 30 597 | 105 991 | 32.7 | 7.3 | 25.4 | |
| 1988 | 4 250 | 133 710 | 31 879 | 101 831 | 31.5 | 7.5 | 24.0 | |
| 1989 | 4 327 | 131 508 | 31 156 | 100 352 | 30.4 | 7.2 | 23.2 | |
| 1990 | 4 395 | 128 810 | 30 580 | 98 230 | 29.3 | 7.0 | 22.4 | |
| 1991 | 4 464 | 129 536 | 30 859 | 98 677 | 29.0 | 6.9 | 22.1 | |
| 1992 | 4 515 | 128 352 | 32 163 | 96 189 | 28.4 | 7.1 | 21.3 | |
| 1993 | 4 515 | 116 795 | 34 513 | 82 282 | 25.9 | 7.6 | 18.2 | |
| 1994 | 4 513 | 110 113 | 37 109 | 73 004 | 24.4 | 8.2 | 16.2 | |
| 1995 | 4 560 | 117 340 | 36 915 | 80 425 | 25.7 | 8.1 | 17.6 | |
| 1996 | 4 628 | 108 007 | 34 562 | 73 445 | 23.3 | 7.5 | 15.9 | |
| 1997 | 4 696 | 102 050 | 34 540 | 67 510 | 21.7 | 7.4 | 14.4 | |
| 1998 | 4 769 | 104 183 | 34 596 | 69 587 | 21.8 | 7.3 | 14.6 | |
| 1999 | 4 837 | 104 068 | 32 850 | 71 218 | 21.5 | 6.8 | 14.7 | |
| 2000 | 4 888 | 96 770 | 34 111 | 62 659 | 19.8 | 7.0 | 12.8 | |
| 2001 | 4 927 | 98 138 | 32 677 | 65 461 | 19.9 | 6.6 | 13.3 | |
| 2002 | 4 965 | 101 012 | 35 235 | 65 777 | 20.3 | 7.1 | 13.2 | |
| 2003 | 5 011 | 105 490 | 35 941 | 69 549 | 21.1 | 7.2 | 13.9 | |
| 2004 | 5 065 | 109 939 | 35 061 | 74 878 | 21.7 | 6.9 | 14.8 | |
| 2005 | 5 116 | 109 839 | 36 992 | 72 847 | 21.5 | 7.2 | 14.2 | |
| 2006 | 5 164 | 120 737 | 38 566 | 82 171 | 23.4 | 7.5 | 15.9 | |
| 2007 | 5 207 | 123 251 | 38 180 | 85 071 | 23.7 | 7.3 | 16.3 | |
| 2008 | 5 250 | 127 332 | 37 710 | 89 622 | 24.3 | 7.2 | 17.1 | |
| 2009 | 5 383 | 135 494 | 35 898 | 99 596 | 26.4 | 7.0 | 19.4 | 2.876 |
| 2010 | 5 448 | 146 123 | 36 174 | 109 949 | 26.8 | 6.6 | 20.2 | 3.1 |
| 2011 | 5 515 | 149 612 | 35 941 | 113 671 | 27.1 | 6.5 | 20.6 | 3.1 |
| 2012 | 5 608 | 154 918 | 36 186 | 118 732 | 27.6 | 6.8 | 20.8 | 3.2 |
| 2013 | 5 720 | 155 520 | 34 880 | 120 640 | 27.2 | 6.1 | 21.1 | 3.1 |
| 2014 | 5 836 | 161 813[10] | 35 964 | 129 434 | 27.7 | 6.1 | 21.6 | 3.2 |
Total fertility rate
2.65 children born/woman (2009 est.)
The differences in the number of children by nationality are significant:[3][4] Uzbeks (3.0 children), Tajiks (3.0 children), Turks (2.9), Kyrgyz (2.9), Dungans (2.8) Russians (1.7), Koreans (1.7), Germans (1.8), Ukrainians (2.1), Tatars (2.1), Kazakhs (2.3) and Ugyhurs (2.5).[2] The TFR for Russians, Ukrainians, Germans, and Koreans in Kyrgyzstan are considerably higher than in their home countries, possibly due to the much lower cost of living.
Ethnic groups
According to the 1999 census,[2] the ethnic composition of the population was as follows: Kyrgyz 72.6%, Uzbeks 14.4%, Russians 6.4%, Dungans 1.1%, Uyghurs 0,9%, other 3.6%, including Koreans 0.4% and Germans 0.4% (among them Low German-speaking Mennonites). Most Russians, Ukrainians, Tatars, Germans, and Koreans lived in northeast, especially around the city of Karakol. Most of the Dungans and Ugyhurs are found along the Chinese border. Most of the Tajiks and Uzbeks live in the south. The emigration of non-Turkic people to Russia, Ukraine, and Germany is now negligible, in part because most of them left prior to 1999. For example, the number of Germans has fallen by over 90% between the 1989 and 2009 censuses.
The table shows the ethnic composition of Kyrgyzstan's population according to all population censuses between 1926 and 2009. There has been a sharp decline in the European ethnic groups (Russians, Ukrainians, Germans) and also Tatars since independence (as captured in the 1989, 1999 and 2009 censuses).
| Ethnic group |
census 1926[11] | census 1939[12] | census 1959[13] | census 1970[14] | census 1979[15] | census 1989[16] | census 1999[1] | census 2009[17] | census 2013[1] | census 2014[1] | ||||||||||
|---|---|---|---|---|---|---|---|---|---|---|---|---|---|---|---|---|---|---|---|---|
| Number | % | Number | % | Number | % | Number | % | Number | % | Number | % | Number | % | Number | % | Number | % | Number | % | |
| Kyrgyz | 661,171 | 66.6 | 754,323 | 51.7 | 836,831 | 40.5 | 1,284,773 | 43.8 | 1,687,382 | 47.9 | 2,229,663 | 52.4 | 3,128,147 | 64.9 | 3,804,788 | 71.0 | 4,099,433 | 72.3 | 4,193,850 | 72.6 |
| Uzbeks | 110,463 | 11.1 | 151,551 | 10.4 | 218,640 | 10.6 | 332,638 | 11.3 | 426,194 | 12.1 | 550,096 | 12.9 | 664,950 | 13.8 | 768,405 | 14.3 | 816,219 | 14.4 | 836,065 | 14.4 |
| Russians | 116,436 | 11.7 | 302,916 | 20.8 | 623,562 | 30.2 | 855,935 | 29.2 | 911,703 | 25.9 | 916,558 | 21.5 | 603,201 | 12.5 | 419,583 | 7.8 | 375,438 | 6.6 | 369,939 | 6.4 |
| Dungans | 6,004 | 0.6 | 5,921 | 0.4 | 11,088 | 0.5 | 19,837 | 0.7 | 26,661 | 0.8 | 36,928 | 0.9 | 51,766 | 1.1 | 58,409 | 1.1 | 62,966 | 1.1 | 64,565 | 1.1 |
| Uygurs | 7,540 | 0.8 | 9,412 | 0.6 | 13,757 | 0.7 | 24,872 | 0.8 | 29,817 | 0.8 | 36,779 | 0.9 | 46,944 | 1.0 | 48,543 | 0.9 | 51,389 | 0.9 | 52,456 | 0.9 |
| Tajiks | 2,667 | 0.3 | 10,670 | 0.7 | 15,221 | 0.7 | 21,927 | 0.7 | 23,209 | 0.7 | 33,518 | 0.8 | 42,636 | 0.9 | 46,105 | 0.9 | 49,046 | 0.8 | 50,174 | 0.8 |
| Turks | 44 | 0.0 | 33 | 0.0 | 542 | 0.0 | 3,076 | 0.1 | 5,160 | 0.1 | 21,294 | 0.5 | 33,327 | 0.7 | 39,133 | 0.7 | 40,443 | 0.7 | 40,953 | 0.7 |
| Kazakhs | 1,766 | 0.2 | 23,925 | 1.6 | 20,067 | 1.0 | 21,998 | 0.8 | 27,442 | 0.8 | 37,318 | 0.9 | 42,657 | 0.9 | 33,198 | 0.6 | 33,368 | 0.5 | 33,701 | 0.5 |
| Tatars | 4,902 | 0.5 | 20,017 | 1.4 | 56,209 | 2.7 | 68,827 | 2.3 | 71,744 | 2.0 | 70,068 | 1.6 | 45,438 | 0.9 | 31,424 | 0.6 | 28,334 | 0.5 | 28,059 | 0.4 |
| Ukrainians | 64,128 | 6.5 | 137,299 | 9.4 | 137,031 | 6.6 | 120,081 | 4.1 | 109,324 | 3.1 | 108,027 | 2.5 | 50,442 | 1.0 | 21,924 | 0.4 | 15,527 | 0.2 | 14,485 | 0.2 |
| Koreans | 9 | 0.0 | 508 | 0.0 | 3,622 | 0.2 | 9,404 | 0.3 | 14,481 | 0.4 | 18,355 | 0.4 | 19,784 | 0.4 | 17,299 | 0.3 | 16,753 | 0.2 | 16,807 | 0.2 |
| Azeris | 3,631 | 0.4 | 7,724 | 0.5 | 10,428 | 0.5 | 12,536 | 0.4 | 17,207 | 0.5 | 15,775 | 0.4 | 14,014 | 0.3 | 17,267 | 0.3 | 18,516 | 0.3 | 18,946 | 0.3 |
| Kurds | - | 1,490 | 0.1 | 4,783 | 0.2 | 7,974 | 0.3 | 9,544 | 0.3 | 14,262 | 0.3 | 11,620 | 0.2 | 13,171 | 0.3 | - | - | - | - | |
| Germans | 4,291 | 0.4 | 11,741 | 0.8 | 39,915 | 1.9 | 89,834 | 3.1 | 101,057 | 2.9 | 101,309 | 2.4 | 21,471 | 0.4 | 9,487 | 0.2 | 8,645 | 0.1 | 8,563 | 0.1 |
| Chechens | 1 | 0.0 | 7 | 0.0 | 25,208 | 1.2 | 3,391 | 0.1 | 2,654 | 0.1 | 2,873 | 0.1 | 2,612 | 0.1 | 1,875 | 0.0 | 1,737 | 0.0 | 1,719 | 0.0 |
| Belarusians | 333 | 0.0 | 1,520 | 0.1 | 4,613 | 0.2 | 6,868 | 0.2 | 7,676 | 0.2 | 9,187 | 0.2 | 3,208 | 0.1 | 1,394 | 0.0 | 1,070 | 0.0 | 1,029 | 0.0 |
| Jews | 318 | 0.0 | 1,895 | 0.1 | 8,607 | 0.4 | 7,677 | 0.3 | 6,836 | 0.2 | 6,005 | 0.1 | 1,571 | 0.0 | 604 | 0.0 | 501 | 0.0 | 491 | 0.0 |
| Others | 9,300 | 0.9 | 17,261 | 1.2 | 35,713 | 1.7 | 41,157 | 1.4 | 44,741 | 1.3 | 49,740 | 1.2 | 50,770 | 1.1 | 43,300 | 0.8 | 39,577 | 0.6 | 40,545 | 0.7 |
| Total | 993,004 | 1,458,213 | 2,065,837 | 2,932,805 | 3,522,832 | 4,257,755 | 4,822,938 | 5,362,793 | 5,663,133 | 5,776,570 | ||||||||||
CIA World Factbook demographic statistics
Data from CIA World Factbook unless otherwise indicated.[18]
Ethnic groups
- Kyrgyz 70.9%
- Uzbek 14.3%
- Russian 7.7%
- Dungan 1.1%
- Other 5.9% (includes Uyghur, Tajik, Turk, Kazakh, Tatar, Ukrainian, Korean, German) (2009 est.)
Languages
Religions
- Islam 75%
- Russian Orthodox 20%
- Other 5%.
Sex ratio
at birth:
1.05 male(s)/female
under 15 years:
1.04 male(s)/female
15–64 years:
0.96 male(s)/female
65 years and over:
0.64 male(s)/female
total population:
0.96 male(s)/fe
Infant mortality rate
Total 31.26 deaths/1,000 live births
Male 36.19 deaths/1,000 live births
Female 26.06 deaths/1,000 live births (2009 est.)
Life expectancy at birth
total population:
69.43 years
male:
65.43 years...
female:
73.64 years (2009 est.)
Nationality
noun:
Kyrgyzstani(s)
adjective:
Kyrgyzstani
Literacy
definition:
age 15 and over can read and write
total population:
98.7%
male:
99.3%
female:
98.1% (1999 census)
See also
References
- 1 2 3 4 5 6 5.01.00.03 Национальный состав населения 1999-2013 [Table 5.01.00.03 Ethnic composition of the population 1999-2013] (PDF) (in Russian). National Statistical Committee of the Kyrgyz Republic. Archived from the original (PDF) on 13 November 2013. Retrieved 14 April 2014.
- 1 2 3 4 Population census for Kyrgyzstan, 1999 (Russian)
- 1 2 Spoorenberg, Thomas (2013). "Fertility changes in Central Asia since 1980". Asian Population Studies. 9 (1): 50–77. doi:10.1080/17441730.2012.752238.
- 1 2 Spoorenberg, Thomas (2015). "Explaining recent fertility increase in Central Asia". Asian Population Studies. Routledge. doi:10.1080/17441730.2015.1027275.
- ↑ "Demographic Yearbook (DYB) Regular Issues 2000 - 2010". United Nations Statistical Division. 2001. Retrieved 31 January 2016.
- ↑ Население [Population]. National Statistical Committee of the Republic of Kyrgyzstan (in Russian). Retrieved 31 January 2016.
- ↑ Численность населения областей, районов, городов и поселков городского типа Кыргызской Республики в 2015г. [Population of Regions, Districts, cities and towns of the Kyrgyz Republic in 2015] (PDF) (in Russian). National Committee for Statistics of the Kyrgyz Republic. Retrieved 31 March 2015.
- ↑ ДЕМОГРАФИЧЕСКИЙ ЕЖЕГОДНИК КЫРГЫЗСКОЙ РЕСПУБЛИКИ 2009-2013 гг. [Demographic Annual of the Kyrgyz Republic for 2009-2013] (PDF) (in Russian). National Committee for Statistics of the Kyrgyz Republic. 2014. Retrieved 31 March 2015.
- ↑ Естественное движение населения республик СССР, 1935 [Natural population growth of the Republics of the USSR, 1935] (in Russian). Demoscope.ru. Retrieved 31 March 2015.
- 1 2 5.01.00.16 Справочные данные по населению [Table 5.01.00.16 Population reference data] (XLS). National Statistical Committee of the Republic of Kyrgyzstan (in Russian). 2015. Retrieved 31 January 2016."Table 5.01.00.05 Number of live births" (XLS). National Statistical Committee of the Republic of Kyrgyzstan. 2015. Retrieved 31 January 2016.
- ↑ Всесоюзная перепись населения 1926 года. Национальный состав населения по регионам РСФСР [All-Union census in 1926. National composition of the population by regions of the RSFSR]. Demoskop weekly (in Russian) (673 - 674). Retrieved 22 February 2016.
- ↑ Всесоюзная перепись населения 1939 года. Национальный состав населения по республикам СССР [All-Union census 1939. National composition of the population by republics of the USSR]. Demoskop Weekly (in Russian) (673 - 674). Retrieved 22 February 2016.
- ↑ Всесоюзная перепись населения 1959 года. Национальный состав населения по республикам СССР [All-Union census 1959. National composition of the population by republics of the USSR]. Demoskop Weekly (in Russian) (673 - 674). Retrieved 22 February 2016.
- ↑ Всесоюзная перепись населения 1970 года. Национальный состав населения по республикам СССР [All-Union census 1970. National composition of the population by republics of the USSR]. Demoskop Weekly (in Russian) (673 - 674). Retrieved 22 February 2016.
- ↑ Всесоюзная перепись населения 1979 года. Национальный состав населения по республикам СССР [All-Union census 1979. National composition of the population by republics of the USSR]. Demoskop Weekly (in Russian) (673 - 674). Retrieved 22 February 2016.
- ↑ Всесоюзная перепись населения 1989 года. Национальный состав населения по республикам СССР [All-Union census 1989. National composition of the population by republics of the USSR]. Demoskop Weekly (in Russian) (673 - 674). Retrieved 22 February 2016.
- ↑ 2009 - Национальный состав населения (на начало года) [2009 - Ethnic composition the population (at the beginning of the year)] (PDF). Bureau of Statistics of Kyrgyzstan (in Russian). 2011. Archived from the original (PDF) on 20 September 2011.
- ↑ "Central Asia :: KYRGYZSTAN". CIA The World Factbook.
| Ethnic groups |
| ||||||
|---|---|---|---|---|---|---|---|
| Religion | |||||||