Ethnic groups in Central America

| Part of a series on |
| Central America |
|---|
 |
|
Countries |
|
Culture |
|
Economy |
|
Education |
|
Politics and government |
|
Transportation |
|
Related topics |
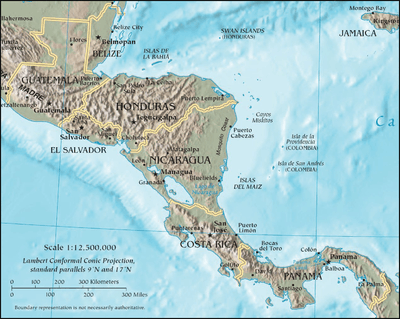
Central America is a region formed by 6 Latin American countries and one Anglo American nation, (Belize). As an isthmus it connects North America with South America, comprising the following countries (from north to south): Belize, Guatemala, Honduras, El Salvador, Nicaragua, Costa Rica and Panama.
The inhabitants of Central America represent a variety of ancestries, ethnic groups, and races, making the region one of a most diverse in the world. Some countries have a predominance of European-Amerindian, or Mestizo, population; some are dominated by inhabitants of European ancestry; and some countries' populations are primarily Mixed. Black, Asian, and Afro-Amerindian (historically sometimes called Zambo) minorities are also identified regularly. People with mestizo ancestry are the largest single group, and along with people of European or part-European ancestry, they combine to make up approximately 80% of the population,[1] or even more.[2]
Central America, has a population of approximately 40 million in 2007 in an area of 523,780 km², with a 77.3 density of hab/km² although its population is not distributed equally. For example, Belize is larger than El Salvador in area by 1,924 km², but El Salvador has 30 times the population of Belize. Similarly, the population of Costa Rica is greater than that of Panama, though Panama is larger. Guatemala has the largest population with 13,276,517; followed by Honduras at 7,792,854.
Population and density
| Country or territory with flag |
Area (km²) (per sq mi) |
Population (July 2012 est.) |
Population density per km² |
Capital |
|---|---|---|---|---|
| |
108,889 km2 (42,042 sq mi) | 14,099,032 | 116.8/km² (4,913.9/sq mi) | Guatemala City |
| |
22,966 km2 (8,867 sq mi) | 307,899 | 13/km² (546.9/sq mi) | Belmopan |
| |
21,040 km2 (8,120 sq mi) | 6,090,646 | 330.2/km² (13,891.9/sq mi) | San Salvador |
| |
112,090 km2 (43,280 sq mi) | 8,296,693 | 66.7/km² (2,806.1/sq mi) | Tegucigalpa |
| |
129,494 km2 (49,998 sq mi) | 5,727,707 | 43.8/km² (1,842.7/sq mi) | Managua |
| |
51,100 km2 (19,700 sq mi) | 4,636,348 | 70.8/km² (2,978.6/sq mi) | San José |
| |
78,200 km2 (30,200 sq mi) | 3,360,474 | 41.4/km² (1,741.7/sq mi) | Panama City |
| Total | 523,780 | 42,071,038 | 77.3/km² |
Mestizos
Central American Admixture began with the arrival of the Spaniards to Central America, whose consequences could still be perceived in the present-day Central American Society. Mestizos are the result of the admixture between Spaniards and two different ethnic groups: Native Americans (or Amerindians) and Africans (brought as slaves from Africa).
Mestizos are majority in El Salvador, Honduras, Nicaragua and Panama, formed by 22,425,257 inhabitants, occupying the majority of the Central American population. All the 7 countries have significant Mestizo populations.
| Country or territory with flag |
% Local | Population | % Regional | |
|---|---|---|---|---|
| |
41.4 | 5,866,251 | ||
| |
48.7 | 149,946 | ||
| |
86.0 | 5,481,158 | ||
| |
90.0 | 7,013,568 | ||
| |
69.0 | 3,001,503 | ||
| |
13.65 | 599,500 | ||
| |
70 | 2,353,331 | ||
| Total | 22,425,257 | 58.05 |
Caucasians
The white ethnic group, or White Latin Americans, have an estimated population of 7,494,000 inhabitants.
Costa Rica: As of 2012 most Costa Ricans are of primarily Spanish ancestry with minorities of German, Italian, French, Dutch, British, Swedish and Greek ancestry. Whites, castizos and mestizos together comprise 83% of the population.[3] Whites and castizos (mix of European and mestizo or mulatto) represent 65.8% of the total population).[4] European migrants used Costa Rica to get across the isthmus of Central America as well to reach the USA West Coast (California) in the late 19th century and until the 1910s (before the Panama Canal opened). Other European ethnic groups known to live in Costa Rica include Russians, Danes, Belgians, Portuguese, Croats, Hungarians, Armenians and Georgians.
Guatemala: 18% of Guatemalans are whites of European descent in their majority Spanish and German (and others descending from France, Italy, Belgium, England, Sweden, etc.).
Nicaragua: Also, in Nicaragua during the mid-19th century and early-20th century immigration was encouraged by the government giving land in areas of Esteli, Jinotega, Matagalpa, Managua-El Crucero, Carazo, Nueva Segovia and Madriz, mainly to German, French and Eastern European immigrants who were willing to work the land. There are also Syrians, Armenians, Palestinian, Jewish, and Lebanese communities in Nicaragua with a population of about 30,000.
Panama: Besides Costa Rica and Nicaragua, Around 15% of the Panamanian population is white, immigration to Panama are represented by ethnic groups in the 19th and 20th centuries: British and Irish, Dutch, French, Germans, Italians, Portuguese, Poles, Russians) and people from the United States.
El Salvador 12% of Salvadorans are mostly descendants of the Spaniard dynasty with others descending from French, Italians, Portuguese, British, Germans and some Central Europeans. El Salvador also has a sizable Arab population mostly Palestinians, Syrian, Lebanese, as well as Jewish.
Belize: In 2010 there were 13,964 White people living in Belize, forming 4,6% of the total population. 10,865 or 3,6% of them were Mennonites of German/Dutch descend.
Honduras: Less than 5% of the Honduran population is estimated to be white. These are people of mainly Spanish ancestry, although a few are descended from other European groups.
| Country or territory with flag |
% Local | Population | % Regional | |
|---|---|---|---|---|
| |
18 | 2,490,000 | ||
| |
4.6 | 13,964 | ||
| |
12 | 730,877 | ||
| |
1 | 78,000 | ||
| |
17 | 1,000,500 | ||
| |
65.8 | 2,830,400 | ||
| |
15 | 540,100 | ||
| Total | 7,507,964 | 20.18 |
Native Americans

The only plurality of Native American or Indigenous people located in Central America is in Guatemala. Native Americans are small minorities in the rest of Central American countries.
Guatemala
The Amerindian populations in Guatemala include the K'iche' 9.1%, Kaqchikel 8.4%, Mam 7.9% and Q'eqchi 6.3%. 8.6% of the population is "other Mayan," 0.4% is indigenous non-Mayan, making the indigenous community in Guatemala about 40.5% of the population.[5]
Belize
Roughly 10% of the population is Amerindian, mostly Maya. Three Maya groups now inhabit the country: The Yucatec (who came from Yucatán, Mexico to escape the Caste War of the 1840s), the Mopan (indigenous to Belize but were forced out by the British; they returned from Guatemala to evade slavery in the 19th century), and Kekchi (also fled from slavery in Guatemala in the 19th century).[6] The later groups are chiefly found in the Toledo District.
Panama
According to the 2010 census in Panama, approximately 12.3% of the nation's population are indigenous. The Amerindian population figure stood at 417,500 individuals in 2010.[7]
Honduras
About 7% of the Honduran population are members of one of the seven recognized indigenous groups.
Nicaragua
5% of Nicaraguans are Amerindians, the unmixed descendants of the country's indigenous inhabitants. Nicaragua's pre-Columbian population consisted of many indigenous groups. In the western region the Nicarao people, after whom the country is named, were present along with other groups related by culture and language to the Mayans. The Caribbean coast of Nicaragua was inhabited by indigenous peoples who were mostly chibcha related groups that had migrated from South America, primarily present day Colombia and Venezuela. These groups include the Miskitos, Ramas and Sumos. In the 19th century, there was a substantial indigenous minority, but this group was also largely assimilated culturally into the mestizo majority.
Costa Rica
There are over 104,000 Native American or indigenous inhabitants, representing 2.4% of the Costa Rican population. Most of them live in secluded reservations, distributed among eight ethnic groups: Quitirrisí (in the Central Valley), Matambú or Chorotega (Guanacaste), Maleku (northern Alajuela), Bribri (southern Atlantic), Cabécar (Cordillera de Talamanca), Guaymí (southern Costa Rica, along the Panamá border), Boruca (southern Costa Rica) and Térraba (southern Costa Rica).
El Salvador
Only 1% of the Salvadoran population is purely indigenous, mostly Mayan, Pipil, Lenca and Kakawira (Cacaopera). The current low numbers of indigenous people may be partly explained by mass murders during the 1932 Salvadoran peasant uprising (or La Matanza). Up to 30,000 peasants were killed in what by modern standards would be considered genocide because of the Salvadoran army's efforts to exterminate a certain racial group. Today many Pipil and other Indigenous populations live in small towns of El Salvador like Izalco, Panchimalco, Sacacoyo, and Nahuizalco.
| Country or territory with flag |
% Local | Population | % Regional | |
|---|---|---|---|---|
| |
40.5 | 5,376,989 | ||
| |
10.6 | 32,495 | ||
| |
1.0 | 60,906 | ||
| |
7.0 | 545,499 | ||
| |
5.0 | 294,559 | ||
| |
2.4 | 104,000 | ||
| |
6 | 417,500 | ||
| Total | 6,831,948 | 16.24 |
Afro Central Americans

The Creole, Afro-Caribbean, and Garifuna populations form the majority of the Afro-Latin Americans in Central America, of which the majority is concentrated on the Caribbean coasts of the region. It is important to note that all these groups are distinct, speaking English, English creoles, Garifuna, Miskito, and Spanish. The highest percentage is 31% in Belize, where Kriols and Garifuna were once the majority of the nation that has seen heavy emigration and immigration in the last 30 years.[8][9]
The largest population, however, is in Nicaragua of Creole, Afro-Caribbean, and to a lesser degree of Miskito and Garifuna descent, of which the majority is concentrated on the Caribbean coast in the area often referred to as the Mosquito Coast. In Costa Rica about 8% of the population is of Black African descent or Mulatto (mix of European and black) who are called Afro-Costa Ricans, English-speaking descendants of 19th century black Jamaican immigrant workers. In Panama people of African descent were already present when the construction of an inter-oceanic channel saw the large arrival of immigrant afro-Caribbeans. Honduras has a small population of creole people, but the overwhelming majority of blacks are Garifuna. Afro-Guatemalans are concentrated in the Caribbean department of Izabal and consist of a mix of Garifunas and other Afro-Caribbeans. Although El Salvador is the only Central American country with no official black percentage, El Salvador has had black African slavery in its past history during the colonial era, over time they mixed with both Amerindians and Europeans causing their offspring to join into the general Mestizo population.[10] But Afro-Salvadoran heritage commonly do exist.[11]
Kriols In Belize, Kriols make up roughly 21% of the Belizean population and about 75% of the Diaspora. They are descendants of the Baymen slave owners, and slaves brought to Belize for the purpose of the logging industry.[12] These slaves were mostly Black (many also of Miskito ancestry) from Nicaragua and born Africans who had spent very brief periods in Jamaica.[13] Bay Islanders and more Jamaicans came in the late 19th century, further adding these all ready varied peoples, creating this ethnic group.
For all intents and purposes, Kriol is an ethnic and linguistic denomination, but some natives, even those blonde and blue-eyed, may call themselves Kriols. It is defined as more a cultural attribute and not limited to physical appearance.[13]
| Country or territory with flag |
% Local | Population | % Regional | |
|---|---|---|---|---|
| |
2.0 | 276,489 | ||
| |
24.9 | 95,488 | ||
| |
2.0 | 155,857 | ||
| |
9.0 | 530,207 | ||
| |
8.0* | 333,727 | ||
| |
14.0 | 470,466 | ||
| Total | 1,862,234 | 4.43 |
*(includes mulattoes)
Asians

Panama: Chinese-Panamanian population today presents 4% or 135,000. Ethnic Chinese in Panama, also variously referred to as Chinese-Panamanian, Panamanian-Chinese, Panama Chinese, or in Spanish as Chino-Panameño, are Panamanian citizens and residents of Chinese origin or descent.[14][15][16]
Costa Rica: Today, Asians represent almost 1% of the Costa Rican population. the first Chinese people in Costa Rica migrants arrived in Costa Rica in 1855; they were a group of 77 originally from Guangzhou, who had come to Central America to work on the Panama Railway. Of them, 32 found work on the farm of José María Cañas, while the remaining 45 were hired by Alejandro Von Bulow, an agent sent by the Berlin Colonization Society to prepare suitable sites for German settlement in Costa Rica. During the 1859-1863 administration of José María Montealegre Fernández, laws were promulgated which prohibited the migration of blacks and Asians, in an effort to reserve Costa Rica for European settlers.[17]
Early Chinese migrants typically arrived by sea through the Pacific coast port of Puntarenas; a "Chinese colony" began to form in the area, founded by José Chen Apuy, a migrant from Zhongshan, Guangdong who arrived in 1873.[18] Puntarenas was so widely known among the Chinese community as a destination that some in China mistook it for the name of the whole country.[19]
In the 1970s, Taiwan began to become a major source of Chinese immigration to Costa Rica. However, they formed a transitory group, with many using Costa Rica as a stopover while they waited for permission to settle in the United States or Canada.[20] Those who settled permanently in Costa Rica included many pensioners enjoying their retirement abroad.[18]
Most Chinese immigrants since then have been Cantonese, but in the last decades of the 20th century, a number of immigrants have also come from Taiwan and Japan. Many men came alone to work and married Costa Rican women and speak Cantonese. However the majority of the descendants of the first Chinese immigrants no longer speak Cantonese and feel themselves to be Costa Ricans.[21]
Nicaragua: There are 12,000 Chinese Nicaraguans Chinese people first arrived in Nicaragua's Caribbean coast in the latter part of the 19th century, and most of them settled in cities such as Bluefields, El Bluff, Laguna de Perlas, and Puerto Cabezas.[22] The Chinese immigrants dominated the commerce of the main coastal towns on the Caribbean coast prior to 1879. Then in the late 19th century, they began migrating to the Pacific lowlands of the country.[23]
| Country or territory with flag |
% Local | Population | % Regional | |
|---|---|---|---|---|
| |
1.0 | 12,000 | ||
| |
1 | 9,170 | ||
| |
4 | 135,000 | ||
| Total | 156,170 | 0.37 |
Garifuna People & Others

Garifuna is an Arawakan language spoken in Honduras, Belize, Guatemala and Nicaragua by the Garifuna people. Their language is primarily derived from Arawak and Carib, with English, French and Spanish to a lesser degree. One interesting feature of Garifuna is a vocabulary split between terms used only by men and terms used only by women. This does not however affect the entire vocabulary but when it does, the terms used by men generally come from Carib and those used by women come from Arawak.
Almost all Garifuna are bilingual or polylingual, speaking the official languages of the countries they inhabit such as Spanish, Kriol and English most commonly as a first language. According to one genetic study their ancestry is on average is 76% Sub Saharan African, 20% Arawak/Carib and 4% European.[24]
| Country or territory with flag |
% Local | Population | % Regional | |
|---|---|---|---|---|
| |
2 | |||
| |
15.8 | |||
| |
0 | |||
| |
3 | |||
| |
0 | |||
| |
0 | |||
| |
0 | |||
| Total | 4,548,488 | 10.80 |
References
- ↑ "CIA — The World Factbook -- Field Listing — Ethnic groups". Retrieved 2008-02-20.
- ↑ Lizcano Fernández, Francisco (May–August 2005). "Composición Étnica de las Tres Áreas Culturales del Continente Americano al Comienzo del Siglo XXI" (PDF). Convergencia (in Spanish). Mexico: Universidad Autónoma del Estado de México, Centro de Investigación en Ciencias Sociales y Humanidades. 38: 185–232; table on p. 218. ISSN 1405-1435. Archived from the original (PDF) on September 20, 2008.
- ↑ Costa Rica. State.gov (2012-04-09). Retrieved on 2012-05-19.
- ↑ http://www.joshuaproject.net/countries.php?rog3=CS
- ↑ "Belize" (PDF). 2010 Belize Housing and Population Census. Statistical Institute of Belize. Archived from the original (PDF) on June 11, 2012. Retrieved 7 June 2012.
- ↑ Cho, Julian (1998). Maya Homeland. University of California Berkeley Geography Department and the Toledo Maya of Southern Belize. Retrieved 4 January 2007.
- ↑ "Corredor Transístmico Panamá -Colón". Retrieved August 5, 2010.
- ↑ "Mestizo location in Belize; Location". Retrieved 2008-02-14.
- ↑ "Diaspora of Belize" Council on Diplomacy, Washington, DC and Consulate General of Belize.
- ↑ http://www.bjmjr.net/afromestizo/el_salvador.htm
- ↑ Montgomery, Tommie Sue (1995). Revolution in El Salvador: from civil strife to civil peace. Boulder, Colo: Westview Press. ISBN 0-8133-0071-1.
- ↑ "Belize-Guatemala Territorial Issue – Chapter 1". Belizenet.com. Retrieved 29 August 2010.
- 1 2 Johnson, Melissa A. (2003). "The Making of Race and Place in Nineteenth-Century British Honduras". Environmental History. 8 (4): 598–617. doi:10.2307/3985885. JSTOR 3985885.
- ↑ Siu, Lok (Summer 2005), "Queen of the Chinese Colony: Gender, Nation, and Belonging in Diaspora", Anthropological Quarterly, 78 (3): 511–42, doi:10.1353/anq.2005.0041, retrieved 2007-11-07
- ↑ Vega Abad, Lina (2003-07-20), "De Salsipuedes al 'barrio chino'", La Prensa, Panamá (in Spanish), retrieved 2007-11-07
- ↑ "May Expel Panama Chinese; Those Who Refuse to Pay a Head Tax to be Deported To-morrow" (PDF), The New York Times, 1913-11-12, retrieved 2007-11-07
- ↑ Loría Chaves & Rodríguez Chaves 2001
- 1 2 Chen Apuy 1992, p. 3
- ↑ Chen Apuy 1992, p. 5
- ↑ Chen Apuy 1992, p. 2
- ↑ Book: Costa Rica: a global studies handbook, Author: Margaret Tyler Mitchell, Scott Pentzer
- ↑ Bolívar Juárez, Orient. "Bluefields, rostro de Nicaragua frente al Caribe". La Prensa (in Spanish). Retrieved 2007-03-26.
- ↑ Vásquez, Trinidad. "Fundación Cultural-Nicaragua-China promueven en rasgos de la mileria Cultura China". El Nuevo Diario (in Spanish). Retrieved 2007-03-26.
- ↑ Crawford, M.H. 1997 Biocultural adaptation to disease in the Caribbean: Case study of a migrant population. Journal of Caribbean Studies. Health and Disease in the Caribbean. 12(1): 141–155.
- "Central America". The Columbia Encyclopedia, 6th ed. 2001-6. New York: Columbia University Press.
- "Central America". Encyclopædia Britannica. 2006. Chicago: Encyclopædia Britannica, Inc.
- "Central America" (Archived" (Archived 2009-10-31). MSN Encarta Online Encyclopedia 2006.
- American Heritage Dictionaries, Central America.
- WordNet Princeton University: Central America
- "Central America". The Columbia Gazetteer of the World Online. 2006. New York: Columbia University Press.
- Chen Apuy, Hilda (December 1992), "La minoría china en Costa Rica" (PDF), Revista Reflexiones, 1 (5), ISSN 1659-2859, retrieved 2009-05-07