Demographics of Albania

This article is about the demographic features of the population of Albania, including population density, ethnicity, education level, health of the populace, economic status, religious affiliations and other aspects of the population.
Population
Historical
| Historical growth of Albania | ||
|---|---|---|
| Year | Pop. | ±% p.a. |
| 1600 | 200,000 | — |
| 1700 | 300,000 | +0.41% |
| 1923 | 823,000 | +0.45% |
| 1990 | 3,300,000 | +2.09% |
| 2001 | 3,023,000 | −0.79% |
| 2011 | 2,831,741 | −0.65% |
| Source: Maddison (2001) | ||
Population statistics for Albania start with the first census of 1923, when the country had 823,000 inhabitants. Previous censuses carried out by the Ottoman Empire are not yet available. A shift in administrative borders in 1913 makes comparison of various periods more complicated. Maddison (2001) estimates that in the current territory of Albania, about 200,000 people lived up to the year 1600, and that the population grew to 300,000 by 1700, implying an annual average growth rate of 0.4% in that period.
Population growth accelerated from the country's Declaration of Independence in 1913 to 1944 to 0.7% per year. This was due in part because Albania had the largest birth rate and the smallest death rate in Europe at the time.[1] After World War II, population increase policies pursued by the communist government and a large life expectancy fueled a 2.5% annual increase for the following 45 years. Population growth strained economic resources during communism in a Malthusian fashion that led to the collapse of the regime and the emigration of about 20-25% of the population in the following two decades. Albania experienced a demographic transition starting from 1960s, when crude birth rates began a slow decline, despite a government policy that called for a population increase. After the 1990s, the population showed an average decline of about 0.3% per year, caused by emigration. In the 2001 census, the population declined to 3,023,000 from almost 3.3 million in 1990. The next census was scheduled for April 2011, and the results will be published in the following months. However, various minority groups find this proccedure that has been followed unacceptable since according to article 20 of the Census law, there is a $1,000 fine for someone who will declare anything other than what was written down on his birth certificate.[2]
Census results

| Census date | total population | change (%) | males | females | population density/km2 | urban population |
|---|---|---|---|---|---|---|
| 1918 | ||||||
| 15 XI 1923 | 803,959 | |||||
| 25 V 1930 | 1,003,097 | |||||
| 31 XII 1940 | 1,084,159 | +8.1 | ||||
| 30 IX 1945 | 1,122,044 | +3.5% | 570,361 | 551,683 | 39 | |
| 3 IX 1950 | 1,218,943 | +8.6% | 625,935 | 593,008 | 42 | 20.5% |
| 2 X 1955 | 1,391,499 | +14.1% | 713,316 | 678,183 | 48 | 27.5% |
| 2 X 1960 | 1,626,315 | +16.9% | 835,294 | 791,021 | 57 | 30.9% |
| 1 IV 1969 | 2,068,200 | +27.2% | 72 | 31.5% | ||
| 7 I 1979 | 2,590,600 | +25.3% | 1,337,400 | 1,253,200 | 90 | 33.5% |
| 12 IV 1989 | 3,182,417 | +22.9% | 1,638,100 | 1,544,300 | 111 | 35.5% |
| 1 IV 2001 | 3,069,275 | -3.6% | 1,530,443 | 1,538,832 | 107 | 42.1% |
| 1 X 2011(p) | 2,831,741 | -7.7% | 1,421,810 | 1,409,931 | 99 | 53.7% |
p =provisional figure
Results of the 2001 census[5]
Number of households
- 726,895
Registered Voters
According to CEC,[6] in 2013 elections Registered voters are 3,271,885.
Age structure
- Under 6 years: 10.8%
- 65 years and older: 7.5%
Sex ratio
- Males: 49.9% of total population
- Females: 50.1% of total population
Education
Percent of population aged 6 and older (2,737,614)
- Uncompleted primary: 14.8%
- Primary: 18.6%
- Junior secondary: 38.4%
- Senior secondary: 21.7%
- Higher education: 2.9%
- Illiterate: 3.6%
2011 census
Based on the preliminary 2011 Census results, the total population of Albania is 2,831,741.[7] The comparison of the figures shows that the population of Albania has decreased by 7.7% in about ten years. Large scale emigration and fertility decline are supposed to be the main causes of the observed population decrease. A preliminary estimate of the number of persons that refused to participate in the census is 29,355 (1.04%). This figure is based on the number of dwellings for which a refusal was recorded and is included in the total population. The total population is composed of 1,421,810 males (50.2%) and 1,409,931 females (49.8%). For the first time in the history of population censuses in Albania, the population in urban areas is larger than the population of rural areas. According to 2011 census preliminary results, 53.7% of the population lives in urban areas and 46.3% in rural areas.
The census is regarded as unreliable and inaccurate by the Council of Europe, showing incompatibility with the protection of national minorities.[8] Also, the World Council of Churches sent letters to the United Nations Human Rights Council regarding the matter, having conducted their own questionnaire which showed major irregularities.[9] The 2011 census, the first to include ethnicity, was struck by controversy since according to article 20 of the Census law, there is a $1,000 fine for anyone who declare anything other than what was written down on the individual's birth certificate.[10]
 Ethnicity
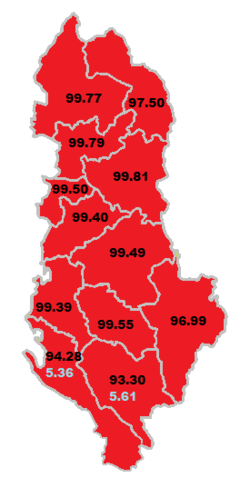 Language
 Religion
Mother tongue
| Mother tongue | Population | % |
|---|---|---|
| Albanian | 2,765,610 | 98.8 |
| Greek | 15,196 | 0.5 |
| Macedonian | 4,443 | 0.16 |
| Romani | 4,025 | 0.14 |
| Aromanian | 3,848 | 0.13 |
| Turkish | 714 | 0.03 |
| Italian | 523 | 0.02 |
| Other | 1,936 | 0.07 |
| Not relevant/not stated | 3,843 | 0,13 |
Religious affiliation
In the 2011 census the declared religious affiliation of the population was: 56.7% Muslims, 13.79% undeclared, 10.03% Catholics, 6.75% Orthodox believers, 5.49% other, 2.5% Atheists, 2.09% Bektashis and 0.14% other Christians.[11]
| Religion | Population | % |
|---|---|---|
| Muslims Sunni Muslims Bektashi | 1,646,236 1,587,608 58,628 | 58.79 56.70 2.09 |
| Christians Catholics Orthodox Protestants Other Christians | 475,629 280,921 188,992 3,797 1,919 | 16.99 10.03 6.75 0.14 0.07 |
| Atheists | 69,995 | 2.50 |
| Prefer not to answer | 386,024 | 13.79 |
| Believers without denomination | 153,630 | 5.49 |
| Not relevant/not stated | 68,022 | 2.43 |
Ethnic groups
Red - Albanian majority
Green - Greek majority
Yellow - Macedonian majority
Albania recognizes three national minorities, Greeks, Macedonians and Montenegrins, and two cultural minorities, Aromanians and Romani people.[12] As conducting a satisfactory census of ethnic minorities is one of the country's commitments to the European Union, the Albanian government conducted an official census to clarify the ethnic composition of the population in 2011.[13] The last census to include data on ethnic minorities was conducted in 1989. The census conducted in 2001 did not collect information about ethnic groups and nationalities in the population.[14]
| Ethnic group |
census 1945 | census 1950 | census 1955 | census 1960 | census 1979 | census 1989[15] | census 20111 | |||||||
|---|---|---|---|---|---|---|---|---|---|---|---|---|---|---|
| Number | % | Number | % | Number | % | Number | % | Number | % | Number | % | Number | % | |
| Albanians | 1,075,500 | 95.9 | 1,186,100 | 97.3 | 1,349,100 | 97.0 | 1,581745 | 97.3 | 2,535,913 | 97.9 | 3,117,601 | 98.0 | 2,312,356 | 82.58 |
| Greeks | 26,535 | 2.4 | 29,000 | 2.4 | 35,345 | 2.5 | 40,000 | 2.5 | 49,307 | 1.9 | 58,758 | 1.8 | 24,243 | 0.87 |
| Romani | - | - | - | - | - | - | - | - | - | - | - | - | 8,301 | 0.30 |
| Aromanians | - | - | - | - | - | - | - | - | - | - | - | - | 8,266 | 0.30 |
| Macedonians | 14,400 | 1.3 | 2,273 | 0.2 | 3,341 | 0.2 | 4,235 | 0.3 | 4,097 | 0.2 | 4,697 | 0.15 | 5,512 | 0.20 |
| Balkan Egyptians | - | - | - | - | - | - | - | - | - | - | - | - | 3,368 | 0.12 |
| Serbs–Montenegrins | - | - | 1,570 | 0.1 | 3,713 | 0.3 | 300 | 0.0 | 1,283 | 0.0 | 100 | 0.00 | 366 | 0.01 |
| Other | - | - | - | - | - | - | - | - | 5,600 | 0.5 | 1,261 | 0.04 | 2,644 | 0.11 |
| 1 At the 2011 census a total of 390,938 (14% of the total population) did not declare their nationality, while another 44,144 (1.6%) considered the nationality as 'not relevant'. The census is regarded unreliable and inaccurate by the Council of Europe. | ||||||||||||||
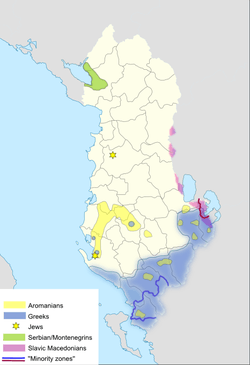
Vlachs (Aromanians) live in the south of the country,[16] whereas Montenegrins live in the north.[17] Macedonians mostly live in Mala Prespa and the regions along the Macedonian border, known as 'Golo Brdo' and 'Gora'.
Vital statistics
| [3][4][18] | Average population (x 1000) | Live births | Deaths | Natural change | Crude birth rate (per 1000) | Crude death rate (per 1000) | Natural change (per 1000) | Fertility rates | Infant mortality rate (per 1000 live births) |
|---|---|---|---|---|---|---|---|---|---|
| 1934 | 1 010 | 33 884 | 14 440 | 19 444 | 34.7 | 16.7 | 18.0 | ||
| 1935 | 1 012 | 32 640 | 13 373 | 19 267 | 33.1 | 17.0 | 16.1 | ||
| 1936 | 1 014 | 34 199 | 16 788 | 17 411 | 33.7 | 16.6 | 17.1 | ||
| 1937 | 1 030 | 34 829 | 20 036 | 14 793 | 33.8 | 19.5 | 14.3 | ||
| 1938 | 1 048 | 36 138 | 18 512 | 17 626 | 34.3 | 17.7 | 16.6 | ||
| 1939 | 1 070 | 29 597 | 16 013 | 13 584 | 27.9 | 15.0 | 12.9 | ||
| 1940 | 1 088 | 33 651 | 17 812 | 15 839 | 31.3 | 16.4 | 14.9 | ||
| 1941 | 1 100 | 30 627 | 18 234 | 12 393 | 28.0 | 16.6 | 11.4 | ||
| 1942 | 1 117 | 36 683 | 15 899 | 20 784 | 32.8 | 14.2 | 18.6 | ||
| 1948 | 1 164 | 42 141 | 18 883 | 23 258 | 36.2 | 16.2 | 20.0 | ||
| 1949 | 1 183 | 46 196 | 14 970 | 31 226 | 39.0 | 12.7 | 26.4 | ||
| 1950 | 1 215 | 47 291 | 17 215 | 30 076 | 38.9 | 14.2 | 24.8 | ||
| 1951 | 1 242 | 47 813 | 18 862 | 28 951 | 38.5 | 15.2 | 23.3 | ||
| 1952 | 1 270 | 44 727 | 19 826 | 24 901 | 35.2 | 15.6 | 19.6 | ||
| 1953 | 1 302 | 53 273 | 17 822 | 35 451 | 40.9 | 13.7 | 27.2 | ||
| 1954 | 1 340 | 54 635 | 17 560 | 37 075 | 40.8 | 13.1 | 27.7 | ||
| 1955 | 1 379 | 61 300 | 20 750 | 40 550 | 44.5 | 15.0 | 29.4 | ||
| 1956 | 1 421 | 59 565 | 16 370 | 43 195 | 41.9 | 11.5 | 30.4 | ||
| 1957 | 1 462 | 57 241 | 17 241 | 40 000 | 39.2 | 11.8 | 27.4 | ||
| 1958 | 1 507 | 63 007 | 14 059 | 48 948 | 41.8 | 9.3 | 32.5 | ||
| 1959 | 1 556 | 65 213 | 15 305 | 49 908 | 41.9 | 9.8 | 32.1 | ||
| 1960 | 1 607 | 69 686 | 16 775 | 52 911 | 43.4 | 10.4 | 32.9 | 6.57 | |
| 1961 | 1 660 | 68 452 | 15 445 | 53 007 | 41.2 | 9.3 | 31.9 | 6.21 | |
| 1962 | 1 711 | 67 209 | 18 363 | 48 846 | 39.3 | 10.7 | 28.5 | 5.93 | |
| 1963 | 1 763 | 68 967 | 17 646 | 51 321 | 39.1 | 10.0 | 29.1 | 5.88 | |
| 1964 | 1 814 | 68 599 | 15 811 | 52 788 | 37.8 | 8.7 | 29.1 | 5.66 | |
| 1965 | 1 864 | 65 692 | 16 731 | 48 961 | 35.2 | 9.0 | 26.3 | 5.28 | |
| 1966 | 1 914 | 65 127 | 16 469 | 48 658 | 34.0 | 8.6 | 25.4 | 5.06 | |
| 1967 | 1 965 | 69 261 | 16 565 | 52 696 | 35.2 | 8.4 | 26.8 | 5.23 | |
| 1968 | 2 019 | 71 869 | 16 214 | 55 655 | 35.6 | 8.0 | 27.6 | 5.26 | |
| 1969 | 2 080 | 73 458 | 15 624 | 57 834 | 35.3 | 7.5 | 27.8 | 5.56 | |
| 1970 | 2 136 | 69 507 | 19 774 | 49 733 | 32.5 | 9.3 | 23.3 | 5.12 | |
| 1971 | 2 188 | 72 784 | 17 768 | 55 016 | 33.3 | 8.1 | 25.1 | 5.21 | |
| 1972 | 2 239 | 73 607 | 17 616 | 55 991 | 33.3 | 7.9 | 25.4 | 5.22 | |
| 1973 | 2 292 | 69 754 | 18 032 | 51 722 | 30.4 | 7.9 | 22.5 | 4.81 | |
| 1974 | 2 346 | 71 862 | 17 726 | 54 136 | 30.2 | 7.6 | 22.6 | 4.77 | |
| 1975 | 2 401 | 70 688 | 17 399 | 53 289 | 29.6 | 7.3 | 22.3 | 4.66 | |
| 1976 | 2 454 | 70 510 | 17 029 | 53 481 | 29.0 | 6.9 | 22.1 | 4.45 | |
| 1977 | 2 508 | 73 439 | 16 638 | 56 801 | 28.4 | 6.6 | 21.8 | 4.19 | |
| 1978 | 2 563 | 70 594 | 16 219 | 54 375 | 27.5 | 6.3 | 21.2 | 3.81 | |
| 1979 | 2 617 | 72 055 | 17 421 | 54 634 | 27.5 | 6.7 | 20.9 | 3.86 | |
| 1980 | 2 671 | 70 680 | 16 981 | 53 699 | 26.5 | 6.4 | 20.1 | 3.62 | |
| 1981 | 2 724 | 72 180 | 18 001 | 54 179 | 26.5 | 6.6 | 19.9 | 3.44 | |
| 1982 | 2 780 | 77 232 | 16 521 | 60 711 | 27.8 | 5.9 | 21.8 | 3.56 | |
| 1983 | 2 838 | 73 762 | 17 416 | 56 346 | 26.0 | 6.1 | 19.9 | 3.25 | |
| 1984 | 2 897 | 79 177 | 16 618 | 62 559 | 27.3 | 5.7 | 21.6 | 3.38 | |
| 1985 | 2 957 | 77 535 | 17 179 | 60 356 | 26.2 | 5.8 | 20.4 | 3.26 | |
| 1986 | 3 016 | 76 435 | 17 369 | 59 066 | 25.3 | 5.8 | 19.6 | 3.11 | |
| 1987 | 3 076 | 79 696 | 17 119 | 62 577 | 25.9 | 5.6 | 20.3 | 3.16 | |
| 1988 | 3 138 | 80 241 | 17 027 | 63 214 | 25.6 | 5.4 | 20.1 | 3.03 | |
| 1989 | 3 199 | 78 862 | 18 168 | 60 694 | 24.7 | 5.7 | 19.0 | 2.96 | |
| 1990 | 3 245 | 82 125 | 18 193 | 63 932 | 25.2 | 5.6 | 19.6 | 3.03 | |
| 1991 | 3 225 | 77 361 | 17 743 | 59 618 | 24.0 | 5.5 | 18.5 | 3.00 | |
| 1992 | 3 179 | 75 425 | 18 026 | 57 399 | 23.7 | 5.7 | 18.1 | 2.80 | |
| 1993 | 3 208 | 67 730 | 17 920 | 49 810 | 21.1 | 5.6 | 15.5 | 2.57 | |
| 1994 | 3 035 | 72 179 | 18 342 | 53 837 | 23.8 | 6.0 | 17.7 | 2.74 | |
| 1995 | 3 030 | 72 081 | 18 060 | 54 021 | 23.8 | 6.0 | 17.8 | 2.62 | |
| 1996 | 3 076 | 68 354 | 17 600 | 50 754 | 22.2 | 5.7 | 16.5 | 2.63270 | |
| 1997 | 3 075 | 61 739 | 18 237 | 43 502 | 20.1 | 5.9 | 14.1 | 2.42596 | |
| 1998 | 3 055 | 60 139 | 18 250 | 41 889 | 19.7 | 6.0 | 13.7 | 2.43173 | |
| 1999 | 3 054 | 57 948 | 16 720 | 41 228 | 19.0 | 5.5 | 13.5 | 2.40130 | |
| 2000 | 3 061 | 50 077 | 16 421 | 33 656 | 16.4 | 5.4 | 11.0 | 2.15756 | |
| 2001 | 3 064 | 53 205 | 19 013 | 34 192 | 17.4 | 6.2 | 11.2 | 2.30618 | |
| 2002 | 3 052 | 42 527 | 19 187 | 23 340 | 13.9 | 6.3 | 7.6 | 1.90352 | |
| 2003 | 3 040 | 45 313 | 21 294 | 24 019 | 14.9 | 7.0 | 7.9 | 2.05831 | |
| 2004 | 3 027 | 40 989 | 20 269 | 20 720 | 13.5 | 6.7 | 6.8 | 1.86171 | |
| 2005 | 3 011 | 38 898 | 20 430 | 18 468 | 12.9 | 6.8 | 6.1 | 1.78777 | |
| 2006 | 2 993 | 35 891 | 20 852 | 15 039 | 12.0 | 7.0 | 5.0 | 1.67205 | |
| 2007 | 2 970 | 34 448 | 20 886 | 13 562 | 11.6 | 7.0 | 4.6 | 1.61709 | |
| 2008 | 2 947 | 33 445 | 20 749 | 12 696 | 11.3 | 7.0 | 4.3 | 1.58257 | |
| 2009 | 2 928 | 34 114 | 20 428 | 13 686 | 11.7 | 7.0 | 4.7 | 1.62753 | |
| 2010 | 2 913 | 34 061 | 20 107 | 13 954 | 11.7 | 6.9 | 4.8 | 1.63119 | |
| 2011 | 2 905 | 34 285 | 20 012 | 14 273 | 11.8 | 6.9 | 4.9 | 1.65221 | |
| 2012[19] | 2 900 | 35 473 | 20 849 | 14 446 | 12.2 | 7.2 | 5.0 | 1.71952 | |
| 2013[20] | 2 897 | 35 750 | 20 442 | 15 308 | 12.3 | 7.1 | 5.3 | 1.80740 | |
| 2014 p | 2 893 | 35 760 | 20 656 | 15 104 | 12.3 | 7.1 | 5.3 | 1.78355 | |
| 2015[21] | 2 889 | 33 221 | 22 422 | 10 799 | 11.5 | 7.8 | 3.7 | 1.69 | |
Fertility Rate (The Demographic Health Survey) [22]
Fertility Rate (TFR) (Wanted Fertility Rate) and CBR (Crude Birth Rate):
| Year | CBR (Total) | TFR (Total) | CBR (Urban) | TFR (Urban) | CBR (Rural) | TFR (Rural) |
|---|---|---|---|---|---|---|
| 2008-2009 | 10,0 | 1,6 (1,4) | 8,4 | 1,3 (1,2) | 11,3 | 1,8 (1,5) |
CIA World Factbook demographic statistics
The following demographic statistics are from the CIA World Factbook, unless otherwise indicated.
Population
- 3,029,278 (July 2015 est.)
Age structure
- 0-14 years: 18.78% (male 300,661/female 268,369)
- 15-24 years: 18.67% (male 291,479/female 274,019)
- 25-54 years: 40.39% (male 582,207/female 641,361)
- 55-64 years: 10.85% (male 163,003/female 165,805)
- 65 years and over: 11.3% (male 160,913/female 181,461) (2015 est.)
Median age
- total: 32 years
- male: 30.8 years
- female: 33.3 years (2015 est.)
Population growth rate
- 0.3% (2015 est.)
Birth rate
- 12.92 births/1,000 population (2015 est.)
Death rate
- 6.58 deaths/1,000 population (2015 est.)
Net migration rate
- -3.3 migrant(s)/1,000 population (2015 est.)
Urbanization
- urban population: 57.4% of total population (2015)
- rate of urbanization: 2.21% annual rate of change (2010-15 est.)
Life expectancy at birth
- total population: 78.13 years
- male: 75.49 years
- female: 81.04 years (2015 est.)
Total fertility rate
- 1.5 children born/woman (2015 est.)
Literacy
- definition: age 15 and over can read and write
- total population: 97.6%
- male: 98.4%
- female: 96.9% (2015 est.)
See also
References
 This article incorporates public domain material from the CIA World Factbook document "2006 edition".
- This article incorporates public domain material from the Library of Congress Country Studies website http://lcweb2.loc.gov/frd/cs/.
- ↑ Britannica Online
- ↑ "Macedonians and Greeks Join Forces against Albanian Census". balkanchronicle. Retrieved 24 September 2011.
- 1 2 B.R. Mitchell. European historical statistics, 1750-1975.
- 1 2 UN Demographic Yearbooks
- ↑ Albania: 2001 population census, official web site. Retrieved on 19 June 2009
- ↑ CEC: Central Election Commission website
- ↑ http://census.al/Resources/Data/Census2011/Instat_print%20.pdf
- ↑ "Third Opinion on Albania adopted on 23 November 2011" (PDF). Council of Europe. 4 June 2012.
- ↑ "Letter of concern at the Albania Census 2011" (PDF). World Council of Churches. 6 May 2013.
- ↑ "Macedonians and Greeks Join Forces against Albanian Census". balkanchronicle. Retrieved 24 September 2011.
- ↑ Albanian census 2011
- ↑ World Directory of Minorities and Indigenous Peoples - Albania : Overview
- ↑
- ↑ Individual questionnaire used in the 2001 population census in Albania. Retrieved on 19 June 2009
- ↑ http://pop-stat.mashke.org/albania-ethnic1989.htm
- ↑ Farsarotul.org
- ↑ The Albanian Census of 1918
- ↑ Institute of Statistics of Albania
- ↑ http://www.instat.gov.al/media/195035/statistika_4_2012_.pdf
- ↑ http://www.instat.gov.al/media/257796/femra_dhe_meshkuj_2014_.pdf
- ↑
- ↑ http://www.dhsprogram.com/
External links

Wikimedia Commons has media related to Demographics of Albania. - Institute of Statistics of Albania (INSTAT)
- Population cartogram of Albania