Energy in Australia
Energy in Australia includes energy and electricity production, consumption and export in Australia. Energy policy of Australia describes the politics of Australia as it relates to energy.
Australia is a net energy exporter, and was the fourth-highest coal producer in the world in 2009.
Historically–and until recent times–energy in Australia was sourced largely from coal and natural gas,[1] however due to the increasing effects of global warming and human-induced climate change on the global environment, there has been a greater shift towards renewable energy such as solar power and wind power both in Australia and abroad.[2][3] This in turn has led to a decrease in the demand of coal worldwide.[4]
Overview
| Energy in Australia[5] | ||||||
|---|---|---|---|---|---|---|
| Capita | Prim. energy | Production | Export | Electricity | CO2-emission | |
| Million | TWh | TWh | TWh | TWh | Mt | |
| 2004 | 20.2 | 1,347 | 3,044 | 1,672 | 224.9 | 354.4 |
| 2007 | 21.1 | 1,443 | 3,364 | 1,818 | 237.1 | 396.3 |
| 2008 | 21.5 | 1,513 | 3,514 | 1,942 | 240.4 | 397.5 |
| 2009 | 22.1 | 1,524 | 3,613 | 2,012 | 244 | 395 |
| 2010 | 22.5 | 1,451 | 3,613 | 2,159 | 227.0 | 383.5 |
| 2012 | 22.8 | 1,429 | 3,451 | 2,089 | 239.3 | 396.8 |
| 2012R | 23.1 | 1,492 | 3,691 | 2,172 | 236.3 | 386.3 |
| 2013 | 23.3 | 1,502 | 4,000 | 2,439 | 234.3 | 389.7 |
| Change 2004-10 | 11.6% | 7.7% | 18.7% | 29.1% | 0.9% | 8.2% |
| Mtoe = 11.63 TWh, Prim. energy includes energy losses.
2012R = CO2 calculation criteria changed, numbers updated | ||||||
Fuels
Fossil fuels
Coal
According to the International Energy Agency (IEA), global coal production increased 23 percent from 2005 to 2010 and 4.7 percent from 2009 to 2010. In Australia, coal production increased 12.9 percent between 2005 and 2010 and 5.3 percent between 2009 and 2010.[6] Australia was the fourth-highest coal producer in the world in 2009, producing 335 megatonnes (Mt) of anthracite and 64 Mt of lignite.[7]
Australia was the world's top anthracite exporter in 2009, exporting 31 percent of global exports (262 Mt, out of 836 Mt total). Seventy-eight percent of its 2009 anthracite production was exported. In this respect, Australia is an exception to most anthracite exporters. Australia's global anthracite export share was 14 percent of all production (836 of 5,990 Mt).[8]
Newcastle, New South Wales, is the world’s largest coal-exporting port. The Hunter Valley region in New South Wales (NSW) is the chief coal region. Most coal mining in Australia is opencast.
Oil
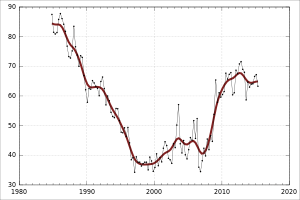
Australia's oil production peaked in 2000, after gradually increasing since 1980.[9] Net oil imports rose from seven percent of total consumption in 2000 to 39 percent in 2006. Decreasing domestic oil production is the result of the decline of oil-producing basins and few new fields going online.[9]
Natural gas

Australia's natural-gas reserves are an estimated 3,921 billion cubic meters (bcm), of which 20 percent are considered commercially proven (783 bcm). The gas basins with the largest recoverable reserves are the Carnarvon and Browse basins in Western Australia; the Bonaparte basin in the Northern Territory; the Gippsland and Otway basins in Victoria and the Cooper-Eromanga basin in South Australia and Queensland. In 2003–2004 Australia produced 33.2 bcm of natural gas, of which 62 percent was produced in Western Australia. The majority of Western Australian gas is sourced from the North West Shelf. Australia also produces LNG; LNG exports in 2004 were 7.9 Mt (10.7 bcm), six percent of world LNG trade.[10] Australia also has large deposits of coal seam methane (CSM), most of which are located in the anthracite deposits of Queensland and New South Wales.[10]
On 19 August 2009, Chinese petroleum company PetroChina signed an A$50 billion deal with American multinational petroleum company ExxonMobil to purchase liquefied natural gas from the Gorgon field in Western Australia,[11][12] the largest contract signed to date between China and Australia. It ensures China a steady supply of LPG fuel for 20 years, forming China's largest supply of relatively clean energy.[13][14] The agreement was reached despite relations between Australia and China being at their lowest point in years after the Rio Tinto espionage case and the granting of an Australian visa to Rebiya Kadeer.[15]
Oil shale
Australia's oil shale resources are estimated at about 58 billion barrels, or 4,531 million tonnes of shale oil. The deposits are located in the eastern and southern states, with the greatest feasibility in the eastern Queensland deposits. Between 1862 and 1952, Australia mined four million tonnes of oil shale. The mining stopped when government support ceased. Since the 1970s, oil companies have been exploring possible reserves. From 2000 to 2004, the Stuart Oil Shale Project near Gladstone, Queensland produced over 1.5 million barrels of oil. The facility, in operable condition, is on care and maintenance and its operator (Queensland Energy Resources) is conducting research and design studies for the next phase of its oil-shale operations.[16] A campaign by environmentalists opposed to the exploitation of oil-shale reserves may also have been a factor in its closure.[17]
Renewable energy
Renewable energy has potential in Australia, and the Climate Change Authority is reviewing the 20-percent Renewable Energy Target (RET). The production of 50 megawatts of wind power (power for nearly 21,000 homes annually) creates about 50 construction jobs and five staff positions.[18][19]
Supply and potential savings
Possible future electricity oversupply
TRUEnergy (now Energy Australia) said in 2011 that electricity producers in Australia are not building gas-fired power stations,[20] while the four major banks are unwilling to make loans for coal-fired power stations.[21] Additionally, with increasing energy efficiency and continual investment in renewable energy, Australia is trending towards an oversupply of energy.[22]
Energy efficiency
According to TRUenergy (now EnergyAustralia) lower energy use could save AU$25 billion (£16 billion), or $840 per electric customer.[23]
Climate change
Australian total emissions in 2007 were 396 million tonnes of CO2. That year, the country was among the top polluter nations of the world per capita. Australian per-capita emissions of carbon dioxide in 2007 were 18.8 tons of CO2, compared to the EU average of 7.9 tons. The change in emissions from 1990 to 2007 was +52.5 percent, compared to the EU's -3.3 percent.[24]
In March 2009 British economist Nicholas Stern warned governments at an international climate meeting of the high cost of climate change, saying that policy-makers needed to consider the probable impact of temperature increases of six degrees Celsius or more. The target of limiting temperature rise to two degrees Celsius above pre-industrial levels is no longer realistic, because global emissions have grown faster than expected. An increase of more than five degrees Celsius (nine degrees Fahrenheit) is "likely to lead to major disruption and large-scale movement of population", and its effects would be "catastrophic" and "far outside human experience".[25] The per-capita carbon footprint in Australia was rated 12th in the world by PNAS in 2011.[26]
See also
References
- ↑ "Australia Country Analysis Brief". 2002. Archived from the original on 2 April 2016. Retrieved 19 October 2016.
- ↑ "New Zealand says goodbye to coal power". antinuclear.net. Retrieved 26 November 2015.
- ↑ "China starts moving away from coal based energy". Spokesman.com. 13 September 2013. Retrieved 26 November 2015.
- ↑ Diessendorf, Mark (5 July 2015). "Say goodbye to coal power in Australia". The Age. Retrieved 26 November 2015.
- ↑ IEA Key World Energy Statistics Statistics 2015, 2014 (2012R as in November 2015 + 2012 as in March 2014 is comparable to previous years statistical calculation criteria, 2013, 2012, 2011, 2010, 2009, 2006 IEA October, crude oil p.11, coal p. 13 gas p. 15
- ↑ IEA Key World Energy Statistics 2011 October 2011
- ↑ IEA Key energy statistics 2010 Pages: 15
- ↑ IEA Key energy statistics 2010 Pages:15
- 1 2 Australia: Energy profile 26 June 2007, Energy Publisher accessdate 3 July 2011
- 1 2 OECD/IEA, p. 131-137
- ↑ Stephen McDonell, 19 August 2009, Record gas deal between China and Australia – AM – Australian Broadcasting Corporation
- ↑ Babs McHugh, 19 August 2009, Massive sale from Gorgon Gas Project – Australian Broadcasting Corporation
- ↑ David McLennan, 20 August 2009, Australia to be 'global supplier of clean energy' – The Canberra Times
- ↑ 20 August 2009, CNPC to import 2.25m tons of LNG annually from Australia – ChinaDaily (Source: Xinhua)
- ↑ Peter Ryan, 19 August 2009, Deal means 2.2 million tonnes exported per year – AM – Australian Broadcasting Corporation
- ↑ Shale oil. AIMR Report 2006 Geoscience Australia, accessdate=30 May 2007 archivedate 13 February 2007
- ↑ Climate-changing shale oil industry stopped Greenpeace Australia Pacific, 3 March 2005, accessdate 28 June 2007
- ↑ scheme (2012).Energy Council
- ↑ Wind Farm Investment, Employment and Carbon Abatement in Australia
- ↑ (22 May 2011).Carbon tax is delaying investment: McIndoe. Inside Business. Australian Broadcasting Corporation. Retrieved on 12 March 2012.
- ↑ Royce Millar & Adam Morton (21 May 2011). Big banks 'no' to coal plant. The Age. Fairfax Media. Retrieved on 12 March 2012.
- ↑ Four corners (video). Retrieved 8 July 2014
- ↑ Australia's largest solar farm opens amid renewable target debate The Greenough River Solar project in Western Australia is expected to have enough capacity to power 3,000 homes The Guardian 10 October 2
- ↑ Energy in Sweden 2010, Table 1: Emissions of carbon dioxide in total, per capita and per GDP in EU and OECD countries, 2007
- ↑ Global warming 'will be worse than expected' warns Stern The Guardian 12.3.2009
- ↑ Which nations are really responsible for climate change - interactive map The Guardian 8 December 2011 (All goods and services consumed, source: Peters et al PNAS, 2011)
| Fossil Fuel Industry | |
|---|---|
| Renewable Energy Industry | |
| Policies and Targets | |
| Nuclear power | |
| Agencies |
|
| Research | |
| Other topics | |
| |
| History | |
|---|---|
| Currency | |
| State economies | |
| Industries | |
| Taxation | |
| Banking and Finance | |
| Regulatory agencies | |
| Energy | |
| Economic conditions | |
| Unions | |
| Trade agreements | |
| |