Electricity pricing
Electricity pricing (sometimes referred to as electricity tariff or the price of electricity) varies widely from country to country, and may vary significantly from locality to locality within a particular country. There are many reasons that account for these differences in price. The price of power generation depends largely on the type and market price of the fuel used, government subsidies, government and industry regulation, and even local weather patterns.
Basis of electricity rates
Electricity prices vary between countries and can even vary within a single region or distribution network of the same country. In standard regulated monopoly markets, electricity rates typically vary for residential, commercial, and industrial customers. Prices for any single class of electricity customer can also vary by time-of-day or by the capacity or nature of the supply circuit (e.g., 5 kW, 12 kW, 18 kW, 24 kW are typical in some of the large developed countries); for industrial customers, single-phase vs. 3-phase, etc. If a specific market allows real-time dynamic pricing, a more recent option in limited markets to date typically following the introduction of electronic metering, prices can even vary between times of low and high electricity network demand.
The actual electricity rate (cost per unit of electricity) that a customer pays can often be heavily dependent on customer charges, particularly for small customers (e.g. residential users).[1]
The cost also differs by the source of the electricity. In the U.S. in 2002, the typical cost of electricity from different sources is around: Coal: 1-4 cents; Gas: 2.3-5.0 cents; Oil: 6-8 cents; Wind: 5-7 cents; Nuclear: 6-7 cents; Solar: 12.2 cents. [2] However, electricity costs vary greatly. Renewable sources reach grid parity in parts of the world where conventional power plants based on fossil fuel are costly enough (e.g. transportation costs of diesel to isolated communities). The varying costs involved in producing electricity lead to great variance in average electricity rates for residents of different states in the U.S.[3]
In many countries, the tariff is considerably lower for high electricity users compared to electricity savers.[4] In Finland the low electricity users in households may pay ca 30% fixed price.[5]
Price comparison
The table below shows simple comparison of current electricity tariffs in industrialised countries and territories around the world, expressed in US dollars. Whilst useful for comparing world electricity prices at a glance it does not take into account a number of significant factors including fluctuating international exchange rates, a country's individual purchasing power parity, government electricity subsidies or retail discounts that are often available in deregulated electricity markets.[7]
For example, in 2012, Hawaii residents had the highest average residential electricity rate in the United States (37.34¢/kWh), while Louisiana residents had the lowest average residential electricity costs (8.37¢/kWh). Even in the contiguous United States the gap is significant, with New York residents having the highest average residential electricity rates in the lower 48 U.S. states (17.62¢/kWh).[8]
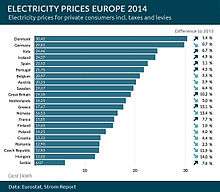
A comparative list of June 2009 prices for Europe may be found in the European Household Electricity Price Index.[9]
Global electricity price comparison
For comparison:
- 1 cubic metre of methane contains about 38 MJ LHV of energy or about 10.5 kWh
- 1 litre of gasoline/petrol contains 33 megajoules or about 9,2 kWh
- 1 US gallon of gasoline contains 120 megajoules or about 33,3 kWh
- 70 standard alkaline AA batteries contain 1 megajoule or about 280 Wh
| Country/Territory | US cents/kWh | US cents/megajoule | Date | Source |
|---|---|---|---|---|
| American Samoa | 38.3 to 40.4 | 10.64 to 11.22 | [10] | |
| Argentina | 3.1[a] (subsidized) | 0.86 (Buenos Aires) | 2006 | [7][11] |
| Argentina (Concordia) | 19.13[a] | 5.31 | Jun 14, 2013 | |
| Australia | varies by state anywhere from 15-22 per kWh
mans a service fee of 70 cents a day |
6.11 to 11.06 | Aug 23, 2012 | [12][13] |
| Bahrain | 0.79 to 4.23 (0.79 for first 3000 kWh; 2.38 for 3001-5000 kWh and 4.23 for every additional kWh. Exchange rate used from BHD to USD is 0.378) | Aug 19, 2015 | [14] | |
| Bangladesh | 2.95 to 9.24 | Mar 13, 2014 | [15] | |
| Belgium | 29.08 | 8.08 | Nov 1, 2011 | [16][17] |
| Bhutan | 1.88 to 4.40 | 0.52 to 1.22 | Mar 23, 2012 | [18][19] |
| Bulgaria | 13.38 day (between 7:00-23:00 DST); 9.13 night | 2.54 to 3.72 | Oct 29, 2014 | [20][21][22] |
| Brazil | 12.00 to 25.00 varying by state and Electricity Service Provider | Jul 7, 2016 | [23] | |
| Cambodia | 15.63 to 21.00 in Phnom Penh | 4.34 to 5.83 | Feb 28, 2014 | [24][25] |
| Canada, Ontario | 14.6 | 2015 | [26] | |
| Canada, Ontario, Toronto | 6.52 to 11.69 depending on time of day plus transmission, delivery, and other charges of about 3.75 per kWh | 1.81 to 3.25 | Feb 9, 2014 | [27] |
| Canada, Quebec | 5.41 for the first 30 kWh/day then 7.78 + 40.64/day for subscription fee | 2012 | [28] | |
| China | 0.04 USD - 0.45 USD | 2014 | [29] | |
| Chile | 23.11 | Jan 1, 2011 | [30][31] | |
| Colombia (Bogota) | 18.05 | Jun 1, 2013 | [32][33] | |
| Cook Islands | 34.6 to 50.2 | [10] | ||
| Croatia | 17.55 | Jul 1, 2008 | [34] | |
| Denmark | 33 | May 1, 2015 | [16][17] | |
| United Arab Emirates | 6.26 to 10.35 (plus 1.63 fuel surcharge) | [35][36] | ||
| Egypt | Priced into sections at a kWh/Month, subsidized[a]
0.98 @ 0-50 kWh/M |
Jul 17, 2014 | [37] | |
| Ethiopia | 6.7 to 7.7[a] | Dec 31, 2012 | [39] | |
| Fiji | 12 to 14.2 | [10] | ||
| Finland | 20.65 | Nov 1, 2011 | [16][17] | |
| France | 19.39 | Nov 1, 2011 | [16][17] | |
| Germany | 32.04 | Feb 1, 2015 | [40] | |
| Romania | 18.40 | Jun 26, 2013 | [41] | |
| Guyana | 26.80 | Apr 1, 2012 | [42] | |
| Switzerland | 25.00 | Jan 6, 2014 | [43] | |
| Hungary | 23.44 | Nov 1, 2011 | [16][17] | |
| Hong Kong | 12.04 to 24.05 | Jan 1, 2013 | [44][45] | |
| India | 0.1 to 18 (Average 7) | Feb 1, 2013 | [46] | |
| Indonesia | 11 | Jul 21, 2015 | [47] | |
| Iceland | 5.54 | Nov 8, 2015 | [48] | |
| Iran | 2 to 19 | Jul 1, 2011 | ||
| Iraq | Residential pricing per kWh used, subsidized[a]
2.5 @ 0-500 kWh/M |
Apr 8, 2015 | [49] | |
| Ireland | 28.36 | Nov 1, 2011 | [16][17] | |
| Israel | 16[a] | Jun 1, 2013 | [50] | |
| Italy | 28.39 | Nov 1, 2011 | [16][17] | |
| Jamaica | 44.7 | Dec 4, 2013 | [51][51] | |
| Japan | 20 to 24 | Dec 31, 2009 | [52][53] | |
| Jordan | 5[a] to 33 | Jan 30, 2012 | [54] | |
| Kiribati | 32.7 | [55] | ||
| South Korea | Priced into a sliding scale at a kWh/Month, residential service (low-voltage)[a]
5.1 @ 0-100 kWh/M |
Jan 14, 2013 | [56] | |
| Kuwait | 0.3 to 3 | Jan 1, 2016 | [57] | |
| Laos | 11.95 for >150kWh, 4.86 for 26-150 kWh, 4.08 for 0-25 kWh | Feb 28, 2014 | [58][59] | |
| Latvia | 18.25 | Jun 1, 2012 | [60][60] | |
| Lithuania | 12 | July 1, 2016 | [61] | |
| Macedonia | 7 to 10
industrial-14 |
Aug 1, 2013 | [62] | |
| Malaysia | Domestic Consumer pricing per kWh used, subsidized
4.95 @ 1 to 200 kWh |
Jan 1, 2014 | [63] | |
| Marshall Islands | 32.6 to 41.6 | [64] | ||
| Mexico | 19.28[b] | Aug 22, 2012 | [65][66] | |
| Moldova | 11.11 | Apr 1, 2011 | [67] | |
| Myanmar | 3.6 | Feb 28, 2014 | ||
| Nepal | 7.2 to 11.2 | Jul 16, 2012 | [68] | |
| Netherlands | 28.89 | Nov 1, 2011 | [16][17] | |
| New Caledonia | 26.2 to 62.7 | [10] | ||
| New Zealand | 19.15 | Apr 19, 2012 | ||
| Nicaragua | Priced into a sliding scale at a kWh/Month,[a] Residential T-0
10 @ 0-25 kWh/M |
Sep 1, 2014 | [69] | |
| Niue | 44.3 | [55] | ||
| Nigeria | 2.58 to 16.55 | Jul 2, 2013 | [70] | |
| Norway | 15.9 | Jul 25, 2013 | ||
| Pakistan | General Supply Tariff - Residential
2 < 50 kWh/M |
14 Jul 2015 | [71] | |
| Palau | 22.83 | [55] | ||
| Papua New Guinea | 19.6 to 38.8 | [10] | ||
| Paraguay | 8 | 2011 | [72] | |
| Peru | 10.44 | 2007 | [73][74] | |
| Philippines | 18.22 | October 7, 2015 | [75] | |
| Portugal | 25.25 | Nov 1, 2011 | [16][17] | |
| Russia | 2.4 to 14 | Nov 1, 2011 | [16][17] | |
| Rwanda | 22 to 23.6 |
2016 | [76] | |
| Saudi Arabia | 1 to 7 (from the first 2,000 kWh/month to more than 10,000 kWh/month) | Sep 9, 2015 | [77] | |
| Serbia | 3.93 to 13.48, average ~6,1[d] | Feb 28, 2013 | [78] | |
| Singapore | 25.28 | Sep 30, 2014 | [79] | |
| Spain | 15 | May 1, 2015 | [80] | |
| Sri Lanka | Priced into sections at a kWh/Month, subsidized[a]
1.84 @ 0-30 kWh/M |
Sep 16, 2014 | [81] | |
| Solomon Islands | 88 to 99 | [82] | ||
| South Africa | 13 | Sep 29, 2015 | [83][84] | |
| Surinam | 3.90 to 4.84 | Nov 20, 2013 | [85] | |
| Sweden | 8.33 | Feb 3, 2015 | [16] | |
| Tahiti | 25 to 33.1 | [10] | ||
| Taiwan | 7 to 17 | Jun 1, 2012 | [86] | |
| Thailand | 6 to 13 | July 1, 2013 | [87] | |
| Tonga | 47 | Jun 1, 2011 | [10] | |
| Trinidad and Tobago | 4 | July 8, 2015 | [88] | |
| Turkey | 11.20 residential (Low voltage)
11.29 business (Low voltage) 8.78 industry (Medium voltage) |
Jul 1, 2016 | [89] | |
| Turks and Caicos Islands | 35.39 | March 16, 2016 | [90] | |
| Tuvalu | 36.55 | [55] | ||
| Uganda | 4.44 (First 15 kWh in a month for domestic consumers)
19.26 (Above 15 kWh in a month for domestic consumers) |
Aug 9, 2016 | [91] | |
| Ukraine | 2.6 to 10.8 | 2014 | [92][93] | |
| United Kingdom | 22 | May 1, 2015 | [16][94] | |
| United States | 8 to 17 ; 37[c] 43[c] | Sep 1, 2012 | [95][96] | |
| United States Virgin Islands | 48.9 to 51.9 | Oct 1, 2014 | [97] | |
| United Arab Emirates- Al Ain | 0 to 8.23 (i.e. AED 0 to AED 0.305) | 2017 | [98] | |
| Uruguay | 17.07 to 26.48 | Feb 11, 2014 | [99] | |
| Uzbekistan | 4.95 | 2011 | [100] | |
| Vanuatu | 60 | [10] | ||
| Venezuela | 3.1 at Official exchange rate ( 13.50 Bs/US$) or 0.48 cents at unofficial exchange rate (1.095 Bs/US$) | [101] | ||
| Vietnam | 6.20 to 10.01 | 2011 | [102] | |
| Western Samoa | 30.5 to 34.7 | [10] |
a Denotes countries with government subsidized electricity tariffs.[103][104][105]
b Mexico has subsidized electricity tariffs according consumption limits, more than 500kWh consumed bimonthly meet no subsidies. This tariff corresponds to the most expensive. Only 1% of Mexico's population pays this tariff.[106]
c Hawaii.
d Prices don't include VAT (20%)
e San Diego, California high-tier
The U.S. Energy Information Administration (EIA) also publishes an incomplete list of international energy prices, while the International Energy Agency (IEA) provides a thorough, quarterly review for purchase.
Forecasting
Electricity price forecasting is simply the process of using mathematical models to predict what electricity prices will be in the future.
Forecasting methodology
The simplest model for day ahead forecasting is to ask each generation source to bid on blocks of generation and choose the cheapest bids. If not enough bids are submitted, the price is increased. If too many bids are submitted the price can reach zero or become negative. The offer price includes the generation cost as well as the transmission cost along with any profit. Power can also be sold or purchased from adjoining power pools.[107][108][109]
Wind power and solar power, being non-dispatchable, is normally taken before any other bids, and at a pre-determined rate for each supplier. Any excess is sold to another grid operator, or stored, using pumped-storage hydroelectricity, or in the worst case, curtailed.[110] The HVDC Cross-Channel line between England and France is bidirectional, but is normally used to capacity to purchase power from France. Allocation is done by bidding.[111]
Driving factors
In addition to the basic production cost of electricity, electricity prices are set by supply and demand.[112] Everything from salmon migration to forest fires can affect current and future power prices. However, when forecasting those prices there are some fundamental drivers that are the most likely to be considered.
Power quality
In the modern world, transmission, production and consuming electrical power associated with excessive Total Harmonic Distortions (THD) and not unity Power Factor (PF) would be costly for owners. Cost of PF and THD impact is difficult to estimate, but it causes heat and vibration, malfunctioning, and even meltdowns. Usually the electric company monitors the situation at the transmission level, and it is difficult to predict or model at the consuming level. A spectrum of Compensation devices [113] mitigate at some level any bad outcomes, but true improvements would be achieved only with real-time Correction devices (old style switching type [114] modern low-speed DSP driven [115] and near real-time [116]). Most modern devices reduce a wide range of problems, while maintaining short ROI and significant reduction of ground currents. Another reason to mitigate the problems is to reduce cost for the operation and generation of the electrical energy, which is commonly done by Electric Power Distribution companies in conjunction with generation companies. Power Quality out of unity would cause serious erroneous responses from many kinds of analog and digital equipment, where the response could be unpredictable.
Phase balancing
Currently most common distribution network and generation of electrical power is done with 3 phase structures, with special attention paid to the phase balancing and resulting reduction of ground current. It is true for industrial or commercial networks where most power is used in 3 phase machines, but light commercial and residential users would not have real-time capabilities to do phase balancing. Often this issue leads to unexpected equipment behavior or malfunctions and in extreme cases fires. For example, sensitive professional analogue or digital recording equipment always needs to be connected to well balanced and grounded power networks. To determine and mitigate the cost of the unbalanced electricity network, electric companies in most cases charge by demand or as separate category for heavy unbalanced loads. There are a few simple techniques available for balancing,[117] but in the dynamic world of demanding loads, it would be difficult to do it without fast computing and real-time modeling.
Weather driven demand
Studies show that generally demand for electricity is driven largely by temperature. Heating demand in the winter and cooling demand (air conditioners) in the summer are what primarily drive the seasonal peaks in most regions. Heating degree days and cooling degree days help measure energy consumption by referencing the outdoor temperature above and below 65 degrees Fahrenheit, a commonly accepted baseline.[118]
Hydropower availability
Snowpack, streamflows, seasonality, salmon, etc. all affect the amount of water that can flow through a dam at any given time. Forecasting these variables allows one to predict the available potential energy for a dam for a given period.[119] Some regions such as the Pacific Northwest get a large percentage of their generation from hydro-electric dams.
Power plant and transmission outages
Whether planned or unplanned, outages affect the total amount of power that is available to the grid.
Fuel prices
The fuel used to generate electricity at a power plant is the primary cost incurred by electrical generation companies. Particularly, coal, as a fuel for base load power plants and more important, to a degree, natural gas for peaking power plants affect power prices.[120] This will change as more renewable energy is used, when the capital cost will be the primary cost, as renewable energy (other than biomass and biofuel) has no fuel cost.
Economic health
During times of economic hardship, many factories will cut back their production due to a reduction of consumer demand and therefore reduce production-related electrical demand.[121]
See also
- Cost of electricity by source
- Energy economics
- Feed-in tariff
- Stranded costs
- Levelised energy cost
- Electricity market
- Electricity liberalization
- Demand response
- Spark spread
References
- ↑ J. M. Pearce and Paul J. Harris, "Reducing greenhouse gas emissions by inducing energy conservation and distributed generation from elimination of electric utility customer charges", Energy Policy, 35, pp. 6514-6525, 2007. Open access available
- ↑ "http://www.usnews.com/news/articles/2016-03-31/when-will-rooftop-solar-be-cheaper-than-the-grid"
- ↑ "EIA - Electricity Data". www.eia.gov. Retrieved November 17, 2016.
- ↑ "Electricity Savings". Archived from the original on November 17, 2016. Retrieved November 17, 2016.
- ↑ http://srren.ipcc-wg3.de/report/IPCC_SRREN_Annex_II.pdf see page 10 Moomaw, W., P. Burgherr, G. Heath, M. Lenzen, J. Nyboer, A. Verbruggen, 2011: Annex II: Methodology. In IPCC Special Report on Renewable Energy Sources and Climate Change Mitigation.
- ↑ Strom-Report: Electricity prices in Europe
- 1 2 "Los precios de la energía, desiguales en el país y lejos de los valores regionales" [Energy prices unequal in the country and much lower in the capital] (in Spanish). LA NACION. November 20, 2006. Retrieved March 30, 2012.
- ↑ "Electricity Rates and Usage in the United States". Electricity Local. Retrieved 2014-03-25.
- ↑ European Household Electricity Price Index for Europe (HEPI), Who is paying the most, who is paying the least and where are prices heading in Europe?, June 2009
- 1 2 3 4 5 6 7 8 9 [Pacific power association]
- ↑
- ↑ ,,Lumo Energy
- ↑ http://www.lumoenergy.com.au/cms/images/pdf/20130701_PFS_SA_Elec_BusinessOptions.pdf
- ↑ "Ministry of Water and electricity". BERC, MoW&E. 2015. Retrieved Aug 19, 2015.
- ↑ "The Bangladesh Energy Regulatory Commission" (PDF). BERC, Govt. of Bangladesh. March 2014. Retrieved Aug 12, 2014.
- 1 2 3 4 5 6 7 8 9 10 11 12 EEP
- 1 2 3 4 5 6 7 8 9 10 Domestic EU Electricity Prices
- ↑ BPC
- ↑ BPC Electricity Tariffs
- ↑ DKER
- ↑ EVN
- ↑ Invest Bulgaria
- ↑ Light
- ↑ Electricity Authority of Cambodia
- ↑ "Report on Power Sector of the Kingdom of Cambodia 2013 Edition" (PDF). Electricity Authority of Cambodia. 2013. Retrieved February 28, 2013.
- ↑ p.93
- ↑ THES
- ↑
- ↑ "全面反映电价水平变化 促进电价形成机制改革---国家能源局". www.nea.gov.cn. Retrieved 2016-07-25.
- ↑ Chilectra
- ↑ "Energy Supply Pricing for Clients Subject to Price Regulation" (PDF). Chilectra. Jan 1, 2011. Retrieved Feb 10, 2011.
- ↑ CODENSA
- ↑ "TARIFAS DE ENERGÍA ELÉCTRICA ($/kWh) REGULADAS POR LA COMISIÓN DE REGULACIÓN DE ENERGÍAY GAS (CREG) JULIO DE 2013" (PDF). Codensa. Jun 1, 2013. Retrieved Jun 30, 2013.
- ↑ HEP
- ↑ DEWA
- ↑
- ↑ EgyptERA
- ↑
- ↑ http://www.sudantribune.com/spip.php?article45028
- ↑
- ↑
- ↑ GPL
- ↑
- ↑ HEC
- ↑ CLP Power
- ↑ "Tariff & duty of electricity supply in India" (PDF). CEA, Govt. of India. March 2014. Retrieved Aug 12, 2014.
- ↑ Tariff-Adjusment-Juni-2015.pdf
- ↑ "Verðskrár". www.or.is. Retrieved 2015-11-08.
- ↑
- ↑ http://www.iec.co.il/HomeClients/Pages/TariffsAndAccounts.aspx
- 1 2
- ↑
- ↑
- ↑ ERC
- 1 2 3 4
- ↑ KEPCO
- ↑ Kuwait Ministry of Electricity & Water
- ↑ Electricite Du Laos
- ↑ "Electricity Tariff As Updated 3/2012 TO 12/2017". Electricite Du Laos. March 2012. Retrieved Feb 28, 2014.
- 1 2 Latvenergo
- ↑ ESO
- ↑ ERC
- ↑
- ↑ http://mecrmi.net/tariffs.htm
- ↑ CFE
- ↑ "CFE 2012".
- ↑ RUF
- ↑ NEA
- ↑ INE
- ↑ NaijaTechGuide
- ↑ LESCOFESCO
- ↑ ANDE
- ↑ PTL
- ↑ Pliegos tarifarios de Lima-OSINERGMIN/GART
- ↑
- ↑
- ↑ Saudi Electricity Company
- ↑
- ↑
- ↑ Iberdrola,energy.eu
- ↑
- ↑ [SIEA new tariffs residential/business fuel price adjusted]
- ↑ Eskom
- ↑ "Electricity prices: South Africa vs the world". Retrieved 2015-09-29.
- ↑ NEVBS N.V. EnergieBedrijven Suriname
- ↑
- ↑ BOI
- ↑
- ↑ TEDAS
- ↑
- ↑ "Electricity End-User Tariffs and Charges Applicable For the Third Quarter (July to September) 2016" (PDF). UMEME. Retrieved 9 August 2016.
- ↑ Electricity prices for individuals - Kyivenergo
- ↑ Electricity prices for corporate consumers - Kyivenergo
- ↑ EP
- ↑ EIA
- ↑ Electric Power Monthly Average Retail Price of Electricity pg. 106
- ↑ WAPA
- ↑ http://aadc.ae/pdfs/Tariff/Tariff2017-English.pdf
- ↑ UTE
- ↑ Stroyka.uz
- ↑ [CORPOELECT]
- ↑ Reuters
- ↑ http://www.bloomberg.com/news/2011-11-10/argentina-doubles-power-prices-for-companies-to-stem-widening-budget-gap.html
- ↑ http://online.wsj.com/article/BT-CO-20120725-721044.html
- ↑ http://uk.reuters.com/article/2012/07/18/uk-israel-electric-idUKBRE86H0IT20120718?feedType=RSS&feedName=GCA-GoogleNewsUK
- ↑ http://app.cfe.gob.mx/Aplicaciones/CCFE/Tarifas/Tarifas/Tarifas_casa.asp?Tarifa=domesticas2003&anio=2012
- ↑ ISO NE
- ↑ NY ISO
- ↑ ERCOT
- ↑ Wind Power and Electricity Markets
- ↑ IFA Overview
- ↑ The power market - how does it work
- ↑
- ↑
- ↑
- ↑
- ↑
- ↑ Robert Carver. "What Does It Take to Heat a New Room?". American Statistical Association. Retrieved 2010-02-14.
- ↑ "More Reliable Forecasts for Water Flows Can Reduce Price of Electricity". Body of Knowledge on Infrastructure Regulation. January 19, 2010. Retrieved 2010-01-24.
- ↑ "Annual Energy Outlook Early Release Overview". U.S. Energy Information Administration. Retrieved 2010-01-24.
- ↑ "Demand Forecasting for Electricity" (PDF). Body of Knowledge on Infrastructure Regulation. Retrieved 2010-01-24.
External links
- JCM Contour Map
- Electricity Price Forecasting
- Electricity Price Comparison Service UK
- Electricity Price Check BG