Electricity sector in India
| Data | |
|---|---|
| Electricity coverage | 81% (2013)[1] |
| Installed capacity (31 Oct. 2016) | 307.28 GW |
| Share of fossil energy | 69.2% |
| Share of renewable energy | 28.9% |
| GHG emissions from electricity generation (2014) | 2019.67 MtCO2[2] |
| Average electricity use (2015-16) | 1,075 kWh per capita |
| Distribution losses (2014-15) | 22.77%[lower-alpha 1] |
| Transmission losses (2014-15) | 22.77%[lower-alpha 2] |
| Residential consumption (% of total, 2014-15) | 23.53%[3] |
| Industrial consumption (% of total, 2014-15) | 42.10%[3] |
| Commercial consumption (% of total, 2014-15) | 8.77%[3] |
| Services | |
| Share of private sector in generation | 42% (October 2016)[4] |
| Institutions | |
| Responsibility for policy-setting | Ministry of Power |
| Responsibility for renewable energy | Ministry of New and Renewable Energy |
| Responsibility for the environment | Ministry of Environment, Forest and Climate Change |
| Electricity sector law | Electricity Act, 2003 |

- Coal: 186,492.88 MW (60.7%)
- Large Scale Hydro: 43,112.43 MW (14.0%)
- Small Scale Hydro: 4,323.37 MW (1.4%)
- Wind Power: 28,082.95 MW (9.1%)
- Biomass: 4,882.33 MW (1.6%)
- Solar Power: 8,513.23 MW (2.8%)
- Gas: 25,057.13 MW (8.2%)
- Nuclear: 5,780 MW (1.9%)
- Diesel: 918.89 MW (0.3%)

The utility electricity sector in India had an installed capacity of 307.28 GW as of 31 October 2016. Renewable power plants constituted 28.9% of total installed capacity.[4] The gross electricity generated by utilities is 1,106 TWh and 166 TWh by captive power plants during the 2014–15 fiscal.[3] The gross electricity generation includes auxiliary power consumption of power generation plants.[5] India is the world's third largest producer and fourth largest consumer of electricity.[6]
During the fiscal year 2014-15, the per capita electricity generation in India was 1,010 kWh with total electricity consumption (utilities and non utilities) of 938.82 TWh or 746 kWh per capita electricity consumption.[3] Electric energy consumption in agriculture was recorded highest (18.45%) in 2014-15 among all countries.[3] The per capita electricity consumption is lower compared to many countries despite cheaper electricity tariff in India.[7]
By the end of calendar year 2015, despite poor hydro electricity generation, India has become power surplus country with huge power generation capacity idling for want of electricity demand.[8][9][10][11] The calendar year 2016 started with steep fall in the international price of energy commodities such as coal, diesel oil, naphtha, bunker fuel and LNG which are used in electricity generation in India.[12][13][14][15][16] Earlier many of the power stations which are using fuels other than coal are unable to operate due to high cost of LNG and petro products. This situation has changed due to glut in petroleum products globally. The prices are falling to such an extent that these fuels have become cheaper to give competition for pit head coal based power generators. Many of the stranded gas and liquid fuel based power stations would be competing with indigenous coal based power stations in an electricity market where demand growth is not encouraging.[17] All the segments of the electricity sector such as fuel suppliers, fuel transporters (railways, harbours, pipelines, etc.), Electricity generators, electricity transmission companies and distribution companies would be facing severe competition to cut down the prices and improve their operating efficiency in a final consumer dictated market.[18] If the power distribution companies, keep on charging exorbitant tariffs to bulk consumers, they would be opting for solar/wind power plants or take over an existing power plant to meet their captive consumption. Due to tepid growth in electricity consumption, coal stocks are continuously building up at power stations as well as coal mines.[19][20]
In order to address the lack of adequate electricity availability to all the people in the country by March 2019, GoI has launched a scheme called "Power for All".[21] This scheme will ensure continuous and uninterrupted electricity supply to all households, industries and commercial establishments by creating and improving necessary infrastructure. Its a joint collaboration of GoI with states to share funding and create overall economic growth.[22][23]
History
The first demonstration of an electric light in Calcutta (now Kolkata) was conducted on 24 July 1879 by P.W. Fleury & Co. On 7 January 1897, Kilburn & Co secured the Calcutta electric lighting licence as agents of the Indian Electric Co, which was registered in London on 15 January 1897. A month later, the company was renamed the Calcutta Electric Supply Corporation. The control of the company was transferred from London to Calcutta only in 1970. Enthused by the success of electricity in Calcutta, power was thereafter introduced in Bombay (now Mumbai).[24] Mumbai saw electric lighting demonstration for the first time in 1882 at Crawford Market and the Bombay Electric Supply & Tramways Company (BEST) set up a generating station in 1905 to provide electricity for the tramway.[25]
The first hydroelectric installation in India was installed near a tea estate at Sidrapong for the Darjeeling Municipality in 1897.[26] The first electric street light in Asia was lit on 5 August 1905 in Bangalore.[27] The first electric train in the country ran on the Harbour Line between Bombay's Victoria Terminus and Kurla on 3 February 1925.[28] On 18 August 2015, Cochin International Airport became the world's first fully solar powered airport with the inauguration of a dedicated solar plant.[29][30]
India began utilizing grid management on a regional basis in the 1960s. Individual State grids were interconnected to form 5 regional grids covering mainland India. The grids were the Northern, Eastern, Western, North Eastern and Southern Grids. These regional links were established to enable transmission of surplus electricity between States in each region. In the 1990s, the Indian government began planning for a national grid. Regional grids were initially interconnected by asynchronous HVDC back-to-back links facilitating limited exchange of regulated power. The links were subsequently upgraded to high capacity synchronous links.[31]
The first interconnection of regional grids was established in October 1991 when the North Eastern and Eastern grids were interconnected. The Western Grid was interconnected with the aforementioned grids in March 2003. The Northern grid was also interconnected in August 2006, forming a Central Grid synchronously connected operating at one frequency.[31] The sole remaining regional grid, the Southern Grid, was synchronously interconnected to the Central Grid on 31 December 2013 with the commissioning of the 765 kV Raichur-Solapur transmission line, thereby establishing the National Grid.[32][31]
Installed capacity
The total installed power generation capacity is sum of utility capacity, captive power capacity and other non-utilities
Utility power
| Installed Capacity as on |
Thermal (MW) | Nuclear (MW) |
Renewable (MW) | Total (MW) | % Growth (on yearly basis) | |||||
|---|---|---|---|---|---|---|---|---|---|---|
| Coal | Gas | Diesel | Sub-Total Thermal |
Hydro | Other Renewable | Sub-Total Renewable | ||||
| 31-Dec-1947 | 756 | - | 98 | 854 | - | 508 | - | 508 | 1,362 | - |
| 31-Dec-1950 | 1,004 | - | 149 | 1,153 | - | 560 | - | 560 | 1,713 | 8.59% |
| 31-Mar-1956 | 1,597 | - | 228 | 1,825 | - | 1,061 | - | 1,061 | 2,886 | 13.04% |
| 31-Mar-1961 | 2,436 | - | 300 | 2,736 | - | 1,917 | - | 1,917 | 4,653 | 12.25% |
| 31-Mar-1966 | 4,417 | 137 | 352 | 4,903 | - | 4,124 | - | 4,124 | 9,027 | 18.80% |
| 31-Mar-1974 | 8,652 | 165 | 241 | 9,058 | 640 | 6,966 | - | 6,966 | 16,664 | 10.58% |
| 31-Mar-1979 | 14,875 | 168 | 164 | 15,207 | 640 | 10,833 | - | 10,833 | 26,680 | 12.02% |
| 31-Mar-1985 | 26,311 | 542 | 177 | 27,030 | 1,095 | 14,460 | - | 14,460 | 42,585 | 9.94% |
| 31-Mar-1990 | 41,236 | 2,343 | 165 | 43,764 | 1,565 | 18,307 | - | 18,307 | 63,636 | 9.89% |
| 31-Mar-1997 | 54,154 | 6,562 | 294 | 61,010 | 2,225 | 21,658 | 902 | 22,560 | 85,795 | 4.94% |
| 31-Mar-2002 | 62,131 | 11,163 | 1,135 | 74,429 | 2,720 | 26,269 | 1,628 | 27,897 | 105,046 | 4.49% |
| 31-Mar-2007 | 71,121 | 13,692 | 1,202 | 86,015 | 3,900 | 34,654 | 7,760 | 42,414 | 132,329 | 5.19% |
| 31-Mar-2012 | 112,022 | 18,381 | 1,200 | 131,603 | 4,780 | 38,990 | 24,503 | 63,493 | 199,877 | 9.00% |
| 31 Mar 2015 | 169,118 | 23,062 | 1,200 | 188,898 | 5,780 | 41,267 | 35,777 | 77,044 | 271,722 | 11.98% |
| 31 Mar 2016 | 185,172 | 24,508 | 993 | 210,675 | 5,780 | 42,783 | 42,727 | 85,510 | 301,965 | 11.13% |
As of 31 June 2016, the achieved thermal power generation capacity addition excluding renewable power is 82,415 MW against the target of 155,870 MW during the 12th five-year plan which would end on 31 March 2017.[33]
Captive power
The installed captive power generation capacity (above 1 MW capacity) in the industries is 47,082 MW as on 31 March 2015.[3] Another 75,000 MW capacity diesel power generation sets (excluding sets of size above 1 MW and below 100 kVA) are also installed in the country.[34][35] In addition, there are innumerable DG sets of capacity less than 100 kVA to cater to emergency power needs during the power outages in all sectors such as industrial, commercial, domestic and agriculture.[36]
| Source | Captive Power Capacity (MW) | Share | ||
|---|---|---|---|---|
| Coal | 27,588 | 58.60% | ||
| Hydroelectricity | 83 | 0.17% | ||
| Renewable energy source | Included in 'Oil' | |||
| Natural Gas | 5,215 | 11.08% | ||
| Oil | 14,196 | 30.17% | ||
| Total | 47,082 | 100.00% | ||
The total installed utility power generation capacity as on 31 August 2016 with sector wise & type wise break up is as given below.[4]
| Sector | Thermal (MW) | Nuclear (MW) |
Renewable (MW) | Total (MW) | |||||
|---|---|---|---|---|---|---|---|---|---|
| Coal | Gas | Diesel | Sub-Total Thermal |
Hydro | Other Renewable | Sub-Total Renewable | |||
| Central | 51,390.00 | 7,490.83 | 0.00 | 58,880.83 | 5,780.00 | 11,651.43 | 0.00 | 11,651.43 | 76,312.26 |
| State | 64,210.50 | 7,210.70 | 363.93 | 71,785.13 | 0.00 | 28,197.00 | 1,963.80 | 30,055.81 | 101,945.93 |
| Private | 70,992.38 | 10,355.60 | 554.96 | 81,902.94 | 0.00 | 3,120.00 | 42,273.12 | 44,236.92 | 127,296.06 |
| All India | 186,592.88 | 25,057.13 | 918.89 | 212,568.90 | 5,780.00 | 42,968.43 | 44,236.92 | 87,205.35 | 305,554.25 |
| Percentage | 61.06 | 8.20 | 0.30 | 69.56 | 1.89 | 14.06 | 14.47 | 28.54 | 100 |
Installed capacity by state or territory
| State/Union Territory | Thermal (in MW) | Nuclear (in MW) |
Renewable (in MW) | Total (in MW) |
% of Total | |||||
|---|---|---|---|---|---|---|---|---|---|---|
| Coal | Gas | Diesel | Sub-Total Thermal |
Hydro | Other Renewable | Sub-Total Renewable | ||||
| Maharashtra | 24,669.27 | 3,475.93 | - | 28,145.20 | 690.14 | 3,331.84 | 6,205.65 | 9,537.49 | 38,372.83 | 13.91% |
| Gujarat | 16,010.27 | 6,806.09 | - | 22,816.36 | 559.32 | 772.00 | 4,802.40 | 5,574.4 | 28,950.08 | 10.49% |
| Madhya Pradesh | 11,126.39 | 257.18 | - | 11,383.57 | 273.24 | 3,223.66 | 1,670.34 | 4,894.00 | 16,550.81 | 6.00% |
| Chhattisgarh | 13,193.49 | - | - | 13,193.49 | 47.52 | 120.00 | 327.18 | 447.18 | 13,688.19 | 4.96% |
| Goa | 326.17 | 48.00 | - | 374.17 | 25.80 | - | 0.05 | 0.05 | 400.02 | 0.14% |
| Dadra & Nagar Haveli | 44.37 | 27.10 | - | 71.47 | 8.46 | - | - | - | 79.93 | 0.03% |
| Daman & Diu | 36.71 | 4.20 | - | 40.91 | 7.38 | - | - | - | 48.29 | 0.02% |
| Central - Unallocated | 1,622.35 | 196.91 | - | 1,819.26 | 228.14 | - | - | - | 2,047.40 | 0.74% |
| Western Region | 67,029.01 | 10,815.41 | - | 77,844.42 | 1,840.00 | 7,447.50 | 13,005.62 | 20,453.12 | 100,137.54 | 36.29% |
| Rajasthan | 9,400.72 | 825.03 | - | 10,225.75 | 573.00 | 1,719.30 | 4,710.50 | 6,429.8 | 17,228.55 | 6.24% |
| Uttar Pradesh | 11,677.95 | 549.97 | - | 12,227.92 | 335.72 | 2,168.30 | 989.86 | 3,158.16 | 15,721.80 | 5.70% |
| Punjab | 6,444.88 | 288.92 | - | 6,733.80 | 208.04 | 3,145.13 | 503.42 | 3,648.55 | 10,590.38 | 3.84% |
| Haryana | 6,527.53 | 560.29 | - | 7,087.82 | 109.16 | 1,456.83 | 138.60 | 1,595.43 | 8,792.41 | 3.19% |
| Delhi | 5,001.87 | 2,366.01 | - | 7,367.88 | 122.08 | 822.05 | 34.71 | 856.76 | 8,346.72 | 3.03% |
| Himachal Pradesh | 152.02 | 61.88 | - | 213.90 | 34.08 | 3,421.51 | 728.91 | 4,150.42 | 4,398.40 | 1.59% |
| Uttarakhand | 399.50 | 69.35 | - | 468.85 | 22.28 | 2,441.82 | 244.32 | 2,686.14 | 3,177.27 | 1.15% |
| Jammu & Kashmir | 329.32 | 304.14 | - | 633.46 | 77.00 | 1,805.21 | 156.53 | 1,961.74 | 2,672.20 | 0.97% |
| Chandigarh | 32.54 | 15.32 | - | 47.86 | 8.84 | 62.32 | 5.04 | 67.36 | 124.06 | 0.04% |
| Central - Unallocated | 977.19 | 290.35 | - | 1,267.54 | 129.80 | 754.30 | - | 754.30 | 2,151.64 | 0.78% |
| Northern Region | 40.943.50 | 5,331.26 | 12.99 | 46,274.76 | 1,620.00 | 17,796.77 | 7,511.89 | 25,308.66 | 73,203.42 | 26.53% |
| Tamil Nadu | 10,075.10 | 1026.30 | 411.66 | 11,513.06 | 986.50 | 2,182.20 | 8,423.15 | 10,605.35 | 23,104.91 | 8.37% |
| Karnataka | 6,408.46 | - | 234.42 | 6,642.88 | 475.86 | 3,599.80 | 4552.48 | 8,152.28 | 15,271.02 | 5.53% |
| Andhra Pradesh | 5,849.21 | 1,672.65 | 16.97 | 7,538.83 | 127.16 | 1,721.99 | 2,002.65 | 3,724.64 | 11,390.64 | 4.13% |
| Telangana | 5,598.47 | 1,697.75 | 19.83 | 7,316.05 | 148.62 | 2012.54 | 62.75 | 2,075.29 | 9,539.96 | 3.46% |
| Kerala | 1,038.69 | 533.58 | 234.60 | 1,806.87 | 228.60 | 1881.50 | 204.05 | 2,085.55 | 4,121.02 | 1.49% |
| Puducherry | 249.32 | 32.50 | - | 281.82 | 52.78 | - | 0.03 | 0.03 | 334.63 | 0.12% |
| Central - NLC | 100.17 | - | - | 100.17 | - | - | - | - | 100.17 | 0.04% |
| Central - Unallocated | 1,523.08 | - | - | 1,523.08 | 300.48 | - | - | - | 1,823.56 | 0.66% |
| Southern Region | 30,842.50 | 4,962.78 | 917.48 | 36,722.76 | 2,320.00 | 11,398.03 | 15,245.11 | 26,643.14 | 65,685.90 | 23.81% |
| West Bengal | 8,083.83 | 100.00 | - | 8,183.83 | - | 1,248.30 | 131.45 | 1,379.75 | 9,563.84 | 3.47% |
| Odisha | 6,753.04 | - | - | 6,753.04 | - | 2,166.93 | 116.55 | 2,283.48 | 9,036.52 | 3.28% |
| DVC | 7,160.66 | 90.00 | - | 7,250.66 | - | 193.26 | - | 193.26 | 7,443.92 | 2.70% |
| Bihar | 2,516.24 | - | - | 2,516.24 | - | 129.43 | 114.12 | 243.55 | 2,759.79 | 1.00% |
| Jharkhand | 2,404.93 | - | - | 2,404.93 | - | 200.93 | 20.05 | 220.98 | 2,625.91 | 0.95% |
| Sikkim | 92.10 | - | - | 92.10 | - | 174.27 | 52.11 | 226.38 | 318.48 | 0.12% |
| Central - Unallocated | 1,572.07 | - | - | 1,572.07 | - | - | - | - | 1,572.07 | 0.57% |
| Eastern Region | 28,582.87 | 190.00 | - | 28,772.87 | - | 4,113.12 | 434.54 | 4,547.66 | 33,320.53 | 12.08% |
| Assam | 187.00 | 718.62 | - | 905.62 | - | 429.72 | 34.11 | 463.83 | 1,369.45 | 0.50% |
| Tripura | 18.70 | 538.82 | - | 557.52 | - | 62.37 | 21.01 | 83.38 | 640.90 | 0.23% |
| Meghalaya | 17.70 | 105.14 | - | 122.84 | - | 356.58 | 31.03 | 387.61 | 510.45 | 0.19% |
| Arunachal Pradesh | 12.35 | 43.06 | - | 55.41 | - | 97.57 | 104.64 | 202.21 | 257.62 | 0.09% |
| Manipur | 15.70 | 67.98 | 36.00 | 119.68 | - | 80.98 | 5.45 | 86.43 | 206.11 | 0.07% |
| Nagaland | 10.70 | 46.35 | - | 57.05 | - | 53.32 | 29.67 | 82.99 | 140.04 | 0.05% |
| Mizoram | 10.35 | 38.29 | - | 48.64 | - | 34.31 | 36.47 | 70.78 | 119.42 | 0.04% |
| Central - Unallocated | 37.50 | 104.44 | - | 141.94 | - | 127.15 | - | 127.15 | 269.09 | 0.10% |
| North-Eastern Region | 310.00 | 1,662.70 | 36.00 | 2,008.70 | - | 1,242.00 | 262.38 | 1,504.38 | 3,513.08 | 1.27% |
| Andaman & Nicobar | - | - | 40.05 | 40.05 | - | - | 10.35 | 10.35 | 50.40 | 0.02% |
| Lakshadweep | - | - | - | - | - | - | 0.75 | 0.75 | 0.75 | 0.00% |
| Islands | - | - | 40.05 | 40.05 | - | - | 11.10 | 11.10 | 51.15 | 0.02% |
| Total | 167,707.88 | 22,962.15 | 993.53 | 191,663.56 | 5,780 | 41,997.42 | 36,470.64 | 78,468.06 | 275,911.62 | 100.00% |
Demand
- Demand trends
During the fiscal year 2015-16, the electricity generated in utility sector is 1,090.851 billion KWh with a short fall of requirement by 23.557 billion KWh (-2.1%) against the 2.2% deficit anticipated. The peak load met was 148,463 MW with a short fall of requirement by 4,903 MW (-3.3%) against the 2.7% deficit anticipated. In LGBR 2016 report, India's Central Electricity Authority anticipated for the 2016–17 fiscal year, a base load energy surplus and peaking surplus to be 1.1% and 2.6% respectively.[38] Though few regions are expected to face energy shortage, power would be made available adequately from the surplus regions with the higher capacity inter regional transmission links.[39] By the end of calendar year 2015, India has become power surplus country despite lower power tariffs.[8][9][40][41]
| Region | Energy | Peak Power | ||||
|---|---|---|---|---|---|---|
| Requirement (MU) | Availability (MU) | Surplus(+)/Deficit(-) | Demand (MW) | Supply (MW) | Surplus(+)/Deficit(-) | |
| Northern | 357,459 | 351,009 | -1.8% | 55,800 | 54,900 | -1.6% |
| Western | 379,087 | 405,370 | +6.9% | 51,436 | 56,715 | +10.3% |
| Southern | 310,564 | 320,944 | +3.3% | 40,145 | 44,604 | +11.1% |
| Eastern | 151,336 | 135,713 | -10.3 % | 21,387 | 22,440 | +4.9% |
| North-Eastern | 16,197 | 14,858 | -8.3% | 2,801 | 2,695 | -3.8% |
| All India | 1,214,642 | 1,227,895 | +1.1% | 164,377 | 169,403 | +2.6% |
- Demand drivers
Of the 1.4 billion people in the world who have no access to electricity, India accounts for over 300 million. The International Energy Agency estimates India will add between 600 GW to 1,200 GW of additional new power generation capacity before 2050.[42] This added new capacity is equivalent to the 740 GW of total power generation capacity of European Union (EU-27) in 2005. The technologies and fuel sources India adopts, as it adds this electricity generation capacity, may make significant impact to global resource usage and environmental issues.[43]
Some 800 million Indians use traditional fuels – fuelwood, agricultural waste and biomass cakes – for cooking and general heating needs. These traditional fuels are burnt in cook stoves, known as chulah or chulha in some parts of India.[44] Traditional fuel is inefficient source of energy, its burning releases high levels of smoke, PM10 particulate matter, NOX, SOX, PAHs, polyaromatics, formaldehyde, carbon monoxide and other air pollutants.[45][46][47] Some reports, including one by the World Health Organisation, claim 300,000 to 400,000 people in India die of indoor air pollution and carbon monoxide poisoning every year because of biomass burning and use of chullahs.[48] Traditional fuel burning in conventional cook stoves releases unnecessarily large amounts of pollutants, between 5 and 15 times higher than industrial combustion of coal, thereby affecting outdoor air quality, haze and smog, chronic health problems, damage to forests, ecosystems and global climate. Burning of biomass and firewood will not stop, these reports claim, unless electricity or clean burning fuel and combustion technologies become reliably available and widely adopted in rural and urban India. The growth of electricity sector in India may help find a sustainable alternative to traditional fuel burning.
In addition to air pollution problems, a 2007 study finds that discharge of untreated sewage is single most important cause for pollution of surface and ground water in India. There is a large gap between generation and treatment of domestic wastewater in India. The problem is not only that India lacks sufficient treatment capacity but also that the sewage treatment plants that exist do not operate and are not maintained. Majority of the government-owned sewage treatment plants remain closed most of the time in part because of the lack of reliable electricity supply to operate the plants. The wastewater generated in these areas normally percolates in the soil or evaporates. The uncollected wastes accumulate in the urban areas cause unhygienic conditions, release heavy metals and pollutants that leaches to surface and groundwater.[49][50] Almost all rivers, lakes and water bodies are severely polluted in India. Water pollution also adversely impacts river, wetland and ocean life. Reliable generation and supply of electricity is essential for addressing India's water pollution and associated environmental issues.
Other drivers for India's electricity sector are its rapidly growing economy, rising exports, improving infrastructure and increasing household incomes.
| Fiscal year ending on |
Consumption (GWh) |
% of Total | Per-Capita Generation (in kWh) | |||||
|---|---|---|---|---|---|---|---|---|
| Domestic | Commercial | Industrial | Traction | Agriculture | Misc | |||
| 31-Dec-1947 | 4,182 | 10.11% | 4.26% | 70.78% | 6.62% | 2.99% | 5.24% | 16.3 |
| 31-Dec-1950 | 5,610 | 9.36% | 5.51% | 72.32% | 5.49% | 2.89% | 4.44% | 18.2 |
| 31-Mar-1956 | 10,150 | 9.20% | 5.38% | 74.03% | 3.99% | 3.11% | 4.29% | 30.9 |
| 31-Mar-1961 | 16,804 | 8.88% | 5.05% | 74.67% | 2.70% | 4.96% | 3.75% | 45.9 |
| 31-Mar-1966 | 30,455 | 7.73% | 5.42% | 74.19% | 3.47% | 6.21% | 2.97% | 73.9 |
| 31-Mar-1974 | 55,557 | 8.36% | 5.38% | 68.02% | 2.76% | 11.36% | 4.13% | 126.2 |
| 31-Mar-1979 | 84,005 | 9.02% | 5.15% | 64.81% | 2.60% | 14.32% | 4.10% | 171.6 |
| 31-Mar-1985 | 124,569 | 12.45% | 5.57% | 59.02% | 2.31% | 16.83% | 3.83% | 228.7 |
| 31-Mar-1990 | 195,098 | 15.16% | 4.89% | 51.45% | 2.09% | 22.58% | 3.83% | 329.2 |
| 31-Mar-1997 | 315,294 | 17.53% | 5.56% | 44.17% | 2.09% | 26.65% | 4.01% | 464.6 |
| 31-Mar-2002 | 374,670 | 21.27% | 6.44% | 42.57% | 2.16% | 21.80% | 5.75% | 671.9 |
| 31-Mar-2007 | 525,672 | 21.12% | 7.65% | 45.89% | 2.05% | 18.84% | 4.45% | 559.2 |
| 31-March-2012 | 785,194 | 22.00% | 8.00% | 45.00% | 2.00% | 18.00% | 5.00% | 883.6 |
| 31-March-2013 | 824,301 | 22.29% | 8.83% | 44.40% | 1.71% | 17.89% | 4.88% | 914.4 |
| 31-March-2014 | 881,562 | 22.95% | 8.80% | 43.17% | 1.75% | 18.19% | 5.14% | 957 |
| 31-March-2015 | 938,823 | 23.53% | 8.77% | 42.10% | 1.79% | 18.45% | 5.37% | 1010.0Provisional |
The per capita annual domestic electricity consumption in India during the year 2009 was 96 kWh in rural areas and 288 kWh in urban areas for those with access to electricity in contrast to the worldwide per capita annual average of 2,600 kWh and 6,200 kWh in the European Union.[52]
Rural electrification
As of 31 July 2016, 98.46% of 597,464 villages in India are electrified.[53] Of those who did have access to electricity in rural India, the supply was intermittent and unreliable.[23]
| Rural electrification rate | State/UT (Electrification rate, Unelectrified villages)[54] |
|---|---|
| 100% | 20 states and 6 union territories |
| 99.00-99.99% | Himachal Pradesh (99.81%, 34), Uttar Pradesh (99.77%, 224), Uttarakhand (99.52%, 76), Rajasthan (99.26%, 332), Madhya Pradesh (99.51%, 258), Karnataka (99.86%, 39), West Bengal (99.96%, 14) |
| 95.00-98.99% | Jammu & Kashmir (98.31%, 107), Tripura (98.03%, 17), Bihar (97.46%, 993), Chattisgarh (96.55%, 675), Odisha (95.33%, 2210) |
| 90.00-94.99% | Jharkhand (93.98%, 1775), Assam (92.31%, 1950), Manipur (91.55%, 201), Mizoram (94.03%, 42), Nagaland (94.14%, 82) |
| 80.00-89.99% | Meghalaya (85.9%, 42), Andaman & Nicobar Islands (86.11%) |
| Below 80% | Arunachal Pradesh (73.3%, 1404) |
India's Ministry of Power launched Deen Dayal Upadhyaya Gram Jyoti Yojana (DDUGJY) as one of its flagship programme in July 2015 with the objective of providing round the clock power to the rural areas . It focuses on reforms in rural power sector by separation of feeder lines (rural households & agricultural) and strengthening of transmission and distribution infrastructure.The earlier scheme for rural electrification viz. Rajiv Gandhi Grameen Vidyutikaran Yojana (RGGVY) has been subsumed in the new scheme as its rural electrification component.[55]
Electricity consumption


| State/Union Territory | Region | Per-Capita Consumption (kWh) |
|---|---|---|
| Dadra & Nagar Haveli | Western | 13,769 |
| Daman & Diu | Western | 6,960 |
| Goa | Western | 1,803 |
| Gujarat | Western | 2,105 |
| Chhattisgarh | Western | 1,719 |
| Maharashtra | Western | 1,257 |
| Madhya Pradesh | Western | 813 |
| Western Region | ||
| Puducherry | Southern | 1,655 |
| Tamil Nadu | Southern | 1,616 |
| Andhra Pradesh[57] | Southern | 1,040 |
| Telangana | Southern | 1,356 |
| Karnataka | Southern | 1,211 |
| Kerala | Southern | 672 |
| Lakshadweep | Southern | 657 |
| Southern Region | ||
| Punjab | Northern | 1,858 |
| Haryana | Northern | 1,909 |
| Delhi | Northern | 1,561 |
| Himachal Pradesh | Northern | 1,336 |
| Uttarakhand | Northern | 1,358 |
| Chandigarh | Northern | 1,052 |
| Jammu & Kashmir | Northern | 1,169 |
| Rajasthan | Northern | 1,123 |
| Uttar Pradesh | Northern | 502 |
| Northern Region | ||
| Odisha | Eastern | 1,419 |
| Sikkim | Eastern | 685 |
| Jharkhand | Eastern | 835 |
| West Bengal | Eastern | 647 |
| Andaman & Nicobar Islands | Eastern | 361 |
| Bihar | Eastern | 203 |
| Eastern Region | ||
| Arunachal Pradesh | North Eastern | 525 |
| Meghalaya | North Eastern | 704 |
| Mizoram | North Eastern | 449 |
| Nagaland | North Eastern | 311 |
| Tripura | North Eastern | 303 |
| Assam | North Eastern | 314 |
| Manipur | North Eastern | 295 |
| North Eastern Region | ||
| National | 1,010 |
Note: Per Capita Consumption=(Gross Electricity Generation + Net Import) / Mid Year Population.
Electricity generation

India's electricity generation from 1950 to 1985 were very low when compared to developed nations. Since 1990, India has recorded faster growth in electricity generation. India's electricity generation has increased from 179 TW-hr in 1985 to 1,057 TW-hr in 2012.[5] Power generation by coal fired plants and non conventional renewal energy sources (RES) has mainly contributed to the growth in the total electricity generation whereas the contribution from natural gas, oil and hydro plants has decreased in last four years (2012-2016). The gross utility electricity generation target (excluding RES and imports from Bhutan) is 1,173 billion kWh during the year 2016-17 against the corresponding actual generation of 1,102 billion Kwh during the year 2015-16 with 6.41% annual growth target.[58][59] The CEA generation data is nearly 5% more than the NLDC data.
| Year | Fossil Fuel | Nuclear | Hydro | Sub total |
RES | Utility and Captive Power | ||||||||||
|---|---|---|---|---|---|---|---|---|---|---|---|---|---|---|---|---|
| Coal | Oil | Gas | Mini hydro |
Solar | Wind | Bio mass |
Other | Sub total |
Utility | Captive | Misc | Total | ||||
| 2014-15 | 835,838 | 1,407 | 41,075 | 36,102 | 129,244 | 1,043,666 | na | na | 28,214 | na | na | 61,780 | 1,105,446 | 166,426 | na | 1,271,872 |
| 2013-14 | 746,087 | 1,868 | 44,522 | 34,228 | 134,847 | 961,552 | na | na | na | na | na | 59,615 | 1,021,167 | 156,643 | na | 1,177,810 |
| 2012-13 | 691,341 | 2,449 | 66,664 | 32,866 | 113,720 | 907,040 | na | na | na | na | na | 57,449 | 964,489 | 144,009 | na | 1,108,498 |
| 2011-12 | 612,497 | 2,649 | 93,281 | 32,286 | 130,511 | 871,224 | na | na | na | na | na | 51,226 | 922,451 | 134,387 | na | 1,056,838 |
Notes: Coal includes lignite also; na → data not available;
The total generation from all renewable energy sources is nearly 15% of the total electricity generation (utility and captive) in India.
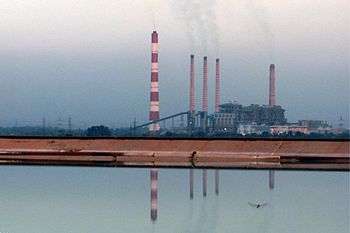
Thermal power

India's electricity sector consumes about 72% of the coal produced in the country.[60]
Pollution from thermal power plants
The high ash content in India's coal affects the thermal power plant's potential emissions.[61] Therefore, India's Ministry of Environment and Forests has mandated the use of beneficiated coals whose ash content has been reduced to 34% (or lower) in power plants in urban, ecologically sensitive and other critically polluted areas, and ecologically sensitive areas. Coal benefaction industry has rapidly grown in India, with current capacity topping 90 MT.
India has an extensive review process, one that includes environment impact assessment, prior to a thermal power plant being approved for construction and commissioning. The Ministry of Environment and Forests has published a technical guidance manual to help project proposers and to prevent environmental pollution in India from thermal power plants.[62] The operating coal fired power stations need to invest nearly INR 12.5 millions per MW capacity for installing pollution control equipment to comply with the latest emission norms notified by the Ministry of Environment and Forests in the year 2016.[63][64]
Coal supply constraints
.png)
A large part of Indian coal reserve is similar to Gondwana coal. It is of low calorific value and high ash content. The carbon content is low in India's coal, and toxic trace element concentrations are negligible. The natural fuel value of Indian coal is poor. On average, the Indian power plants using India's coal supply consume about 0.7 kg of coal to generate a kWh, whereas United States thermal power plants consume about 0.45 kg of coal per kWh. This is because of the difference in the quality of the coal, as measured by the Gross Calorific Value (GCV). On average, Indian coal has a GCV of about 4500 Kcal/kg, whereas the quality elsewhere in the world is much better; for example, in Australia, the GCV is 6500 Kcal/kg approximately.[66] India imported nearly 95 Mtoe of steam coal and coking coal which is 29% of total consumption to meet the demand in electricity, cement and steel production.[67] China has banned import of high ash coal, high sulphur coal and contaminated coal with trace metals which are causing air pollution.[68]
The state and central power generation companies are permitted by Government of India with flexible coal linkage swaps from inefficient plants to efficient plants and from plants situated away from coal mines to pit head to minimize cost of coal transportation thus leading to reduction in cost of power [69]
Natural gas supply constraints
The installed capacity of natural gas-based power plants and the ready to be commissioned with the commencement of natural gas supply is nearly 26,765 MW at the end of financial year 2014-15. These base load power plants are operating at overall PLF of 25% only due to severe shortage of Natural gas in the country.[70] Imported LNG was too costly for the power generation. Many of these power stations are shut down throughout the year for lack of natural gas supply. Natural gas shortage for power sector alone is nearly 100 MMSCMD.[71] The break even price for switching from imported coal to LNG in electricity generation is estimated near 6 US$/mmBtu.[72] Indian government has taken steps to enhance the generation from the stranded gas based power plants for meeting peak load demand by waiving applicable import duties and taxes due to drastic fall in the LNG and crude oil international prices.[73]
During the year 2016, global LNG spot prices have been falling drastically below 6 US$/mmBtu due to excess production capacity.[74] Though LNG landed prices are competitive to the electricity generation from the imported coal, there is limitation to import LNG due to lack of adequate regasification capacity.[75] By the middle of 2016, LPG international spot prices have also fallen drastically due to LPG market glut.[76] This would facilitate use of LPG in place of Naphtha or diesel oil (23 kg of LPG is equal to one mmbtu) where the gas based power plants are not able to receive re-gasified LNG.[77] This is possible by injecting cheap imported LPG in to the natural gas supply pipelines up to the permitted hydrocarbon dew point.

Gasification of coal or lignite or biomass, produces syngas or coal gas or wood gas which is a mixture of hydrogen, carbon monoxide and carbon dioxide gases. Coal gas can be converted into synthetic natural gas by using Fischer–Tropsch process at low pressure and high temperature. Coal gas can also be produced by underground coal gasification where the coal deposits are located deep in the ground or uneconomical to mine the coal.[78] Synthetic natural gas production technologies have tremendous scope to meet the SNG requirements of gas-based power stations fully using the locally available coal (or imported coal in short run). Dankuni coal complex is producing syngas which is piped to the industrial users in Calcutta.[79] Many coal based fertiliser plants which are shut down can also be retrofitted economically to produce synthetic natural gas for bridging natural gas shortages. It is estimated that SNG production cost would be below 6 $ per mmBtu.[80][81] The indigenously produced natural gas by the Exploration & Production (E&P) contractors sold at prevailing international gas prices do not guarantee the natural gas supply whereas the SNG produced from coal/ biomass is reliable & dependable fuel supply to the gas based power stations and other natural gas consumers.
Replacement of old thermal power plants
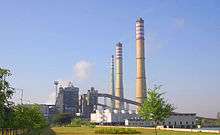
India's coal-fired, oil-fired and natural gas-fired thermal power plants are inefficient and offer significant potential for greenhouse gas (CO2) emission reduction through better technologies. India's thermal power plants emit 50% to 120% more CO2 per kWh produced when compared to the average emissions from their European Union (EU-27) counterparts.[82] The central government has firmed up plans to shut down 11,000 MW of thermal power generation capacity that are at least 25 years old and replace with bigger size plants of super-critical pressure technology totalling to at least 20,000 MW with for an estimated investment of ₹70,000 crore (US$10 billion).[83] As part of this plan around 100 old units of capacities ranging between 60 MW to 220 MW will be replaced by around 30 state-of-the-art super-critical units ranging between 660 MW to 800 MW, thus saving ₹40,000 crore (US$5.9 billion) on land acquisition as well infrastructure cost like rail and water linkages along with facilities like ash pond and power evacuation lines.
Recently few old diesel generator plants and gas turbine plants (Vatwa 100 MW) were also decommissioned. However their residual life can be used effectively for grid reserve service by keeping them in working condition and connected to grid.[84]
Renewable energy
India's renewable energy sector is amongst the world's most active players in renewable energy utilization, especially solar and wind electricity generation.[85] As of June 2016, India had grid connected installed capacity of about 42.85 GW non-conventional renewable technologies-based electricity capacity, about 14.15% of its total; exceeding the capacity of hydroelectric power for the first time in history.[86][87][88][89]

| Type | Capacity (in MW) | |
|---|---|---|
| Grid Connected Power | ||
| Wind | 26,866.66 | |
| Solar | 6,762.85 | |
| Small Hydro Power Projects | 4,273.47 | |
| Biomass Power & Gasification and Bagasse Cogeneration | 4,831.33 | |
| Waste to Power | 115.08 | |
| Total - Grid Connected Power | 42,849.38 | |
| Off-Grid/Captive Power | ||
| Biomass (non-bagasse) Cogeneration | 651.91 | |
| SPV Systems (>1 kW) | 313.88 | |
| Waste to Power | 160.16 | |
| Biomass Gasifiers | 182.39 | |
| Water Mills/Micro Hydro | 18.71 | |
| Aerogenerator/Hybrid Systems | 2.69 | |
| Total - Off-Grid/Captive Power | 1,329.74 | |
As of August 2011, India had deployed renewable energy to provide electricity in 8,846 remote villages, installed 4.4 million family biogas plants, 1,800 microhydroelectric units and 4.7 million square metres of solar water heating capacity. India plans to add about 30 GW of installed electricity generation capacity based on renewable energy technologies by 2017.[90]
Hydro power


The hydro-electric power plants at Darjeeling and Shivanasamudram were established in 1898 and 1902 respectively and were among the first in Asia.
India is endowed with economically exploitable and viable hydro potential assessed to be about 84,000 MW at 60% load factor. In addition, 6740 MW in terms of installed capacity from Small, Mini, and Micro Hydro schemes have been assessed. Also, 56 sites for pumped storage schemes with an aggregate installed capacity of 94,000 MW have been identified. It is the most widely used form of renewable energy. India is blessed with immense amount of hydro-electric potential and ranks 5th in terms of exploitable hydro-potential on global scenario.
The present installed capacity as of 31 May 2014 is approximately 40,661.41 MW which is 16.36% of total electricity generation in India.[91] The public sector has a predominant share of 97% in this sector.[92] National Hydroelectric Power Corporation (NHPC), Northeast Electric Power Company (NEEPCO), Satluj jal vidyut nigam (SJVNL), Tehri Hydro Development Corporation, NTPC-Hydro are a few public sector companies engaged in development of hydroelectric power in India.
Pumped storage schemes are perfect centralised peaking power stations for the load management in the electricity grid. Pumped storage schemes would be in high demand for meeting peak load demand and storing the surplus electricity as India graduates from electricity deficit to electricity surplus. They also produce secondary /seasonal power at no additional cost when rivers are flooding with excess water. Storing electricity by other alternative systems such as batteries, compressed air storage systems, etc. is more costlier than electricity production by standby generator. India has already established nearly 6800 MW pumped storage capacity which is part of its installed hydro power plants.[93]
Solar power

India is endowed with vast solar energy. The solar radiation of about 5,000 trillion kWh per year is incident over its land mass with average daily solar power potential of 0.25 kWh per m2 of used land area with the available commercially proven technologies.[95] As of 31 August 2016, the installed capacity was 8.1 GW. Solar installations in India is expected to reach 4.8 GW in 2016 with a 21 GW development pipeline.
Installation of solar power plants require nearly 2.4 hectares (0.024 km2) land per MW capacity which is similar to coal-fired power plants when life cycle coal mining, consumptive water storage & ash disposal areas are also accounted and hydro power plants when submergence area of water reservoir is also accounted. 1.33 million MW capacity solar plants can be installed in India on its 1% land (32,000 square km). There are vast tracts of land suitable for solar power in all parts of India exceeding 8% of its total area which are unproductive barren and devoid of vegetation.[96] Part of waste lands (32,000 square km) when installed with solar power plants can produce 2,000 billion Kwh of electricity (two times the total generation in the year 2013-14) with land annual productivity/yield of ₹1.0 million (US$15,000) per acre (at 4 Rs/kwh price) which is at par with many industrial areas and many times more than the best productive irrigated agriculture lands.[97] Moreover, these solar power units are not dependent on supply of any raw material and are self productive. There is unlimited scope for solar electricity to replace all fossil fuel energy requirements (natural gas, coal, lignite, nuclear fuels and crude oil) if all the marginally productive lands are occupied by solar power plants in future. The solar power potential of India can meet perennially to cater per capita energy consumption at par with USA/Japan for the peak population in its demographic transition.[98]
In the year 2016, the levelized tariff in US$ for solar electricity has fallen below 3 cents/kWh which is far cheaper than the fuel cost incurred by coal based power plants in India.[99][100]
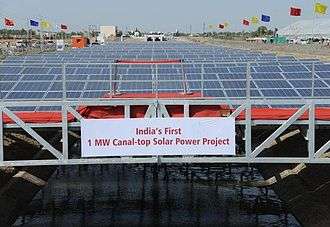
Land acquisition is a challenge to solar farm projects in India. Some state governments are exploring means to address land availability through innovation; for example, by exploring means to deploy solar capacity above their extensive irrigation canal projects, thereby harvesting solar energy while reducing the loss of irrigation water by solar evaporation.[101] The state of Gujarat was first to implement the Canal Solar Power Project, to use 19,000 km (12,000 mi) long network of Narmada canals across the state for setting up solar panels to generate electricity. It was the first ever such project in India.
Synergy with irrigation water pumping and hydro power stations
The major disadvantage of solar power (PV type) is that it can not produce electricity during the nighttime and cloudy daytime also. In India, this disadvantage can be overcome by installing pumped-storage hydroelectricity stations. Ultimate electricity requirement for river water pumping (excluding ground water pumping) is 570 billion Kwh to pump one cubic meter of water for each square meter area by 125 m height on average for irrigating 140 million hectares of net sown area (42% of total land) for three crops in a year.[102] This is achieved by utilising all the usable river waters by interlinking Indian rivers.[103] These river water pumping stations would also be envisaged with pumped-storage hydroelectricity features to generate electricity during the night time. These pumped-storage stations would work at 200% water pumping requirement during the daytime and generate electricity at 50% of total capacity during the nighttime. Also, all existing and future hydro power stations can be expanded with additional pumped-storage hydroelectricity units to cater night time electricity consumption. Most of the ground water pumping power can be met directly by solar power.[104]
Wind power
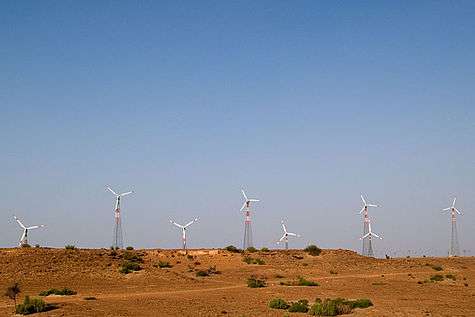


India has the fifth largest installed wind power capacity in the world. In the year 2015-16, wind power accounted for 8.5% of India's total installed power capacity, and 2.5% of the country's power output. India targets to install an additional 60 GW of wind power capacity by 2022[105]
The development of wind power in India began in the 1990s by Tamil Nadu Electric Board near Tuticorin, and has significantly increased in the last decade. As of 31 March 2016, the installed capacity of wind power was 26.74 GW, spread across many states of India.[88] The largest wind power generating state is Tamil Nadu accounting for nearly 30% of installed capacity, followed in decreasing order by Maharashtra, Gujarat, Rajasthan and Karnataka.[106]
Biomass power
Biomass is organic matter derived from living, or recently living organisms. As an energy source, biomass can either be used directly via combustion to produce heat, or indirectly after converting it to various forms of biofuel. Conversion of biomass to biofuel can be achieved by different methods which are broadly classified into: thermal, chemical, and biochemical methods.[107] In this system biomass, bagasse, forestry, domestic organic wastes, industrial organic wastes and agro residue & agricultural wastes are used as fuel to produce electricity.[108] Nearly 750 million tons of non edible (by cattle) biomass is available annually in India which can be put to use for higher value addition.[109] Biomass is a renewable energy source as it is generated by extracting the carbon dioxide gas from the atmosphere. Its use for electricity generation is carbon-neutral fuel because it would also release global warming green house gasses like methane and carbon dioxide when it is left to decay / degenerate without using as an energy source. The total biomass traditional use in India is nearly 177 Mtoe in the year 2013.[110]
Two thirds of house holds in India use biomass and charcoal for cooking purpose. As traditional use of biomass is being replaced by LPG in rural areas at faster pace, biomass burning in agriculture fields would become major source for causing higher level air pollution. According to the International Energy Agency, 819 million Indians, or 63% of the total population, rely on traditional uses of biomass.[111]
- Torrefied biomass
Huge quantity of imported coal is being used in pulverised coal-fired power stations. Raw biomass is not suitable for use in the pulverised coal mills as they are difficult to grind into fine powder due to its caking problem. However 100% biomass can be fired after Torrefaction in the pulverised coal mills for replacing imported coal.[112] Torrefied biomass plants can be integrated with existing pulverised coal-fired power stations using the available hot flue gas as heat source. Cofiring dry biomass up to 20% heat input with coal is possible directly in pulverised coal-fired power stations without facing caking problem.[113] North west and southern regions can replace imported coal use with biomass where surplus agriculture/crop residue biomass is burnt in the fields causing pollution problems.
- Biomass gasifier
India has been promoting biomass gasifier technologies in its rural areas, to utilise surplus biomass resources such as rice husk, crop stalks, small wood chips, other agro-residues. The goal was to produce electricity for villages with power plants of up to 2 MW capacities. During 2011, India installed 25 rice husk based gasifier systems for distributed power generation in 70 remote villages of Bihar. The largest biomass-based power plant in India is at Sirohi, Rajasthan, having the capacity of 20 MW, i.e., Sambhav Energy Limited. In addition, gasifier systems are being installed at 60 rice mills in India. During the year, biomass gasifier projects of 1.20 MW in Gujarat and 0.5 MW in Tamil Nadu were successfully installed.[90]
- Biogas
This pilot programme aims to install small-scale biogas plants for meeting the cooking energy needs in rural areas of India. During 2011, some 45000 small-scale biogas plants were installed. Cumulatively, India has installed 4.44 million small-scale biogas plants.
In 2011, India started a new initiative with the aim to demonstrate medium size mixed feed biogas-fertiliser pilot plants. This technology aims for generation, purification/enrichment, bottling and piped distribution of biogas. India approved 21 of these projects with aggregate capacity of 37016 cubic metre per day, of which 2 projects have been successfully commissioned by December 2011.[90]
India has additionally commissioned 158 projects under its Biogas based Distributed/Grid Power Generation programme, with a total installed capacity of about 2 MW.
India is rich in biomass and has a potential of 16,881 MW (agro-residues and plantations), 5000 MW (bagasse cogeneration) and 2700 MW (energy recovery from waste). Biomass power generation in India is an industry that attracts investments of over INR 6 billion every year, generating more than 5000 million units of electricity and yearly employment of more than 10 million man-days in the rural areas.
As of 2010, India burnt over 200 million tonnes of coal replacement worth of traditional biomass fuel every year to meet its energy need for cooking and other domestic use. This traditional biomass fuel – fuelwood, crop waste and animal dung – is a potential raw material for the application of biomass technologies for the recovery of cleaner fuel, fertilisers and electricity with significantly lower pollution.
Biomass available in India can and has been playing an important role as fuel for sugar mills, textiles, paper mills, and small and medium enterprises (SME). In particular there is a significant potential in breweries, textile mills, fertiliser plants, the paper and pulp industry, solvent extraction units, rice mills, petrochemical plants and other industries to harness biomass power.[114]
Geothermal energy
Geothermal energy is thermal energy generated and stored in the Earth. Thermal energy is the energy that determines the temperature of matter. India's geothermal energy installed capacity is experimental. Commercial use is insignificant.
According to some ambitious estimates, India has 10,600 MW of potential in the geothermal provinces but it still needs to be exploited.[115] India has potential resources to harvest geothermal energy. The resource map for India has been grouped into six geothermal provinces:[116]
- Himalayan Province – Tertiary Orogenic belt with Tertiary magmatism
- Areas of Faulted blocks – Aravalli belt, Naga-Lushi, West coast regions and Son-Narmada lineament.
- Volcanic arc – Andaman and Nicobar arc.
- Deep sedimentary basin of Tertiary age such as Cambay basin in Gujarat.
- Radioactive Province – Surajkund, Hazaribagh, Jharkhand.
- Cratonic province – Peninsular India
India has about 340 hot springs spread over the country. Of this, 62 are distributed along the northwest Himalaya, in the States of Jammu and Kashmir, Himachal Pradesh and Uttarakhand. They are found concentrated along a 30-50-km wide thermal band mostly along the river valleys. Naga-Lusai and West Coast Provinces manifest a series of thermal springs. Andaman and Nicobar arc is the only place in India where volcanic activity, a continuation of the Indonesian geothermal fields, and can be good potential sites for geothermal energy. Cambay graben geothermal belt is 200 km long and 50 km wide with Tertiary sediments. Thermal springs have been reported from the belt although they are not of very high temperature and discharge. During oil and gas drilling in this area, in recent times, high subsurface temperature and thermal fluid have been reported in deep drill wells in depth ranges of 1.7 to 1.9 km. Steam blowout have also been reported in the drill holes in depth range of 1.5 to 3.4 km. The thermal springs in India's peninsular region are more related to the faults, which allow down circulation of meteoric water to considerable depths. The circulating water acquires heat from the normal thermal gradient in the area, and depending upon local condition, emerges out at suitable localities. The area includes Aravalli range, Son-Narmada-Tapti lineament, Godavari and Mahanadi valleys and South Cratonic Belts.[116]
In a December 2011 report, India identified six most promising geothermal sites for the development of geothermal energy. These are, in decreasing order of potential:
- Tattapani in Chhattisgarh
- Puga in Jammu & Kashmir
- Cambay Graben in Gujarat
- Manikaran in Himachal Pradesh
- Surajkund in Jharkhand
- Chhumathang in Jammu & Kashmir
India plans to set up its first geothermal power plant, with 2–5 MW capacity at Puga in Jammu and Kashmir.[117]
Tidal power
Tidal power, also called tidal energy, is a form of hydropower that converts the energy obtained from tides into useful forms of power, mainly electricity. The potential of tidal wave energy becomes higher in certain regions by local effects such as shelving, funnelling, reflection and resonance.
India is surrounded by sea on three sides, its potential to harness tidal energy is significant. Energy can be extracted from tides in several ways. In one method, a reservoir is created behind a barrage and then tidal waters pass through turbines in the barrage to generate electricity. This method requires mean tidal differences greater than 4 metres and also favourable topographical conditions to keep installation costs low. One report claims the most attractive locations in India, for the barrage technology, are the Gulf of Khambhat and the Gulf of Kutch on India's west coast where the maximum tidal range is 11 m and 8 m with average tidal range of 6.77 m and 5.23 m respectively. The Ganges Delta in the Sunderbans, West Bengal is another possibility, although with significantly less recoverable energy; the maximum tidal range in Sunderbans is approximately 5 m with an average tidal range of 2.97 m. The report claims, barrage technology could harvest about 8 GW from tidal energy in India, mostly in Gujarat. The barrage approach has several disadvantages, one being the effect of any badly engineered barrage on the migratory fishes, marine ecosystem and aquatic life. Integrated barrage technology plants can be expensive to build.
In December 2011, the Ministry of New & Renewable Energy, Government of India and the Renewable Energy Development Agency of Govt. of West Bengal jointly approved and agreed to implement India's first 3.75 MW Durgaduani mini tidal power project. Indian government believes that tidal energy may be an attractive solution to meet the local energy demands of this remote delta region.[117]
Another tidal wave technology harvests energy from surface waves or from pressure fluctuations below the sea surface. A report from the Ocean Engineering Centre, Indian Institute of Technology, Madras estimates the annual wave energy potential along the Indian coast is between 5 MW to 15 MW per metre, suggesting a theoretical maximum potential for electricity harvesting from India's 7500 kilometre coast line may be about 40 GW. However, the realistic economical potential, the report claims, is likely to be considerably less.[118] A significant barrier to surface energy harvesting is the interference of its equipment to fishing and other sea bound vessels, particularly in unsettled weather. India built its first seas surface energy harvesting technology demonstration plant in Vizhinjam, near Thiruruvananthpuram.
The third approach to harvesting tidal energy consists of ocean thermal energy technology. This approach tries to harvest the solar energy trapped in ocean waters into usable energy. Oceans have a thermal gradient, the surface being much warmer than deeper levels of ocean. This thermal gradient may be harvested using modified Rankine cycle. India's National Institute of Ocean Technology (NIOT) attempted this approach over the last 20 years, but without success. In 2003, with Saga University of Japan, NIOT attempted to build and deploy a 1 MW demonstration plant.[119] However, mechanical problems prevented success. After initial tests near Kerala, the unit was scheduled for redeployment and further development in the Lakshadweep Islands in 2005. The demonstration project's experience have limited follow-on efforts with ocean thermal energy technology in India.
Nuclear power
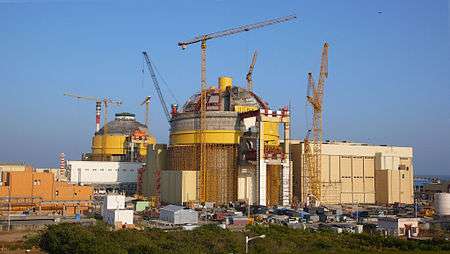
As of Apr 30, 2016, India had 5.78 GW of installed nuclear electricity generation capacity[86] or 1.91% of total installed electricity generation capacity in India. India's Nuclear plants generated 37,835 million units in year 2014-15.[120]
India's nuclear power plant development began in 1964. India signed an agreement with General Electric of the United States for the construction and commissioning of two boiling water reactors at Tarapur. In 1967, this effort was placed under India's Department of Atomic Energy. In 1971, India set up its first pressurized heavy water reactors with Canadian collaboration in Rajasthan. In 1987, India created Nuclear Power Corporation of India Limited to commercialize nuclear power.
Nuclear Power Corporation of India Limited is a public sector enterprise, wholly owned by the Government of India, under the administrative control of its Department of Atomic Energy. Its objective is to implement and operate nuclear power stations for India's electricity sector. The state-owned company has ambitious plans to establish 63 GW generation capacity by 2032, as a safe, environmentally benign and economically viable source of electrical energy to meet the increasing electricity needs of India.[121]
India's nuclear power generation effort satisfies many safeguards and oversights, such as getting ISO-14001 accreditation for environment management system and peer review by World Association of Nuclear Operators including a pre-start up peer review. Nuclear Power Corporation of India Limited admits, in its annual report for 2011, that its biggest challenge is to address the public and policy maker perceptions about the safety of nuclear power, particularly after the Fukushima incident in Japan.[120]
In 2011, India had 18 pressurized heavy water reactors in operation, with another four projects of 2.8 GW capacity launched. The country plans to implement fast breeder reactors, using plutonium based fuel. Plutonium is obtained by reprocessing spent fuel of first stage reactors. India is in the process of launching its first prototype fast breeder reactor of 500 MW capacity in Tamil Nadu.
India has nuclear power plants operating in the following states: Maharashtra, Gujarat, Rajasthan, Uttar Pradesh, Tamil Nadu and Karnataka. These reactors have an installed electricity generation capacity between 100 MW and 540 MW each. KKNPP Unit-1 with a capacity of 1,000 MWe was commissioned in July, 2013 while KKNPP Unit-2, also with a capacity of 1,000 MWe is nearing first approach to criticality in 2016.
In 2011, The Wall Street Journal reported the discovery of uranium in a new mine in India, the country's largest ever. The estimated reserves of 64,000 tonnes, could be as large as 150,000 tonnes (making the mine one of the world's largest). The new mine is expected to provide India with a fuel that it now imports. Nuclear fuel supply constraints had limited India's ability to grow its nuclear power generation capacity. The newly discovered ore, unlike those in Australia, is of slightly lower grade. This mine is expected to be in operation in 2012.[122]
India's share of nuclear power plant generation capacity is just 1.2% of worldwide nuclear power production capacity, making it the 15th largest nuclear power producer. India aims to supply 9% of it electricity needs with nuclear power by 2032.[120] India's largest nuclear power plant project is planned to be implementedat Jaitapur, Maharashtra in partnership with Areva, France.
India's government is also developing up to 62, mostly thorium reactors, which it expects to be operational by 2025. It is the "only country in the world with a detailed, funded, government-approved plan" to focus on thorium-based nuclear power. The country currently gets under 2% of its electricity from nuclear power, with the rest coming from coal (60%), hydroelectricity (16%), other renewable sources (12%) and natural gas (9%). It expects to produce around 25% of its electricity from nuclear power.[123]
Electricity transmission and distribution

| Capacity | Substations [124] (MVA) | Transmission lines [125] (c.km) | c.km / MVA ratio[126] |
|---|---|---|---|
| ± 500 kV HVDC | 13,500 | 9,432 | 0.699 |
| 765 kV | 121,500 | 18,644 | 0.153 |
| 400 kV | 192,422 | 135,949 | 0.707 |
| 200 kV | 268,678 | 149,412 | 0.556 |
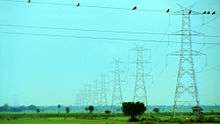
As of 2013, India has a single wide area synchronous grid that covers the country.[127][128]
The spread of high voltage transmission lines is such that it can form a square matrix of area 416 km2 (i.e. on average, at least one HV line within 10.2 km distance/vicinity) in entire area of the country. The length of high-voltage transmission lines is nearly equal to that of the United States (322,000 km (200,000 mi) of 230 kV and above) but transmits far less electricity.[129] The HV transmission lines (132 kV and above) installed in the country is nearly 700,000 km (430,000 mi) (i.e. on average, at least one ≥13 kV transmission line within 4.5 km distance).[130] The length of transmission lines (400 V and above and excluding 220 V lines) is 10,558,177 km (6,560,547 mi) as on 31 March 2015 in the country.[3] The spread of total transmission lines (≥400 V) is such that it can form a square matrix of area 36.8 km2 (i.e. on average, at least one transmission line within 3 km distance) in entire area of the country.
The all-time maximum peak load is not exceeding 153,515 MW in the unified grid whereas the all-time peak load met is 148,005 MW on 11 September 2015.[131] The maximum achieved demand factor of substations is not exceeding 60% at 200 kV level. The operational performance of the huge capacity substations and the vast network of high voltage transmission lines with low demand factor is not satisfactory in meeting the peak electricity load.[132] Detailed forensic engineering studies are to be undertaken and system inadequacies rectified to evolve into smart grid for maximising utility of the existing transmission infrastructure with optimum future capital investments.[35]
The July 2012 blackout, affecting the north of the country, was the largest power grid failure in history by number of people affected. The introduction of Availability Based Tariff (ABT) has brought about stability to a great extent in the Indian transmission grids. However, presently it is becoming outdated in a power surplus grid.
India's Aggregate Transmission and Commercial (ATC) losses is 27% in 2011-12.[133][134] Whereas the total ATC loss was only 9.43% out of the 4,113 billion kWh electricity supplied in USA during the year 2013. The Government has pegged the national ATC losses at around 24% for the year 2011 & has set a target of reducing them to 17.1% by 2017 & to 14.1% by 2022. A high proportion of non-technical losses are caused by illegal tapping of lines, and faulty electric meters that underestimate actual consumption also contribute to reduced payment collection. A case study in Kerala estimated that replacing faulty meters could reduce distribution losses from 34% to 29%.[42]
Regulation and administration
The Ministry of Power is India's apex central government body regulating the electrical energy sector in India. This ministry was created on 2 July 1992. It is responsible for planning, policy formulation, processing of projects for investment decisions, monitoring project implementation, training and manpower development, and the administration and enactment of legislation in regard to thermal, hydro power generation, transmission and distribution. It is also responsible for the administration of India's Electricity Act (2003), the Energy Conservation Act (2001) and to undertake such amendments to these Acts, as and when necessary, in conformity with the Indian government's policy objectives.[135]
Electricity is a concurrent list subject at Entry 38 in List III of the seventh Schedule of the Constitution of India. In India's federal governance structure, this means that both the central government and India's state governments are involved in establishing policy and laws for its electricity sector. This principle motivates central government of India and individual state governments to enter into memorandum of understanding to help expedite projects and reform electricity sector in respective state.[136]
Trading
Bulk power purchasers can buy electricity on daily basis for short, medium and long term duration from reverse e-auction facility.[137] The electricity prices transacted under reverse e-auction facility are far less than the prices agreed under bilateral agreements.[138] Multi Commodity Exchange has sought permission to offer electricity future markets in India.[139]
Government-owned power companies
India's Ministry of Power administers central government owned companies involved in the generation of electricity in India. These include National Thermal Power Corporation, Damodar Valley Corporation, National Hydroelectric Power Corporation and Nuclear Power Corporation of India. The Power Grid Corporation of India is also administered by the Ministry; it is responsible for the inter-state transmission of electricity and the development of national grid.
The Ministry works with various state governments in matters related to state government owned corporations in India's electricity sector. Examples of state corporations include Telangana Power Generation Corporation, Andhra Pradesh Power Generation Corporation Limited, Assam Power Generation Corporation Limited, Tamil Nadu Electricity Board, Maharashtra State Electricity Board, Kerala State Electricity Board, and Gujarat Urja Vikas Nigam Limited.
Funding of power infrastructure
India's Ministry of Power administers Rural Electrification Corporation Limited and Power Finance Corporation Limited. These central government owned public sector enterprises provide loans and guarantees for public and private electricity sector infrastructure projects in India.
Borrowing by state owned discoms

- The accumulated losses of state-owned discoms (without subsidies) rose from Rs 11,699 crore in 2004-05 to Rs 71,271 crore in 2013-14. These losses have resulted in state discoms relying more on short-term loans to fund their operations. Borrowings by state discoms rose from Rs 1,58,003 crore in 2007-08 to Rs 5,45,922 crore in 2013-14 (CAGR 23%).
- Consequently, the interest cost on these loans worsens the poor finances of state discoms. Poor finances of the discoms affect their ability to buy power, thus leading to power deficits.
Budgetary support
After the enactment of Electricity Act 2003 budgetary support to power sector is negligible.[140] State Electricity Boards get initial financial help from Central Government in the event of their unbundling.
Human resource development
Rapid growth of electricity sector in India demands that talent and trained personnel become available as India's new installed capacity adds new jobs. India has initiated the process to rapidly expand energy education in the country, to enable the existing educational institutions to introduce courses related to energy capacity addition, production, operations and maintenance, in their regular curriculum. This initiative includes conventional and renewal energy.
A Ministry of Renewal and New Energy announcement claims State Renewable Energy Agencies are being supported to organise short-term training programmes for installation, operation and maintenance and repair of renewable energy systems in such places where intensive RE programme are being implemented. Renewable Energy Chairs have been established in IIT Roorkee and IIT Kharagpur.[90] Central Training Institute Jabalpur is a primer Power Distribution Engineering and Management training Institute.
Education and availability of skilled workers is expected to be a key challenge in India's effort to rapidly expand its electricity sector.
Problems with India's power sector
India's electricity sector faces many issues. Some are:[47][141][142][143]
- Inadequate last mile connectivity is the main problem to supply electricity for all users. The country already has adequate generation and transmission capacity to meet the full demand temporally and spatially.[3] However, due to lack of last-mile link-up with all electricity consumers and reliable power supply (to exceed 99%), many consumers depend on DG sets using costly diesel oil for meeting unavoidable power requirements.[35] Also more than 10 million households are using battery storage UPS as back-up in case of load shedding.[144] India imports nearly US$2 billion worth of battery storage UPS every year.[145] The distribution companies should focus on providing uninterrupted power supply to all the consumers who are using costly DG set's power. This should be achieved by laying separate buried power cables (not to be effected by rain and winds) for emergency power supply in addition to the normal supply lines. Emergency supply power line shall supply power when the normal power supply line is not working. Emergency power supply would be charged at higher price without any subsidy but less than the generation cost from diesel oil. Nearly 80 billion KWh electricity is generated annually in India by DG sets which are consuming nearly 15 million tons of diesel oil.
- Demand build up measures can be initiated to consume the cheaper electricity (average price Rs 2.5 per kWhr) available from the grid instead of running the coal/gas/oil fired captive power plants in various electricity intensive industries.[146][147] The captive power generation capacity by coal/gas/oil fired plants is nearly 47,000 MW mainly established in steel, fertiliser, aluminium, cement, etc. industries.[3] These bulk captive electricity producers can draw cheaper electricity from the grid on short term open access (STOA) basis and avoid the costly imported coal/RLNG/natural gas or utilise these fuels for process purposes instead of electricity generation.[148][149] Some of these idling captive power plants can be used for grid reserve service for earning extra revenue.[150] At present substantial diesel oil is consumed by railways for rail traffic on its non electrified rail lines. To eliminate the substantial cost of imported diesel fuel, power ministry is envisaging to fund the electrification of these lines and achieve additional power demand of 7 billion units.[151]
- No access to electricity: Over 300 million people in India or 60 million households have no access to electricity.[23] Of those who do, almost all find electricity supply intermittent and unreliable.[152] However, many of the power stations are idling for lack of electricity demand. The idling generation capacity can supply three times the domestic electricity needs (nearly 80 billion KWh) of the people who do not have access to electricity.
- A system of cross-subsidization is practiced based on the principle of 'the consumer's ability to pay'. In general, the industrial and commercial consumers subsidize the domestic and agricultural consumers.[153][154] Further, Government giveaways such as free electricity for farmers, partly to curry political favor, have depleted the cash reserves of state-run electricity-distribution system and led them to amassing a debt of ₹2.5 trillion (US$37 billion).[155] This has financially crippled the distribution network, and its ability to pay for purchasing power to meet the demand in the absence of subsidy reimbursement from state governments.[156] This situation has been worsened by state government departments that do not pay their electricity bills.
- Name plate/declared capacity of the many coal fired plants owned by IPPs are overrated above the actual maximum continuous rating (MCR) capacity.[157] The reason for overrating the capacity is to over-invoice the plant cost.[158] These plants operate 15 to 10% below their declared capacity on daily basis and operate rarely at declared capacity. Thus these units are not effectively contributing to the on line spinning reserves to maintain power system / grid stabilization. This is also due to reason that point of connection charges are levied in India based on energy exported instead of MCR capacity as applicable for national grid in UK.
- Intra day load and demand graphs are not made in India at every 15 minutes or less intervals to understand power grid nature and its short comings with respect to grid frequency. These graphs should be plotted with comprehensive data collected from SCADA / on line for all grid connected generating stations (≥ 100 KW) and load data from all substations to impart authenticity to the data presented.[159] Comprehensive list of grid connected power stations along with declared capacity shall be prepared by CEA/POSOCO for all types of power plants (including wind, solar, biomass, co-generation, etc.) and update the data on weekly basis.
- Coal supply: Despite abundant reserves of coal, the country isn't producing enough to feed its power plants. India's monopoly coal producer, state-controlled Coal India, is constrained by primitive mining techniques and is rife with theft and corruption. Poor coal transport infrastructure has worsened these problems. To expand its coal production capacity, Coal India needs to mine new deposits. However, most of India's coal lies under protected forests or designated tribal lands. Any mining activity or land acquisition for infrastructure in these coal-rich areas of India, has been rife with political demonstrations, social activism and public interest litigations. By the end of year 2015, the international coal prices have dropped to US$42.55 per ton which is below the local coal producers sale price. This situation is transforming coastal power station's generation cheaper than pit head power station's generation when electricity is made available to major load centers.[18] Being massive consumer of local and imported coal, India should end the Coal India's coal pricing monopoly and implement coal trading in commodities stock exchange to arrive at market determined coal price on daily basis.[160] This is possible by devising standard coal grades / trading instruments and identifying coal supply hubs in central India, eastern India, west coast and east coast to facilitate trading in imported and local coal.[19]
- Poor pipeline connectivity and infrastructure to harness India's abundant coal bed methane and natural gas potential. The giant new offshore natural gas field has delivered far less gas than claimed causing shortage of natural gas.
- Average transmission, distribution and consumer-level losses exceeding 30% which includes auxiliary power consumption of thermal power stations, fictitious electricity generation by wind generators & independent power producers (IPPs), etc.
- The residential building sector is one of the largest consumers of electricity in India. Continuous urbanization and the growth of population result in increasing power consumption in buildings. Thus, while experts express the huge potential for energy conservation in this sector, the belief still predominates among stakeholders that energy-efficient buildings are more expensive than conventional buildings, which adversely affects the “greening” of the building sector.[161]
- Key implementation challenges for India's electricity sector include new project management and execution, ensuring availability of fuel quantities and qualities, lack of initiative to develop large coal and natural gas resources available in India, land acquisition, environmental clearances at state and central government level, and training of skilled manpower to prevent talent shortages for operating latest technology plants.[162]
- Hydroelectric power projects in India's mountainous north and north east regions have been slowed down by ecological, environmental and rehabilitation controversies, coupled with public interest litigations.
- Theft of power: In India, financial loss due to theft of electricity may be around $16 billion yearly. Populist pro-free power measures also bleed the power companies. Some power companies continue to bleed and lead to bankruptcy due to one of these factors. This also lead to pay more by legal users. This creates a scenario where villages have huge cut of power and simultaneously availability of power in the grid with no purchase by DISCOMs.
- Losses in the connector systems/service connections leading to premature failure of capital equipments like transformers
- India's nuclear power generation potential has been stymied by political activism since the Fukushima disaster. The track record of executing nuclear power plants is also very poor in India[163]
- Lack of clean and reliable energy sources such as electricity is, in part, causing about 800 million people in India to continue using traditional biomass energy sources – namely fuel wood, agricultural waste and livestock dung – for cooking and other domestic needs.[44] Traditional fuel combustion is the primary source of indoor air pollution in India, causes between 300,000 and 400,000 deaths per year and other chronic health issues.
Foreign electricity trade
India's National Grid is synchronously interconnected to Bhutan, and asynchronously linked with Bangladesh and Nepal.[164] An interconnection with Myanmar,[165] and an undersea interconnection to Sri Lanka (India–Sri Lanka HVDC Interconnection) has also been proposed.
Despite low electricity per capita consumption in India, the country is going to achieve surplus electricity generation during the 12th plan (2012 to 2017) period provided its coal production and transport infrastructure is developed adequately.[166][167][168] India has been exporting electricity to Bangladesh and Nepal and importing excess electricity from Bhutan.[169][170] In 2015, Nepal imported 224.21 MW of electric power from India, and Bangladesh imported 500 MW.[171][172]
Bangladesh, Myanmar and Pakistan are producing substantial natural gas and using for electricity generation purpose. Bangladesh, Myanmar and Pakistan produce 55 million cubic metres per day (mcmd), 9 mcmd and 118 mcmd out of which 20 mcmd, 1.4 mcmd and 34 mcmd are consumed for electricity generation respectively.[173][174] Whereas the natural gas production in India is not even adequate to meet its non-electricity requirements.
Bangladesh, Myanmar and Pakistan have proven reserves of 184 billion cubic metres (bcm), 283 bcm and 754 bcm respectively. There is ample opportunity for mutually beneficial trading in energy resources with these countries.[175] India can supply its surplus electricity to Pakistan and Bangladesh in return for the natural gas imports by gas pipe lines. Similarly India can develop on BOOT basis hydro power projects in Bhutan, Nepal and Myanmar. India can also enter into long term power purchase agreements with China for developing the hydro power potential in Brahmaputra river basin of Tibet region. India can also supply its surplus electricity to Sri Lanka by undersea cable link. There is ample trading synergy for India with its neighbouring countries in securing its energy requirements.[176]
Electricity as substitute to imported LPG and kerosene
The net import of liquefied petroleum gas (LPG) is 6.093 million tons and the domestic consumption is 13.568 million tons with Rs. 41,546 crores subsidy to the domestic consumers in the year 2012-13.[177] The LPG import content is nearly 40% of total consumption in India. The affordable electricity retail tariff (860 Kcal/Kwh at 90% heating efficiency) to replace LPG (lower heating value 11,000 Kcal/Kg at 75% heating efficiency) in domestic cooking is 6.47 Rs/Kwh when the retail price of LPG cylinder is Rs 1000 (without subsidy) with 14.2 kg LPG content. Replacing LPG consumption with electricity reduces its imports substantially.
The domestic consumption of kerosene is 7.349 million tons with Rs. 30,151 crores subsidy to the domestic consumers in the year 2012-13. The subsidised retail price of kerosene is 13.69 Rs/litre whereas the export/import price is 48.00 Rs/litre. The affordable electricity retail tariff (860 Kcal/Kwh at 90% heating efficiency) to replace kerosene (lower heating value 8240 Kcal/litre at 75% heating efficiency) in domestic cooking is 6.00 Rs/Kwh when Kerosene retail price is 48 Rs/litre (without subsidy).
In the year 2014-15, the plant load factor (PLF) of coal-fired thermal power stations is only 64.46% whereas these stations can run above 85% PLF comfortably provided there is adequate electricity demand in the country.[178] The additional electricity generation at 85% PLF is nearly 240 billion units which is adequate to replace all the LPG and kerosene consumption in domestic sector.[179] The incremental cost of generating additional electricity is only their coal fuel cost which is less than 3 Rs/Kwh. Enhancing the PLF of coal-fired stations and encouraging domestic electricity consumers to substitute electricity in place of LPG and kerosene in household cooking, would reduce the government subsidies and idle capacity of thermal power stations can be put to use economically. The domestic consumers who are willing to surrender the subsidised LPG/kerosene permits or eligible for subsidized LPG/kerosene permits, may be given free electricity connection and subsidised electricity tariff.[152]
During the year 2014, IPPs are offering to sell solar power below 5.50 Rs/Kwh to feed into the high voltage grid.[180][181] This price is close to affordable electricity tariff for the solar power to replace LPG and Kerosene use (after including subsidy on LPG & Kerosene) in domestic sector.
Electric vehicles
The retail prices of petrol and diesel are high in India to make electricity driven vehicles more economical as more and more electricity is generated from solar energy in near future without appreciable environmental effects. The retail price of diesel is 53.00 Rs/litre in the year 2012-13. The affordable electricity retail price (860 Kcal/Kwh at 75% input electricity to shaft power efficiency) to replace diesel (lower heating value 8572 Kcal/litre at 40% fuel energy to crank shaft power efficiency) is 9.97 Rs/Kwh. The retail price of petrol is 75.00 Rs/litre in the year 2012-13. The affordable electricity retail price (860 Kcal/Kwh at 75% input electricity to shaft power efficiency) to replace petrol (lower heating value 7693 Kcal/litre at 33% fuel energy to crank shaft power efficiency) is 19.06 Rs/Kwh. In the year 2012-13, India consumed 15.744 million tons petrol and 69.179 millon tons diesel which are mainly produced from imported crude oil at huge foreign exchange out go.[177]
Electricity driven vehicles would become popular in future when its energy storage/battery technology becomes more long lasting and maintenance free.[182][183] V2G is also feasible with electricity driven vehicles to contribute for catering the peak load in the electricity grid. Electricity driven vehicles can also be continuously charged with Wireless Electricity Transmission (WET) technology which transmits electricity over 5 km distance without wires to charge devices (mobile and stationary) between the range of 3-12 volts under any weather conditions.[184][185]
Energy reserves
According to Oil and Gas Journal, India had approximately 38 trillion cubic feet (Tcf) of proven natural gas reserves as of January 2011, world's 26th largest. United States Energy Information Administration estimates that India produced approximately 1.8 Tcf of natural gas in 2010, while consuming roughly 2.3 Tcf of natural gas. The electrical power and fertiliser sectors account for nearly three-quarters of natural gas consumption in India. Natural gas is expected to be an increasingly important component of energy consumption as the country pursues energy resource diversification and overall energy security.[186][187]
Until 2008, the majority of India's natural gas production came from the Mumbai High complex in the northwest part of the country. Recent discoveries in the Bay of Bengal have shifted the centre of gravity of Indian natural gas production.
The country already produces some coalbed methane and has major potential to expand this source of cleaner fuel. According to a 2011 Oil and Gas Journal report, India is estimated to have between 600 and 2000 Tcf of shale gas resources (one of the world's largest). Despite its natural resource potential, and an opportunity to create energy industry jobs, India has yet to hold a licensing round for its shale gas blocks. It is not even mentioned in India's central government energy infrastructure or electricity generation plan documents through 2025. The traditional natural gas reserves too have been very slow to develop in India because regulatory burdens and bureaucratic red tape severely limit the country's ability to harness its natural gas resources.[82][141][188]
Notes
See also
References
- ↑ "WEO - Energy access database". www.worldenergyoutlook.org. Retrieved 11 November 2016.
- ↑ "https://www.iea.org/statistics/statisticssearch/report/?year=2014&country=INDIA&product=Indicators". www.iea.org. Retrieved 14 November 2016. External link in
|title=(help) - 1 2 3 4 5 6 7 8 9 10 11 12 13 "Growth of Electricity Sector in India from 1947-2015" (PDF). CEA, India. Retrieved 13 June 2015.
- 1 2 3 4 5 6 "All India Installed Capacity of Utility Power Stations" (PDF). Retrieved 19 October 2016.
- 1 2 "BP Statistical Review of world energy, 2015" (PDF).
- ↑ "IBEF Power" (PDF). IBEF. Retrieved 28 October 2016.
- ↑ "Tariff & duty of electricity supply in India". report. CEA, Govt. of India. March 2014.
- 1 2 "Will try to keep power prices lower, says Piyush Goyal". Retrieved 13 January 2016.
- 1 2 "Dark future ahead? 11,000 mw thermal power capacity lying idle, largest outage is in the north". Retrieved 13 January 2016.
- ↑ "Investors may shun thermal projects for solar energy". Retrieved 21 March 2016.
- ↑ "All India power generation data, CEA report" (PDF).
- ↑ "International oil market watch".
- ↑ "Naphtha spot price".
- ↑ "Bunker fuel spot price".
- ↑ "Global LNG prices lose ground on weak demand". Retrieved 27 February 2016.
- ↑ "LNG looks poised to follow crude oil's plunge".
- ↑ "Peaking power generated from imported LNG at Rs 4.70 per unit". Retrieved 21 March 2016.
- 1 2 "Global coal price on down slide, no cheer for Indian power producers". Retrieved 13 December 2015.
- 1 2 "Govt asks Coal India to liquidate pithead stock".
- ↑ "Daily coal stock report at power stations".
- ↑ "India can achieve 1,650 billion units of electricity next year, Piyush Goyal". Retrieved 9 July 2016.
- ↑ "States resolve to provide 24x7 power to everyone by March 2019". Retrieved 18 June 2016.
- 1 2 3 "Government decides to electrify 5.98 crore unelectrified households by December 2018". Retrieved 20 June 2016.
- ↑ "Let there be light". The Telegraph. 26 April 2009.
- ↑ Electricity arrives in Mumbai
- ↑ "Archives Darjeeling Hydro Power System - IET history - The IET". Retrieved 29 July 2015.
- ↑ http://www.nyoooz.com/bangalore/118780/bengalurus-first-lamp-post-set-up-in-1905-stands-forgotten
- ↑ Daily News & Analysis (20 November 2011). "Relic of India's first electric railway to be dismantled". dna. Retrieved 29 July 2015.
- ↑ "Cochin International Airport set to become worlds's first fully solar powered major airport". LiveMint. Kochi, India. 18 August 2015.
- ↑ Menon, Supriya. "How is the world's first solar powered airport faring? - BBC News". Bbc.com. Retrieved 2016-12-01.
- 1 2 3 "One Nation-One Grid". Power Grid Corporation of India. Retrieved 2 December 2016.
- ↑ "Indian power system becomes largest operating synchronous grid in the world". The Times of India. Retrieved 2016-12-02.
- ↑ "Broad status of thermal power projects, page 16" (PDF). Central Electricity Authority. June 2016. Retrieved 3 August 2016.
- ↑ "Gensets add up to under half of installed power capacity; August, 2014". Retrieved 13 May 2015.
- 1 2 3 "Modification to existing transmission lines to double the capacity". Retrieved 9 June 2015.
- ↑ "The True Cost of Providing Energy to Telecom Towers in India" (PDF). Retrieved 29 August 2015.
- ↑ "Executive summary of month of July 2015" (PDF). Central Electricity Authority, Ministry of Power, Government of India. July 2015. Retrieved 15 Sep 2015.
- 1 2 "Load Generation Balance Report 2016-17" (PDF). Retrieved 2 June 2016.
- ↑ "India wont need extra power plants for next three years - Says government report". Retrieved 13 January 2016.
- ↑ "Is a distress sale on by private power producers?". Retrieved 21 July 2015.
- ↑ "Indian power plants find Rs1.2 trillion of capacity has no takers". Retrieved 29 June 2015.
- 1 2 Uwe Remme; et al. (February 2011). "Technology development prospects for the Indian power sector" (PDF). International Energy Agency France; OECD.
- ↑ "Analysis of the energy trends in the European Union & Asia to 2030" (PDF). Centre for Energy-Environment Resources Development, Thailand. January 2009.
- 1 2 The Partnership for Clean Indoor Air – Sierra Club. Pciaonline.org. Retrieved on 13 January 2012.
- ↑ Ganguly; et al. (2001). "INDOOR AIR POLLUTION IN INDIA – A MAJOR ENVIRONMENTAL AND PUBLIC HEALTH CONCERN" (PDF). Indian Council of Medical Research, New Delhi.
- ↑ "The Asian Brown Cloud: Climate and Other Environmental Impacts" (PDF). United Nations Environmental Programme. 2002.
- 1 2 "Indoor air pollution and household energy". WHO and UNEP. 2011.
- ↑ "Green stoves to replace chullahs". The Times of India. 3 December 2009.
- ↑ "Status of Sewage Treatment in India" (PDF). Central Pollution Control Board, Ministry of Environment & Forests, Govt of India. 2005.
- ↑ "Evaluation of Operation And Maintenance Of Sewage Treatment Plants in India-2007" (PDF). Central Pollution Control Board, Ministry of Environment & Forests. 2008.
- ↑ "Growth of Electricity Sector in India from 1947-2013" (PDF). Central Electricity Authority, Ministry of Power, Government of India. July 2013. Retrieved 20 February 2014.
- ↑ "World Energy Outlook 2011: Energy for All" (PDF). International Energy Agency. October 2011.
- ↑ "Progress report of village electrification as on 31-07-2016" (PDF). CEA.
- ↑ "Progress report of village electrification as on 31.03.2016" (PDF). CEA.
- ↑ http://pib.nic.in/newsite/PrintRelease.aspx?relid=123595
- ↑ "Rajya Sabha - Starred Question No. 897" (PDF). Ministry of Power, Govt. of India. Retrieved 2 February 2016.
- ↑ "Consumer wise real Time AP Power Supply Position". Retrieved 4 July 2016.
- ↑ "Electricity generation target for the year 2016-17" (PDF). Retrieved 4 April 2016.
- ↑ "Utility electricity generation during the year 2015-16" (PDF). Retrieved 4 April 2016.
- ↑ "Key World Energy Statistics" (PDF). International Energy Agency. International Energy Agency. 2013. Retrieved 18 June 2014.
- ↑ "Thermal power". Retrieved 13 March 2016.
- ↑ "TECHNICAL EIA GUIDANCE MANUAL FOR THERMAL POWER PLANTS" (PDF). Ministry of Environment and Forests, Government of India. 2009.
- ↑ "power tariffs may rise 70 paise per unit as to comply with new set of pollution control norms". Retrieved 22 February 2016.
- ↑ "Revised standards for Coal-based Thermal Power Plants". Retrieved 22 February 2016.
- ↑ "From Adani to Ambani, How Alleged Over Invoicing of Imported Coal has Increased Power Tariffs". Retrieved 6 April 2016.
- ↑ "Economics of Coal and Gas Based Energy". Third Wave Solutions. 2012.
- ↑ "Statistical Review of world energy 2014 workbook". Retrieved 17 June 2014.
- ↑ "China Bans Use of Coal With High Ash or Sulfur to Fight Smog". Retrieved 17 September 2014.
- ↑ "Cabinet nod for flexible domestic coal use to cut costs". Retrieved 5 May 2016.
- ↑ "Plant load factor for the gas based power stations, 2013-14, CEA report" (PDF). Retrieved 25 August 2014.
- ↑ "Growing India Becomes Major LNG Player". Retrieved 17 June 2015.
- ↑ "Page 71 of World LNG Report - 2015 Edition" (PDF). Retrieved 17 June 2015.
- ↑ "Imported LNG scheme ineffective for gas-based plants: India Ratings". Retrieved 17 June 2015.
- ↑ "Global LNG-Prices extend slump on thin demand". Retrieved 27 January 2016.
- ↑ "The US Drives Forward To Become A Player On The World LNG Market". Retrieved 1 July 2016.
- ↑ "Oil traders lose millions as LPG glut shocks market". Retrieved 20 July 2016.
- ↑ "Saudi Aramco LPG Prices". Retrieved 20 July 2016.
- ↑ "Chinese firm plans Thar coal mining in Pakistan". Retrieved 25 August 2014.
- ↑ "GAIL, Coal India in pact to expand Dankuni gas project". Retrieved 25 August 2014.
- ↑ "China's synthetic natural gas revolution" (PDF). Retrieved 2014-08-06.
- ↑ "Conversion of Coal to Substitute Natural Gas (SNG)" (PDF). Retrieved 2014-08-06.
- 1 2 "CO2 EMISSIONS FROM FUEL COMBUSTION HIGHLIGHTS, 2011 Edition" (PDF). International Energy Agency, France. 2011.
- ↑ "Government to pump in Rs 70,000 crore in replacing old thermal power plants". The Economic Times. 2015-09-16. Retrieved 2015-09-16.
- ↑ "Retirement of Brahmapuram and Kozhikode diesel power plants" (PDF). The Economic Times. Retrieved 6 May 2016.
- ↑ Winds of change come to country plagued by power blackouts. Guardian. 30 December 2008. Retrieved on 13 January 2012.
- 1 2 Chandrasekaran, Kaavya (30 April 2016). "Executive Summary Power Sector April 2016" (PDF). report. The Economic Times of India. Retrieved 10 June 2016.
- ↑ Chandrasekaran, Kaavya (10 June 2016). "Capacity for renewable energy in India hits 42,850 mw; surpasses capacity of hydel projects". news. The Economic Times of India. Retrieved 10 June 2016.
- 1 2 3 "Physical Progress (Achievements)". Ministry of New and Renewable Energy, Govt. of India. 31 January 2014. Retrieved 21 February 2014.
- ↑ "Power Generation from Various Renewable Energy Sources". Ministry of New and Renewable Energy. 9 December 2013. Retrieved 10 January 2014.
- 1 2 3 4 "Year End Review – 2011". Press Information Bureau, Government of India. December 2011.
- ↑ "Monthly All India Installed Generation Capacity Report" (PDF). Retrieved 23 May 2014.
- ↑ Hydropower Development in India: A Sector Assessment
- ↑ "Pumped storage hydro power plant" (PDF). Retrieved 2014-08-27.
- ↑ "landed solar module prices drop 15% in three months leads to glut". Retrieved 19 September 2016.
- ↑ "Solar". Ministry of New and Renewable Energy, Govt. of India. Retrieved 21 February 2014.
- ↑ "Waste lands atlas of India, 2011". Retrieved 30 May 2014.
- ↑ "This Gujarat village is harvesting a sunny crop". Retrieved 3 August 2016.
- ↑ "Population Pyramid of India". PopulationPyramid.net. Retrieved 29 July 2015.
- ↑ "Solar prices plunge to new lows as Dubai auction nets under 3c/kWh". Retrieved 9 May 2016.
- ↑ "NV Energy buys utility-scale solar at record low price under 4 cents/kWh". Retrieved 23 July 2015.
- ↑ "India's Building A Huge Floating Solar Farm - INDIAN POWER SECTOR". Retrieved 29 July 2015.
- ↑ "Central Water Commission". Retrieved 29 July 2015.
- ↑ National perspectives for water resources development (accessdate 13 July 2014)
- ↑ Brown, Lester R. (19 November 2013). "India's dangerous 'food bubble'". Los Angeles Times. Archived from the original on 4 December 2013. Retrieved 13 July 2014.
- ↑ "Government working to double generation target from solar parks". Economic Times. 18 July 2016. Retrieved 18 July 2016.
- ↑ "State wise wind power installation". Wind Power India. 2011.
- ↑ Biomass Energy Center. Biomassenergycentre.org.uk. Retrieved on 2012-02-28.
- ↑ "Biomass for power generation and CHP" (PDF). International Energy Agency. 2007.
- ↑ "Maharashtra, Punjab top producers of green energy from farm waste". Retrieved 31 August 2015.
- ↑ "India was the third-largest energy consumer in 2013". Retrieved 29 July 2016.
- ↑ http://www.worldenergyoutlook.org/resources/energydevelopment/energyaccessdatabase/
- ↑ "The upgrading of solid biomasss by means of Torrefaction" (PDF). Retrieved 2014-09-18.
- ↑ "Cofiring of biomass in coal-fired power plants – European experience". Retrieved 2014-09-18.
- ↑ "India, Biofuels Annual 2011" (PDF). United States Department of Agriculture: Global Agricultural Information Network. July 2011.
- ↑ Geothermal Energy and its Potential in India | For the Changing Planet. Greencleanguide.com (20 July 2013). Retrieved on 6 December 2013.
- 1 2 "Geothermal fields of India". Geological Survey of India. 2001.
- 1 2 "Development of 3.75 MW Durgaduani Mini Tidal Power Project, Sunderbans, West Bengal". NHPC Limited – A Government of India Enterprise. December 2011.
- ↑ "Tidal Energy in India". Energy Alternatives India. 2008.
- ↑ "Survey of Energy Resources" (PDF). World Energy Council. 2007. pp. 575–576.
- 1 2 3 "NPCIL Annual Report, 2010–2011" (PDF). Nuclear Power Corporation of India Limited. 2011.
- ↑ "NPCIL Annual Report, 2009–2010". Nuclear Power Corporation of India Limited. 2010.
- ↑ "India Steps Up Uranium Exploration After Record Discovery". The Wall Street Journal. 21 July 2011.
- ↑ "Nuclear Power in India". Retrieved 29 July 2015.
- ↑ "Progress of Susstations capacity in the Country up to March 2015" (PDF). Central Electricity Authority, GoI. 2014.
- ↑ "Progress of Transmission lines in the Country up to March 2015" (PDF). Central Electricity Authority,GoI. 2014.
- ↑ the ratio to be multiplied with transmission line capacity (MVA) to give average installed length of transmission line per one MVA of installed substation capacity at each voltage level.
- ↑ http://www.powergridindia.com/_layouts/PowerGrid/User/ContentPage.aspx?PId=78&LangID=english
- ↑ http://timesofindia.indiatimes.com/india/All-India-Power-Engineers-Federation-Indian-power-system/articleshow/28294988.cms
- ↑ "Electricity Transmission, USA". Institute for Energy Research. September 2, 2014. Retrieved 31 May 2015.
- ↑ "Fixing discoms' finances". Retrieved 9 July 2015.
- ↑ "12 September 2015 daily report, National load dispatch centre, Ministry of Power, GoI" (PDF). Retrieved 17 June 2015.
- ↑ "Power Transmission Maps of India, CEA, GoI,". Retrieved 7 October 2015.
- ↑ "Executive summary of month of February 2014" (PDF). Central Electricity Authority, Ministry of Power, Government of India. February 2014. Retrieved 21 March 2014.
- ↑ "AT& C Losses in Power Distribution" (PDF). Retrieved 9 June 2015.
- ↑ "Ministry of Power". Government of India. Retrieved December 2011. Check date values in:
|access-date=(help) - ↑ "REFORM PROGRAMME OF GUJARAT". Ministry of Power, Government of India. January 2001.
- ↑ "Government asks states to purchase short term power through reverse e-auction". Retrieved 5 April 2016.
- ↑ "Reverse e-auction lowering power prices. Ind-Ra". Retrieved 26 May 2016.
- ↑ "MCX move to launch electricity future faces legal hurdle". The Financial Express.
- ↑ Ignatius Pereira. "'No proposal to bring down power price'". The Hindu. Retrieved 29 July 2015.
- 1 2 "For India, a Power Failure Looms". The Wall Street Journal. 2 January 2012.
- ↑ Chris Gascoyne and Alexis Aik (February 2011). "Unconventional Gas and Implications for the LNG Market FACTS Global Energy" (PDF). Pacific Energy Summit.
- ↑ Amol Sharma and Megha Bahree (1 July 2012). "Grinding Energy Shortage Takes Toll on India's Growth". The Wall Street Journal.
- ↑ "Global Solar Storage Market: A Review Of 2015". 6 April 2016.
- ↑ "Analysis of Imports of battery". Retrieved 14 April 2016.
- ↑ "Day ahead market (DAM) area prices". Retrieved 14 August 2016.
- ↑ "Monthly report on Short-term Transactions of Electricity in India, May 2015 (Refer Table-5)" (PDF). Retrieved 14 August 2015.
- ↑ "IEX, Landed Cost Calculator in open access". Retrieved 15 July 2016.
- ↑ "Open Access in Indian power sector" (PDF). Retrieved 15 May 2013.
- ↑ "Draft CERC (Ancillary Services Operations) Regulations, 2015" (PDF). Central Electricity Regulatory Commission, Govt. of India. 2015. Retrieved 15 May 2015.
- ↑ "Piyush Goyal meets Suresh Prabhu to discuss 35k km rail line electrification". Retrieved 5 May 2016.
- 1 2 "Access to Clean Cooking Energy and Electricity - Survey of States" (PDF). Council on Energy, Environment and Water report. 2015. Retrieved 15 December 2015.
- ↑ Samir K Srivastava, Consumers need quality power, The Economic Times, 10 May 2007, pp. 12 (Available at: http://m.economictimes.com/PDAET/articleshow/msid-2024426,curpg-1.cms).
- ↑ "Progress report of Pumpset Energisation as on 30-09-2015" (PDF). Retrieved 14 October 2015.
- ↑ Anindya Upadhyay; Debjit Chakraborty (22 July 2016). "Top fossil fuel players back PM Narendra Modi's goal to shore up India's clean energy sector". news. Economic Times. Retrieved 22 July 2016.
- ↑ "Outstanding dues of power utilities to CPSUs up to July 2014" (PDF). Central Electricity Authority, Govt. of India. 2014.
- ↑ "The power paradox". 6 May 2016.
- ↑ "Power Tariff Scam Gets Bigger at Rs. 50,000 Crore as Allegations of Equipment Over-Invoicing Emerge". Retrieved 20 May 2016.
- ↑ "U.K. National Grid Status". Retrieved 14 October 2015.
- ↑ "Coal ministry opposes Niti Aayog's draft energy policy". Retrieved 18 October 2016.
- ↑ "Energy-efficient buildings – a business case for India? An analysis of incremental costs for four building projects of the Energy-Efficient Homes Programme".
- ↑ "Power Sector in India: White paper on Implementation Challenges and Opportunities" (PDF). KPMG. January 2010.
- ↑ "Cheaper renewable energy out paces nuclear power". Retrieved 21 March 2016.
- ↑ "Grid Security – Need For Tightening of Frequency Band & Other Measures" (PDF). Central Electricity Regulatory Commission. Retrieved 2 December 2016.
- ↑ Bhaskar, Utpal (1 January 2014). "India is now one nation, one grid". Livemint. Retrieved 2 December 2016.
- ↑ "Power Minister Piyush Goyal says power available for free". Retrieved 1 May 2015.
- ↑ "Daily report of power situation, Ministry of Power, GoI,". Retrieved 17 February 2013.
- ↑ "See Reports section, National load dispatch centre, Ministry of Power, GoI,". Retrieved 17 February 2013.
- ↑ "India To Export Another 500 MW Power To Bangladesh In Next 12 Months: NLDC". Retrieved 15 July 2015.
- ↑ "Table 13, Monthly operation report, March 2015" (PDF). POSOCO, Govt. of India. March 2015. Retrieved April 24, 2015.
- ↑ https://brage.bibsys.no/xmlui/bitstream/id/419902/14083_FULLTEXT.pdf
- ↑ http://southasiajournal.net/prospect-of-a-saarc-power-grid/
- ↑ "Select 'Energy' sections of Pakistan, Burma, Bangladesh, Nepal, Bhutan & Sri Lanka. The world Fact book.". Retrieved 17 February 2013.
- ↑ "LNG: The whole truth in Pakistan.". Retrieved 3 May 2015.
- ↑ "Saarc Chamber Pushes for Seamless Regional Energy Trade". Retrieved 31 July 2015.
- ↑ "Turning India's power surplus into a boon". Retrieved 26 October 2016.
- 1 2 "Indian Petroleum & Natural Gas statistics" (PDF). Retrieved 25 April 2014.
- ↑ "All India coal fired stations performance (2014-15)". Retrieved 27 May 2014.
- ↑ "Niti Aayog pitches for electricity as clean cooking option to LPG". Retrieved 13 April 2016.
- ↑ "Madhya Pradesh plans India's largest Solar Power Plant)". Retrieved 3 August 2014.
- ↑ "Solar power bidders accept Rs 6.49/unit offer from AP". Retrieved 27 May 2014.
- ↑ "Plans afoot to make India 100% e-vehicle nation by 2030. Piyush Goyal". Retrieved 26 March 2016.
- ↑ "Explaining the Surging Demand for Lithium-Ion Batteries". Retrieved 5 May 2016.
- ↑ "Made in India - Aglaya to Release Wireless Electricity Transmission for Defence and Intelligence Deployment at the Indian DefExpo 2016". Retrieved 5 March 2016.
- ↑ "Review of Recent Advances in Dynamic and Omnidirectional Wireless Power Transfer" (PDF). Retrieved 7 July 2016.
- ↑ "Natural Gas – Proved Reserves". CIA World Factbook. Retrieved January 2012. Check date values in:
|access-date=(help) - ↑ "Country Analysis Brief: India". U.S. Energy Information Administration. 2011.
- ↑ "India starts testing shale-gas plays". Oil and Gas Journal. 5 December 2011.
External links
- - Latest news about Indian Power Sector at one place
- National electricity Plan - 2012, CEA, GoI
- Electricity grid maps of southern region
- Macro Patterns in the Use of Traditional Biomass Fuels – A Stanford/TERI report on energy sector and human history
- India's Energy Policy and Electricity Production
| Companies |
|
|---|---|
| Governance |
|
| Currency | |
| Financial services | |
| History | |
| People |
|
| States | |
| Sectors | |
| |