Governor Francisco Gabrielli International Airport
| Governor Francisco Gabrielli International Airport Aeropuerto Internacional de Mendoza "Francisco Gabrielli" – El Plumerillo | |||||||||||
|---|---|---|---|---|---|---|---|---|---|---|---|
 | |||||||||||
| IATA: MDZ – ICAO: SAME | |||||||||||
| Summary | |||||||||||
| Airport type | Public / Military | ||||||||||
| Operator | Mendoza Province & Aeropuertos Argentina 2000 S.A. | ||||||||||
| Serves | Mendoza, Mendoza, Argentina | ||||||||||
| Elevation AMSL | 2,310 ft / 704 m | ||||||||||
| Coordinates | 32°49′54″S 068°47′34″W / 32.83167°S 68.79278°WCoordinates: 32°49′54″S 068°47′34″W / 32.83167°S 68.79278°W | ||||||||||
| Map | |||||||||||
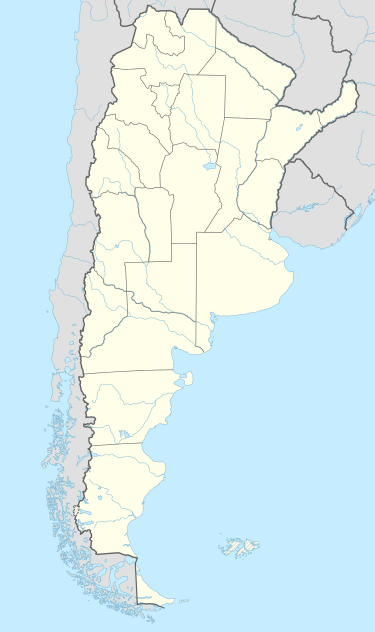 MDZ Location of airport in Argentina | |||||||||||
| Runways | |||||||||||
| |||||||||||
| Statistics (2014) | |||||||||||
| |||||||||||
Governor Francisco Gabrielli International Airport (Spanish: Aeropuerto Internacional Gobernador Francisco Gabrielli) (IATA: MDZ, ICAO: SAME), better known as El Plumerillo International Airport, is located 8 kilometres (5.0 mi) northeast of the centre of Mendoza, a city in the Mendoza Province of Argentina. The airport covers an area of 490 hectares (1,200 acres) and is operated by Aeropuertos Argentina 2000 S.A.[2][3]
The terminal building is 12,800 square metres (138,000 sq ft) and has two levels. There are 161 parking spaces at the airport, one infrequently used arrival/departure lounge, and 4 gates.
Airlines and destinations
| Airlines | Destinations |
|---|---|
| Aerolíneas Argentinas | Buenos Aires-Aeroparque, Comodoro Rivadavía, Córdoba, Neuquén, Río Gallegos, Rosario |
| Aerolíneas Argentinas operated by Austral Líneas Aéreas | Buenos Aires-Aeroparque, Buenos Aires-Ezeiza, Córdoba, Mar del Plata,[6] Puerto Iguazú, Rosario, Salta |
| Gol Linhas Aéreas | São Paulo-Guarulhos |
| LATAM Chile | Santiago de Chile |
| LATAM Argentina | Buenos Aires-Aeroparque, Lima (begins 2 February 2017) [7] |
| Sky Airline | Seasonal: Santiago (begins 6 January 2017)[8] |
Statistics
| Passengers | Change from previous year | Aircraft operations | Change from previous year | Cargo (metric tons) | Change from previous year | |
|---|---|---|---|---|---|---|
| 2005 | 652,504 | | 14,938 | | 2,645 | |
| 2006 | 655,318 | | 12,586 | | 3,054 | |
| 2007 | 689,963 | | 10,625 | | 3,364 | |
| 2008 | 780,464 | | 12,017 | | 3,436 | |
| 2009 | 858,984 | | 12,354 | | 2,759 | |
| 2010 | 976,889 | | 13,688 | | 5,533 | |
| Source: Airports Council International. World Airport Traffic Statistics (Years 2005-2010) | ||||||
Accidents and Incidents
- 20 January 1944: A LanChile Lodestar 18–50, registration CC-CLC-0072, was due to operate a Mendoza–San Juan cargo service when it crashed on takeoff, killing all 12 occupants aboard.[9]
See also
 Argentina portal
 Aviation portal
- List of airports in Argentina
References
- ↑ http://www.aeropuertosarg.com.ar/2015/02/trafico-de-pasajeros-en-aeropuertos-de-aa2000-crecio-54-en-2014/
- 1 2 (Spanish) "SAME – MENDOZA / El Plumerillo" (PDF). at AIP Argentina Archived 31 May 2011 at the Wayback Machine.
- 1 2 (Spanish) Aeropuerto Internacional de Mendoza "Francisco Gabrielli" – El Plumerillo at Organismo Regulador del Sistema Nacional de Aeropuertos (ORSNA)
- ↑ Airport information for SAME at World Aero Data. Data current as of October 2006.Source: DAFIF.
- ↑ Airport information for MDZ at Great Circle Mapper. Source: DAFIF (effective October 2006).
- ↑ http://airlineroute.net/2015/12/18/ar-cormdq-jan16/
- ↑ http://larepublica.pe/turismo/rumbos-al-dia/759716-latam-airlines-anuncia-vuelos-directos-entre-mendoza-y-lima/
- ↑ http://www.routesonline.com/news/38/airlineroute/268894/sky-airline-schedules-mendoza-service-in-1q17/
- ↑ Accident description for CC-CLC-0072 at the Aviation Safety Network. Retrieved on 25 June 2012.
External links
- Mendoza, MDZ at Aeropuertos Argentina 2000 (official web site)
- Current weather for SAME at NOAA/NWS
- Accident history for MDZ at Aviation Safety Network
This article is issued from Wikipedia - version of the 11/27/2016. The text is available under the Creative Commons Attribution/Share Alike but additional terms may apply for the media files.