Eddy covariance
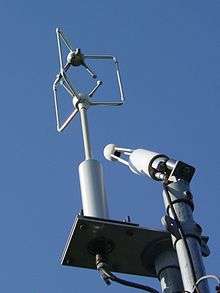
The eddy covariance (also known as eddy correlation and eddy flux) technique is a key atmospheric measurement technique to measure and calculate vertical turbulent fluxes within atmospheric boundary layers. The method analyzes high-frequency wind and scalar atmospheric data series, and yields values of fluxes of these properties. It is a statistical method used in meteorology and other applications (micrometeorology, oceanography, hydrology, agricultural sciences, industrial and regulatory applications, etc.) to determine exchange rates of trace gases over natural ecosystems and agricultural fields, and to quantify gas emissions rates from other land and water areas. It is frequently used to estimate momentum, heat, water vapour, carbon dioxide and methane fluxes [1] [2] [3] [4] [5]
The technique is also used extensively for verification and tuning of global climate models, mesoscale and weather models, complex biogeochemical and ecological models, and remote sensing estimates from satellites and aircraft. The technique is mathematically complex, and requires significant care in setting up and processing data. To date, there is no uniform terminology or a single methodology for the Eddy Covariance technique, but much effort is being made by flux measurement networks (e.g., FluxNet, Ameriflux, ICOS, CarboEurope, Fluxnet Canada, OzFlux, NEON, and iLEAPS) to unify the various approaches.
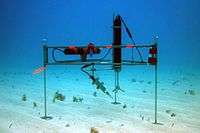
The technique has additionally proven applicable under water to the benthic zone for measuring oxygen fluxes between seafloor and overlying water.[6] In these environments, the technique is generally known as the eddy correlation technique, or just eddy correlation. Oxygen fluxes are extracted from raw measurements largely following the same principles as used in the atmosphere, and they are typically used as a proxy for carbon exchange, which is important for local and global carbon budgets. For most benthic ecosystems, eddy correlation is the most accurate technique for measuring in-situ fluxes. The technique's development and its applications under water remains a fruitful area of research.[7][8][9][10][11]
General principles
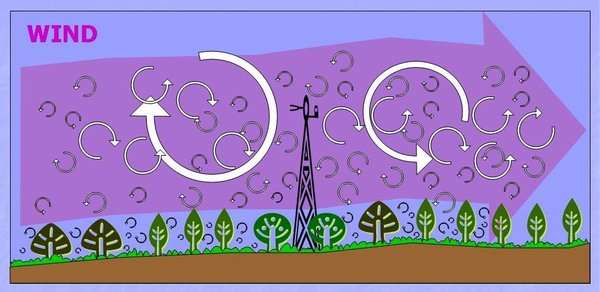
Representation of the air flow in the atmospheric boundary layer
Air flow can be imagined as a horizontal flow of numerous rotating eddies, that is, turbulent vortices of various sizes, with each eddy having horizontal and vertical components. The situation looks chaotic, but vertical movement of the components can be measured from the tower.
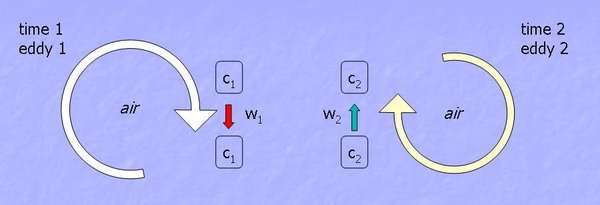
Physical meaning of the eddy covariance method
At one physical point on the tower, at Time1, Eddy1 moves parcel of air c1 down at the speed w1. Then, at Time2, Eddy2 moves parcel c2 up at the speed w2. Each parcel has gas concentration, pressure, temperature, and humidity. If these factors, along with the speed are known, we can determine the flux. For example, if one knew how many molecules of water went down with eddies at Time 1, and how many molecules went up with eddies at Time2, at the same point, one could calculate the vertical flux of water at this point over this time. So, vertical flux can be presented as a covariance of the vertical wind velocity and the concentration of the entity of interest.
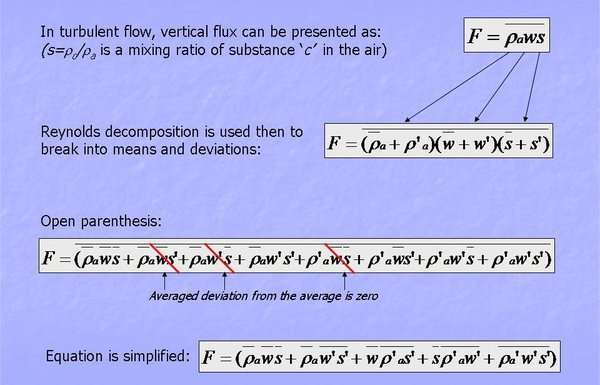
Mathematical foundation
In mathematical terms, "eddy flux" is computed as a covariance between instantaneous deviation in vertical wind speed (w') from the mean value (w-overbar) and instantaneous deviation in gas concentration, mixing ratio (s'), from its mean value (s-overbar), multiplied by mean air density (ρa). Several mathematical operations and assumptions, including Reynolds decomposition, are involved in getting from physically complete equations of the turbulent flow to practical equations for computing "eddy flux", as shown below.

Major assumptions
- Measurements at a point can represent an upwind area
- Measurements are done inside the boundary layer of interest
- Fetch/flux footprint is adequate – fluxes are measured only at area of interest
- Flux is fully turbulent – most of the net vertical transfer is done by eddies
- Terrain is horizontal and uniformed: average of fluctuations is zero; density fluctuations negligible; flow convergence & divergence negligible
- Instruments can detect very small changes at high frequency, ranging from minimum of 5 Hz and to 40 Hz for tower-based measurements
Eddy covariance processing software
Currently (2011) there are many software programs [12] to process eddy covariance data and derive quantities such as heat, momentum, and gas fluxes. The programs range significantly in complexity, flexibility, number of allowed instruments and variables, help system and user support. Some programs are open-source software, while others are closed-source or proprietary.
Examples include free fully supported and documented open-source software such as EddyPro; free unsupported open-source programs such as ECO2S and ECpack; free closed-source packages such as EdiRe, TK3, Alteddy, and EddySoft. Eddy covariance processing algorithms can also be implemented in commercial software such as Matlab.
Summary
In summation, the 3D wind and another variable (usually gas concentration, temperature or momentum) are decomposed into mean and fluctuating components. The covariance is calculated between the fluctuating component of the vertical wind and the fluctuating component of gas concentration. The measured flux is proportional to the covariance.
The area from which the detected eddies originate is described probabilistically and called a flux footprint. The flux footprint area is dynamic in size and shape, changing with wind direction, thermal stability and measurements height, and has a gradual border.
The effect of sensor separation, finite sampling length, sonic path averaging, as well as other instrumental limitations, affect frequency response of the measurement system and may need a co-spectral correction, especially noticeable with closed-path instruments and at low heights below 1-1.5 m.
Uses of eddy covariance method
Common uses:
- Greenhouse gas emissions
- Carbon dioxide emission monitoring
- Methane emissions monitoring
- Water loss, evapotranspiration
- Instantaneous water use efficiency
- Instantaneous radiation use efficiency
Novel uses:
- Precision irrigation, precision agriculture
- Carbon Sequestration and Capture monitoring
- Landfill gas emissions into the atmosphere
- Emissions of gases displaced by hydraulic fracturing into the atmosphere
- Gas leak detection and location
- Methane emission from permafrost regions
- Biogenic VOCs emission
- Reactive trace gas exchange flux measurement
See also
- Eddy (fluid dynamics)
- Ecosystem respiration
- Evaporation
- Evapotranspiration
- Greenhouse gas emissions
- Heat flux
- FluxNet
- Latent heat flux
- Transpiration
References
- ↑ Baldocchi, D., B. Hicks, and T. Meyers. 1988. Measuring biosphere-atmosphere exchanges of biologically related gases with micrometeorological methods. Ecology 69, 1331-1340
- ↑ Verma, S.B.: 1990, Micrometeorological methods for measuring surface fluxes of mass and energy, Remote Sensing Reviews 5(1): 99-115
- ↑ Lee, X., W. Massman, and B. Law. 2004. Handbook of Micrometeorology. Kluwer Academic Publishers, The Netherlands, 250 pp.
- ↑ Burba, G., 2013. Eddy Covariance Method for Scientific, Industrial, Agricultural and Regulatory Applications: a Field Book on Measuring Ecosystem Gas Exchange and Areal Emission Rates. LI-COR Biosciences, Lincoln, USA, 331 pp.
- ↑ Aubinet, M., T. Vesala, D. Papale (Eds.), 2012. Eddy Covariance: A Practical Guide to Measurement and Data Analysis. Springer Atmospheric Sciences, Springer Verlag, 438 pp.
- ↑ Berg, P., H. Røy, F. Janssen, V. Meyer, B. B. Jørgensen, M. Hüttel, and D. de Beer. 2003. Oxygen uptake by aquatic sediments measured with a novel non-invasive eddy correlation technique. Marine Ecology Progress Series. 261:75-83.
- ↑ University of Virginia. Aquatic Eddy Covariance Research Lab. Retrieved: 22 June 2015.
- ↑ The Florida State University. Eddy Correlation - Further Development and Studies of Flow and Light driven dynamics of Benthic Oxygen Exchange. Retrieved: 22 June 2015.
- ↑ Leibniz-Institute of Freshwater Ecology and Inland Fisheries. Eddy Correlation in Natural Waters. Retrieved: 22 June 2015.
- ↑ Max Planck Institute for Marine Microbiology. Eddy Correlation System (ECS). Retrieved: 22 June 2015.
- ↑ Centre for Coastal Biogeochemistry Research. Eddy Correlation. Retrieved: 22 June 2015.
- ↑ M. Mauder, T. Foken, R. Clement, J. A. Elbers, W. Eugster, T. Grunwald, B. Heusinkveld, and O. Kolle. 2007. Quality control of CarboEurope flux data – Part II: Inter-comparison of eddy-covariance software, Biogeosciences Discuss., 4, 4067–4099
Further reading
- Burba, G., 2013. Eddy Covariance Method for Scientific, Industrial, Agricultural and Regulatory Applications: a Field Book on Measuring Ecosystem Gas Exchange and Areal Emission Rates. LI-COR Biosciences, Lincoln, USA, 331 pp.
- Aubinet, M., T. Vesala, D. Papale (Eds.), 2012. Eddy Covariance: A Practical Guide to Measurement and Data Analysis. Springer Atmospheric Sciences, Springer Verlag, 438 pp.
- Foken, T., 2008. Micrometeorology, Springer-Verlag, Berlin, Germany, 308 pp.
- Lee, X., W. Massman, and B. Law, 2004. Handbook of Micrometeorology. Kluwer Academic Publishers, The Netherlands, 250 pp.
- Rosenberg, N. J., B. L. Blad, and S. B. Verma, 1983. Microclimate: The Biological Environment, Wiley-Interscience, 580 pp.
External links
- The Eddy Covariance Method Textbook
- Inter-comparison of Eddy Covariance Software
- Textbooks on Eddy Covariance from Google Books