Economy of the Western Cape
|
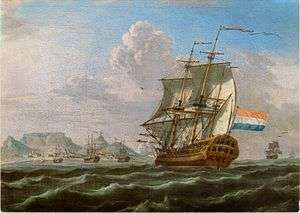
A panel from the frescoes in the Assembly Room, Mutual Building in Cape Town, painted by Le Roux Smith in 1942. The fresco illustrates the importance of agriculture and shipping to the economy of the Western Cape in the early half of the 20th century. | |
| Statistics | |
|---|---|
| GDP | R 424.38 billion (2016, second quarter)[1] |
GDP per capita | R74,274 (2016)[1] |
| 0.58 (2010)[2] | |
| 0.75[1] | |
Labour force | 2,785,871 (2016)[1] |
| Unemployment | 21.7% (2009)[3] |
| Public finances | |
| Revenues | R37.51 billion (2011/12)[4] |
| Expenses | R43.6 billion (2013/14)[5] |


Main sectors as a proportion of GDP in 2009[6]
Western Cape's GDP contribution compared to other South African provinces.[7]
The Western Cape's total GDP for 2016 was R424.38 billion (equivalent to US$29.3 billion)[1] growing from R268.26bn in 2008.. In 2016 the economy grew by 2.7% with an annual inflation rate of 6.3%.[1] The province accounts for 13.8% of South Africa's total GDP with Cape Town accounting for 9.9% of the country's total GDP in 2016.[1] The province accounts for 11.2% of the country's total population with 6.2 million residents. The Western Cape has a GDP per capita of R74,274 in comparison to the South African average of R55,609 per capita in 2016. At 19.7% the province has a substantially lower unemployment rate than the national average standing at 23.2% in 2009.[8] The province's Gini coefficient of 0.58 in 2010[2] is lower than South Africa's Gini coefficient of 0.65[9] (for 2011) making it more equal than the rest of the country whilst still being extremely high and unequal by international standards.
The Western Cape's Human Development Index is the highest in South Africa at 0.7708, compared to the South African average of 0.6675 in 2003.[10]
The province's economy is dominated by the city of Cape Town, where the vast majority of all non-agricultural economic activity takes place. The single largest contributor to the region's economy is the financial and business services sector, followed by manufacturing. Close to 30% of the gross regional product comes from foreign trade[11] with agricultural products and wine dominating exports. High-tech industries, international call centres, fashion design, advertising and TV production are niche industries rapidly gaining in importance.[12]
History

Early history
Since the founding of Cape Town by the Dutch East India Company (VOC) in 1652, the two pillars of the Cape Colony's economy until the Kimberley diamond strike of 1868 and the opening of the opening of the Suez Canal in 1869 were shipping and agriculture.
Cape Town's strategic position as the halfway point between Europe and Asia meant that prior to the opening of the Suez Canal, almost every ship involved in the spice trade between those two continents docked at Cape Town to resupply. The supplying of these ships with fresh provisions, fruit, and wine provided a very large market for the surplus produce of the colony. By the late 18th century, the Cape Colony was one of the best developed European settlements outside of Europe or the Americas.[14] During the 18th century, pastoral production was the dominant economic activity in the more arid north-western Cape (regions north of Paarl, south of Namaqualand and to the west of the Roggeveld) whilst mixed agriculture was dominant in the south-western Cape. During this period, the VOC exercised enormous control over the economy of the colony and imposed high and increasingly unpopular taxes in an effort to offset the high costs of running the colony.
For much of the Dutch rule in the Cape, income inequality is thought to have been amongst the highest in the pre-industrial world with pockets of wealthy living amongst an increasingly and relatively poor farming community. The biggest drivers of this inequality-apart from labour and race relations—was wheat and wine production. The wealthy segments of society were dominated by wine producers, alcohol merchants and those farmers that managed to dominate wheat production.[15]
Slavery played a large role in the early economy of the province until the British takeover of the Cape Colony in 1806 and the abolition of slavery in the British Empire in 1833. Slaves from across the Dutch Empire, in addition to political prisoners from the Dutch East Indies, were imported to work on the farms, homes and workshops in the area of the colony closest to Cape Town. At the beginning of the 18th century, labour relations between Dutch colonists—particularly the Trekboers in the interior—and the native Khoisan was largely characterised by semi-cooperative symbiosis. By the beginning of the 19th century, the majority of the Khoisan had been turned into a class of wage labourers whose status and situation was similar to serfs.[16] After 1833, the resistance of free burghers to the creation of a permanent wage-labour force as a result of the abolition of slavery as well as the 'resistance of freed slaves and Khoi to full proletarianization' produced labour relations characterised by a greater degree of dependency.[17]
The main export staple of the Cape Colony for most of its history was wine and brandy, but by 1845 it had been overtaken in value by wool. The wool boom continued into the 1850s and in addition to a speculative boom in copper-mining shares investment in the region grew considerably. This sparked the growth of the region's financial industry and by 1860 there were 23 local banks operating in fifteen towns. Increases in costs of production, falling wool prices, poor quality wools and severe drought from 1862 were among the causes of an economic recession that affected the region for most of the 1860s. Increasing competition from Port Elizabeth for the trade of the interior of Southern Africa encouraged Capetonian business interests to lobby for the construction of a railway. By 1865, nine towns in the region had a population of over 2000 people.[18]
1869 to 1900
After the Suez Canal was constructed in 1869, Cape Town's importance as a refuelling point declined as the canal obviated the need to navigate the longer sea lane around the southern coast of Africa. The recession of the 1860s and the construction of the canal forced the colony to search for new opportunities and adopt new products in rural production. The raising of Angora goats and ostriches for their mohair and feathers respectively date from this period and became important export commodities.
The discovery of diamonds and gold in the interior again increased investment in Cape Town and despite a long depression that plagued the western world for much of the 1870s the Western Cape's economy boomed. In addition, wool exports doubled in value from 1869 to 1872 to well over £3 million (equivalent to £1.46 billion in 2012 pounds)[19] However, it was Port Elizabeth whose merchants were best placed to service the interior where the gold and diamond deposits were found and as a centre for the wool and ostrich feather industries that would benefit the most. The consequence of this was that the Western Cape became increasingly dependent on overseas trade (especially with Britain). Despite this, Port Elizabeth's future economic development was threatened by the government's refusal to invest in upgrading its port facilities whilst over £1 million (equivalent to £426 million in 2012 pounds)[19] was invested in Cape Town's harbour.[18]:84–85
Much of the investment used to develop the diamond fields during the diamond-company mania of 1880-1881 came from the older towns in the Western Cape. Over half of the £12 million (equivalent to £5.12 billion in 2012 pounds)[19] invested in developing the Kimberly mines was raised in the Cape Colony. As Port Elizabeth and Kimberly developed the Western Cape found a booming market for its wheat and wine products. During this period, both the Eastern Cape and the Western Cape experienced some expansion in their manufacturing sectors. However the collapse in Kimberly mining shares (partly brought about by easy credit), poor agricultural performance and a decline in demand in the interior caused a series of bank collapses throughout the 1880s. This prompted renewed interest in mining investments in gold during the Witwatersrand Gold Rush where Western Cape capital was again used to develop mines in the interior of South Africa and Johannesburg in particular.[18]:85–86
As the 19th century came to an end, the economic and political dominance of the Western Cape and Cape Town in particular during the 19th century gave way to the dominance of Johannesburg and Pretoria in the 20th century.[18]:83
1900s (decade) to present
By the 1940s, differences in economic development between the Western Cape and the Witwatersrand (and Gauteng in general) had become more striking. The growing importance of local production inputs (thereby decreasing the importance of ports), the increasing relative cost of Western Cape labour and a growing reliance on semi-skilled instead of skilled labour in manufacturing had a negative impact on the province's economy. However this period of economic decline and underdevelopment did produce a highly competitive labour market.[20]:ix
Between 1999 and 2009 the provinces economy grew at an average rate of 4.9% per year. The province's Gini coefficient has decreased from 0.63 in the year 2000 and 0.60 in 2007 to 0.58 in 2010 representing a trend towards greater income equality.[21]
Imports and exports
In 2010, the Western Cape imported a total of R104.9 billion[22] worth of goods and commodities and exported R50.4 billion.[23] The discrepancy between imports and exports and the dominance of oil producing countries as the top trade partners can be explained by the large amount of petroleum and petroleum products that are imported into the province to be processed and refined at the Chevron Oil Refinery in Cape Town. Cape Town is a major entry point for oil and gas imports into South Africa. Adjusted for petroleum imports, the Western Cape imported R47.6 billion worth of goods and commodities in 2010 and had a trade surplus of R2.78 billion. A total of 1.2 million tons of cargo went through the Port of Cape Town in 2016.[1]
Imports
The importation of crude oil and other petroleum related products accounts for the largest proportion of the province's imports. This due to the importance of Cape Town as an entry point and refining nexus for South Africa and the Southern African region as a whole for oil and gas imports.
|
| ||||||||||||||||||||||||||||||||||||||||||||||||||||||
Exports
Agriculture still dominates the export industries of the Western Cape with little over 47% of all export commodities in 2010 being agricultural products. Exports have grown on average by 5% a year between 2001 and 2010. The provinces largest export markets continue to be European countries.[23]
|
| ||||||||||||||||||||||||||||||||||||||||||||||||||||||
Entrepreneurship and innovation
This finding [of Cape Town's entrepreneurship] suggests that Cape Town has a much higher level of knowledge, innovation and opportunity than elsewhere in the country.
- Dr Mike Herrington[24]
The city of Cape Town is ranked as the most entrepreneurial city in South Africa with Early-Stage Entrepreneurial Activity being 190% greater than South Africa’s national average.[24] In the future Cape Town plans to become a global design and innovation hub by focusing on industries and policies that support the design sector.[25] The design and advertising sectors are already the best developed in Africa and there has been a substantial increase in the number of high-tech start-up companies in Cape Town and interest in developing intellectual property start-up companies, has also been expressed through communities such as the Silicon Cape Initiative. In October 2011 Cape Town was awarded the title of World Design Capital 2014 by the International Design Alliance.[26]
Industries
Financial and business services
The biggest sector in the Western Cape's economy is the financial, business services and real estate sectors contributing approximately R77 billion in 2008.[27] The province is particularly strong in financial services associated with wealth management.
The first private banks in the Western Cape were established in Cape Town in the 1830s[18] to take advantage of the city's then strategic importance to world trade and facilitate trade and investment in the local economy. A number of large financial companies were founded in the province, and continue to maintain a significant presence in the province's capital, Cape Town. The largest such company being Old Mutual which was founded in Cape Town in 1845. Financial services group Sanlam Limited is headquartered in Cape Town where it was founded in 1918. Investment and wealth management firm Allan Gray is also headquartered in Cape Town.[28]
Energy
Oil, gas and other energy related industries play a significant role in the economy of the Western Cape. With South Africa's largest gas facility in Mossel Bay, natural offshore gas reserves, the province's strategic location and the Chevron Oil Refinery the region plays an important role in producing, processing and distributing petroleum products throughout the Southern African region.[29] The Chevron Oil Refinery in Milnerton is one of four refineries in South Africa and is capable of processing 100,000 barrels of crude oil a day.[30]
There is an estimated one trillion cubic feet of natural gas reserves in the Bredasdorp Basin south-east of Cape Town.[29]
The province's strategic location plays an important role in the growth of the local energy industry. With 32.2% of all West Africa's and 23.7% of all Middle Eastern oil produced in these regions being transported around the Cape of Good Hope. The servicing and maintenance of oil rigs and shipping involved in the transportation of oil and gas is a significant industry in its own right.[29]
Manufacturing
.jpg)
Manufacturing was the second largest contributor to the Western Cape's economy valued at R43.7 billion in 2008. The province's manufacturing sector has proven to be more robust then the rest of the country as a large part of the manufacturing sector is made up of a food processing sector whose products have been in relatively constant demand.[27] The largest manufacturing industry in the province is the clothing and textile industry, which employs over 170,000 people. The textile industry is presently declining in importance, due to competition with cheaper Eastern producers, such as China. The Saldanha Steel mill in Saldanha is a major producer and exporter of hot-rolled carbon steel. Designed to produce 1,25 million tons of hot-rolled carbon steel coil per year. The petrochemical and plastics industry, furniture, printing, pharmaceuticals, and publishing are also significant industries.
Of increasing importance to the province's economy are the production of and research in information technology, telecommunications, medical equipment, research equipment and other hi-tech industries. The Capricorn Science and Industrial Park in the Cape Town suburb of Muizenberg is an important growth node of the hi-tech industry in the province.[11]
Tourism

The province has grown a large tourism industry since 1994. The majority of international tourist visiting South Africa visit the province, with Cape Town, Garden Route and the Winelands being popular tourist destinations. In 2004, Cape Town was listed as one of the top five international tourist destinations.[31] Fifty percent of international tourists to South Africa visit the Western Cape. The province's overall share of South Africa's tourism sector by gross expenditure is 24 percent.[11]
There were 1,535,903 international arrivals in 2004 with continued growth annually. Annually 8 million tourists visit the province.[11] Domestic tourism is also on the rise, as low-cost air carriers such as Kulula making travel more affordable to more South Africans.
The seven most visited locations in 2016 were the V&A Waterfront, Cape of Good Hope, Boulders Beach, Table Mountain Cableway, Kirstenbosch Botanical Gardens, and Robben Island.[1]
Agriculture and Fishing

Around 11,5 million hectare of land in the province is cultivated. Although this only represents 12.4% of the total land used for agriculture in South Africa the Western Cape produces 55% to 60% of South Africa’s agricultural exports, valued at more than R7 billion[32] (US$1 billion)[33] a year. The sector is also one of the fastest growing of the economy, expanding by 10.6% in 2008.[27] Key agricultural export products from the province include wine, wool, ostrich related products, essential oils and fruit.[32] Wheat and other cereals are extensively cultivated in the Swartland and Overberg districts of the province.[11]
For most of the province's history exports have been dominated by agricultural products (primarily fruit, sea food, vegetables, wine and brandy).[11]
Wine & Brandy
The Western Cape region has been famous for its wine since the late 18th century and exports wine all over the world. In 2010 the Western Cape exported 374.8 million litres of wine.[34] With 100,200ha of vines under cultivation the province is the ninth largest exporter of wine in the world.[11] Distilled wine or brandy is produced in the area long the R62 around the towns of Worcester, Robertson, Barrydale, Calitzdorp and Oudtshoorn. Brandy is also produced around the towns of Paarl, Stellenbosch, Franschhoek, Wellington and Grabouw.[35] Brandy from these regions are regarded as amongst the best in the world.[36]
Fruit
With 52,300ha of fruit trees under cultivation the province is also well known for its fruit and fruit related products. The vast majority of South Africa's pome (apples & pears) fruit and most of its stone fruit is grown in the province. Around 687,121 tons of apples and 345,296 tons of pears were exported in 2008. Ceres Fruit Juices originated in the town of Ceres and is a major exporter of fruit juices to North America, Europe, and Asia. Appletiser, a popular sparkling fruit juice, originated from and all production is based in the town of Elgin. The major fruit growing regions of the province are Ceres, Grabouw, and Villiersdorp.[37]
Fishing
Around 75% of all commercial fishing in South Africa takes place along the Western Cape's coastline. The provinces rich cold water fishing grounds are abundant in marine life. Marine life such as Spiny lobster (locally known as Crayfish), abalone, snoek, squid, octopus, oysters and mussels are extensively fished. The fishing of Spiny lobster and abalone is heavily regulated due to their high value and dwindling population due to extensive poaching.[11]
References
- 1 2 3 4 5 6 7 8 9 City of Cape Town (2016). "Economic Performance Indicators for Cape Town" (PDF). Cape Town: City of Cape Town. Retrieved 20 November 2016.
- 1 2 "Regional Development Profile City of Cape Town" (PDF). Western Cape Government. 2011. Retrieved 18 September 2015.
- ↑ "Population and Unemployment by Province". Wesgro IQ. 2011. Retrieved 11 January 2012.
- ↑ "MEDIUM TERM BUDGET POLICY STATEMENT: 2012 - 2015" (PDF). Western Cape Government Provincial Treasury. 23 November 2011. Retrieved 30 January 2012.
- ↑ "Cape's pieces of budget pie". Cape Argus. March 8, 2013. Retrieved March 11, 2013.
- ↑ Bureau for Economic Research (28 July 2011). "The current state and short term (2011/12) prospects for the South African & Western Cape economies" (PDF). City of Cape Town. Retrieved 17 August 2011.
- ↑ "The Economy of Gauteng". Gauteng Online. 2010/11. Retrieved 14 April 2013. Check date values in:
|date=(help) - ↑ "PROVINCIAL GOVERNMENT OF THE WESTERN CAPE: OVERVIEW". Cape Gateway. Retrieved 17 August 2011.
- ↑ "GINI index (World Bank estimate)". World Bank. Retrieved 18 September 2015.
- ↑ Adelzadeh, Asghar; et al. South Africa Human Development Report 2003 (PDF). Cape Town: Oxford University Press. p. 282. ISBN 978-0-19-578418-3.
- 1 2 3 4 5 6 7 8 "Investing in the Western Cape". Brand South Africa. Retrieved 29 January 2011.
- ↑ "Fast Facts: April–May 2007, Provincial Profile, Western Cape". South African Institute of Race Relations, pg 20.
- ↑ "GDP and GDP growth by Province". Wesgro IQ. Retrieved 11 January 2012.
- ↑ Smith, Adam (1776), Wealth of Nations, Penn State Electronic Classics edition, republished 2005, p. 516
- ↑ Fourie, Johan; von Fintel, Dieter (15 July 2010). "A History With Evidence: Income inequality in the Dutch Cape Colony". Retrieved 11 January 2012.
- ↑ Penn, Nigel (1989). The Angry Divide-Labour, land and livestock in the Western Cape during the 18th century: The Khoisan and the colonists. Cape Town: David Philip. p. 2. ISBN 0-86486-116-8.
- ↑ Worden, Nigel (1989). The Angry Divide-Adjusting to emancipation: Freed slaves and farmers in the mid-nineteenth-century South-Western Cape. Cape Town: David Philip. pp. 31–39. ISBN 0-86486-116-8.
- 1 2 3 4 5 Mabin, Alan (1989). The Angry Divide-The underdevelopment of the Western Cape, 1850-1900. Cape Town: David Philip. pp. 82–94. ISBN 0-86486-116-8.
- 1 2 3 Measuring Worth, Relative Value of a UK Pound Amount - average earnings, retrieved on 10 January 2012
- ↑ James, Wilmot; Simons, Mary (1989). The Angry Divide - Introduction. Cape Town: David Philip. ISBN 0-86486-116-8.
- ↑ "A profile of the Western Cape province: Demographics, poverty, inequality and unemployment" (PDF). Elsenburg. August 2005. Retrieved 30 January 2012.
- 1 2 3 "Imports by province". Wesgro IQ. 2011. Retrieved 17 January 2012.
- 1 2 3 4 "Exports by province". Wesgro IQ. 2011. Retrieved 17 January 2012.
- 1 2 "Cape Town outshines rest of SA in entrepreneurship". University of Cape Town. Retrieved 26 February 2011.
- ↑ "Cape Town sets its sights on becoming global entrepreneurship hub". City of Cape Town. Retrieved 19 April 2011.
- ↑ "Cape Town awarded World Design Capital 2014 title". South African Broadcasting Corporation. 26 October 2011. Retrieved 24 February 2012.
- 1 2 3 "Western Cape Economic Overview". Westgro. Retrieved 14 May 2011.
- ↑ "Allan Gray: About us". Allan Gray company website. Retrieved 27 May 2011.
- 1 2 3 "Economic sectors: Oil & Gas". Western Cape Business. Retrieved 17 January 2012.
- ↑ "South Africa Fact Sheet" (PDF). Chevron. March 2011. Retrieved 17 January 2012.
- ↑ "Sectoral Pockets of Excellence". Cape Business News. Retrieved 24 April 2011.
- 1 2 Wesgro. "Agricultural Statistics in Brief". Retrieved 26 February 2011.
- ↑ "South African rand and US dollar exchange rate". Retrieved 26 February 2011.
- ↑ "Wine Industry Information" (PDF). South African Wine Information & Systems. December 2010.
- ↑ "The Western Cape Brandy Rout". The South African Brandy Association. Retrieved 26 February 2011.
- ↑ "South Africa wins Best Brandy in the World". International Wine & Spirits Competition 2010. Retrieved 26 February 2011.
- ↑ Key Deciduous Fruit Statistics 2009. Paal: Deciduous Fruit Producers' Trust. 2009. p. 83. Retrieved 29 January 2011.
External links
- Western Cape Government
- Western Cape Tourism Trade and Investment Agency
- Western Cape Tourism Trade and Investment Agency
| By province | ||
|---|---|---|
| Natural resources | ||
| Services | ||
| Economic history | ||
| Affirmative action | ||
| Macroeconomics | ||
| Misc. | ||