Economy of Saint Pierre and Miquelon
| Currency | Euro |
|---|---|
| Calendar year | |
| Statistics | |
| GDP |
|
GDP growth | NA% |
GDP per capita |
|
GDP by sector | agriculture: 2%; industry: 15%; services: 83% (2006 est.) |
|
| |
Labour force | 3.194 (2006 est.) |
Labour force by occupation | agriculture: 18%; industry: 41%; services: 41% (1996 est.) |
| Unemployment |
|
| External | |
| Exports |
|
Export goods | fish and fish products, soybeans, animal feed, mollusks and crustaceans, fox and mink pelts |
| Imports |
|
Import goods | meat, clothing, fuel, electrical equipment, machinery, building materials |
|
All values, unless otherwise stated, are in US dollars. | |
The economy of Saint Pierre and Miquelon, due to the islands' location, has been dependent on fishing and servicing fishing fleets operating off the coast of Newfoundland. The economy has been declining, however, due to disputes with Canada over fishing quotas and a decline in the number of ships stopping at the islands.[1] In 1992 an arbitration panel awarded the islands an exclusive economic zone of 12,348 square kilometres (4,768 sq mi) to settle a longstanding territorial dispute with Canada, although it represents only 25 percent of what France had sought. The islands are heavily subsidized by France, which benefits the standard of living. The government hopes an expansion of tourism will boost economic prospects, and test drilling for oil may pave the way development of the energy sector.
References
See also
- Economy of France in: French Guiana, French Polynesia, Guadeloupe, Martinique, Mayotte, New Caledonia, Réunion, Saint Barthélemy, Saint Martin, Saint Pierre and Miquelon, Wallis and Futuna
| Denmark | 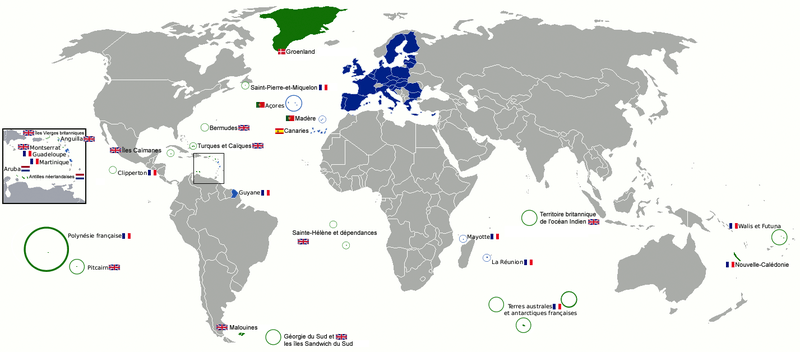 | |
|---|---|---|
| France | ||
| Netherlands | ||
| United Kingdom |
| |