Economy of Iceland
 Reykjavík | |
| Currency | Icelandic króna (ISK) = 0.009 USD |
|---|---|
| Calendar year | |
Trade organisations | EFTA, OECD, WTO |
| Statistics | |
| GDP |
|
| GDP rank | 111th (nominal) / 145th (PPP) |
GDP growth | 1.9% (2014)[2] |
GDP per capita |
$58,000(2016, nominal),$48,000(2016,PPP) [1] 14th (nominal) / 22nd (PPP) |
GDP by sector |
services: 71.7% industry: 22.4% agriculture: 6.0% (2014 est.)[3] |
| 1.9% (Change in past 12 months)[2] | |
Population below poverty line | 8%[4] - income below 1,200€/ month (2015) |
| .23 (2014)[5] | |
Labour force | 0.2 million (April 2015)[6] |
Labour force by occupation |
services: 73% industry: 22.2% agriculture: 4.8% (2008)[3] |
| Unemployment | 2.9% (June 2015)[2] |
Average gross salary | 511,000ISK/ 4,500USD/ month |
| 367,000ISK/ 3,200USD/ month | |
Main industries | Fish processing, aluminum smelting, ferrosilicon production, geothermal power, hydropower, tourism |
| 12th (2015)[7] | |
| External | |
| Exports |
|
Export goods | Fish and fish products: 40%, aluminum, animal products, ferrosilicon, diatomite |
Main export partners |
(2014)[8] |
| Imports |
|
Import goods | Machinery and equipment, petroleum products, foodstuffs, textiles |
Main import partners |
other 30.05%[9] |
| Public finances | |
|
| |
| Revenues | $6 billion (2012 est.) |
| Expenses | $6 billion (2012 est.) |
| Economic aid | ~$20 million (0.24% GDP, 2009 budget) |
|
Moody's Investors Service[10] Baa2 (Foreign) Baa1 (Domestic) Outlook: Stable Standard & Poor's[10] BBB- (Foreign) BBB- (Domestic) Outlook: Positive Fitch[10] BBB (Foreign) BBB+ (Domestic) Outlook: Positive | |
Foreign reserves |
|
The economy of Iceland is small and subject to high volatility. In 2011, gross domestic product was US$12.3bn. With a population of 321,000, this is $38,000 per capita, based on purchasing power parity (PPP) estimates.[11] The financial crisis of 2007–2010 produced a decline in GDP and employment, although the magnitude of this decline remains to be determined.
Iceland has a mixed economy with high levels of free trade and government intervention. However, government consumption is less than other Nordic countries. Geothermal power is the primary source of home and industrial energy in Iceland.[12]
In the 1990s Iceland undertook extensive free market reforms, which initially produced strong economic growth. As a result, Iceland was rated as having one of the world's highest levels of economic freedom[13] as well as civil freedoms. In 2007, Iceland topped the list of nations ranked by Human Development Index[14] and was one of the most egalitarian, according to the calculation provided by the Gini coefficient.[15]
From 2006 onwards, the economy faced problems of growing inflation and current account deficits. Partly in response, and partly as a result of earlier reforms, the financial system expanded rapidly before collapsing entirely in a sweeping financial crisis. Iceland had to obtain emergency funding from the International Monetary Fund and a range of European countries in November 2008.
History
Geography and resources
Iceland occupies a land area of 103,000 square kilometers. It has a 4,790 kilometer coastline and a 200 nautical mile (370.4 km) exclusive economic zone extending over 758,000 square kilometers of water. Approximately only 0.7% of Iceland's surface area is arable, since the island's terrain is mostly mountainous and volcanic.[16]
Iceland has few proven mineral resources. In the past, deposits of sulphur have been mined, and diatomite (skeletal algae) was extracted from lake Mývatn until recently. However, today most sulphur is obtained in the refining of oil. That plant has now been closed for environmental reasons. The only natural resource conversion in Iceland is the manufacture of cement. Concrete is widely used as building material, including for all types of residential housing.
By harnessing the abundant hydroelectric and geothermal power sources, Iceland's renewable energy industry provides close to 85% of all the nation's primary energy[17] - proportionally more than any other country[18] - with 99.9% of Iceland's electricity being generated from renewables. The Icelandic Parliament decided in 1998 to convert vehicle and fishing fleets to hydrogen fuel and consequently Iceland expects to be energy-independent, using 100% renewable energy, by 2050.[19] As part of this program, the country opened the world's first public hydrogen filling station in 2003. As of 2007, it has about 40 hydrogen-powered vehicles on the road, second only to the U.S. state of California.
By far the largest of the many Icelandic hydroelectric power stations is Kárahnjúkar Hydropower Plant (690 MW) in the area north of Vatnajökull. Other stations include Búrfell (270 MW), Hrauneyjarfoss (210 MW), Sigalda (150 MW), Blanda (150 MW), and more. Iceland has explored the feasibility of exporting hydroelectric energy via submarine cable to mainland Europe and also actively seeks to expand its power-intensive industries, including aluminium and ferro-silicon smelting plants.
Recent geological research has improved the likelihood of Iceland having sizable off-shore oil reserves within its 200 mile economic zone in the seabed of the Jan Mayen area.[20][21]
Sectors
Manufacturing
Iceland is the world's largest electricity producer per capita.[17] The presence of abundant electrical power due to Iceland's geothermal and hydroelectric energy sources has led to the growth of the manufacturing sector. Power-intensive industries, which are the largest components of the manufacturing sector, produce mainly for export. Manufactured products constituted 36% of all merchandise exports, an increase from the 1997 figure of 22%. Power-intensive products' share of merchandise exports is 21%, compared to 12% in 1997.[22]
Aluminium
Aluminium smelting is the most important power-intensive industry in Iceland. There are currently three plants in operation with a total capacity of over 800,000 mtpy,[23] putting Iceland at 11th place among aluminium-producing nations worldwide.
Rio Tinto Alcan operates Iceland's first aluminium smelter (plant name: ISAL), in Straumsvík, near the town of Hafnarfjörður. The plant has been in operation since 1969. Its initial capacity was 33,000 metric tons per year (mtpy) but it has since been expanded several times and now has a capacity of about 189,000 mtpy.
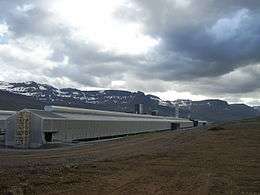
The second plant started production in 1998 and is operated by Norðurál, a wholly owned subsidiary of U.S.-based Century Aluminum Company. It is located in Grundartangi in Western Iceland near the town of Akranes. Its former capacity was 220,000 mtpy but an expansion to 260,000 mtpy has already finished. In 2012 the plant produced 280,000 metric tons which was valued at 610 million dollars or 76 billion krónur. 4,300 gigawatts were used in the production that year, amounting to nearly one-fourth of all electrical energy produced in the country.[24] In October 2013, Norðurál announced the start of a five-year project aimed at increasing its production by a further 50,000 mtpy.[25]
United States-based aluminium manufacturer Alcoa runs a plant near the town of Reyðarfjörður. The plant, known as Fjardaál (or "aluminium of the fjords"), has a capacity of 346,000 mtpy and was put into operation in April 2008. To power the plant, Landsvirkjun built Kárahnjúkar, a 690-MW[26] hydropower station. The project was enormous in the context of the Icelandic economy, increasing total installed electric power capacity from under 1,600 MW to around 2,300 MW.[27]
According to Alcoa, construction of Fjardaál entailed no human displacement, no impact on endangered species, and no danger to commercial fisheries; there will also be no significant effect on reindeer, bird and seal populations.[28] However, the project drew considerable opposition from environmentalist groups such as the World Wide Fund for Nature, which called on Alcoa to abandon the plan to build Fjardaál. In addition, Icelandic singer Björk was a notable early opponent to the plan; protesting the proposed construction, the singer's mother, Hildur Rúna Hauksdóttir, went on a hunger strike in 2002.[29]
Several other aluminium smelter projects have been planned. Between 2005 and 2011, Alcoa conducted a feasibility study for a second plant in Iceland near Húsavík.[30] That plant was to have a 250,000 mtpy capacity, to be powered entirely by geothermal power, although later estimates showed a potential need for other sources of power. In October 2011, Alcoa announced its decision to cancel the Bakki project.[31] In 2006, Nordurál signed a memorandum of understanding with two Icelandic geothermal power producers, Hitaveita Suðurnesja and Orkuveita Reykjavíkur, to purchase electricity for its own aluminium reduction project in Helguvík. The power supplied will initially support aluminium production of 150,000 mtpy, which will eventually grow to support 250,000 mtpy.[32]
Fisheries
Fisheries and related sectors—in recent years labelled "the ocean cluster"—are the single most important part of the Icelandic economy, representing an overall contribution to GDP of 27.1% in 2011.[33] The fisheries sector directly employs around 9,000 people (4,900 in fishing and 4,100 in fish processing; approx. 5 per cent of Iceland’s workforce),[34] although it is estimated that a total of between 25,000 and 35,000 people (up to 20 per cent of the workforce) depend on the ocean cluster for their livelihood. Many of these jobs are provided by technological companies that manufacture equipment for fisheries firms and by companies engaged in the advanced processing of marine products or in biotechnical production. By contrast, aquaculture remains a very small industry in Iceland, employing only around 250 people for a production of 5,000 tonnes.[35]
Iceland is the second biggest fisheries nation in the North East Atlantic behind Norway, having overtaken the United Kingdom in the early 1990s. Since 2006, Icelandic fishing waters have yielded a total catch of between 1.1m and 1.4m tonnes of fish annually, although this is down from a peak of over 2m tonnes in 2003.[36] Iceland has been affected by a general decline in fishing yields in the Northeast Atlantic, with a one-way decrease of 18% from 2003 to 2009, although this trend appears to have been halted or reversed lately.
Cod remains the most important species harvested by Icelandic fisheries, with a total catch of 178,516 tonnes in 2010. The catch of cod has stagnated in recent years due to quotas, and was supplemented by the catch of blue whiting, which is used mainly for processing. The Icelandic catch of this previously insignificant fish increased from a negligible 369 tonnes in 1995 to a peak of 501,505 tonnes in 2003. Subsequently, the stock showed signs of instability and quotas were reduced, leading to a decline in the catch to 87,121 tonnes in 2010.[37] There have been increased numbers of Atlantic mackerel, the "Miracle of the Mackerel." in the 21st century as the Atlantic Ocean has slightly warmed.[38]
Finance
Banks
The Icelandic banking system has been completely overhauled in the wake of its collapse in 2008. There are now three major commercial banks, NBI (commonly referred to as Landsbanki), Arion Bank (formerly Kaupthing Bank) and Islandsbanki (formerly Glitnir). There are smaller banks, including Straumur Investment Bank and MP Bank, and some savings banks. There has been extensive consolidation of smaller banks, with Sparisjodur Keflavikur being taken over by Landsbanki and Byr being taken over by Islandsbanki. There is no bank presently listed on Iceland Stock Exchange. Arion Bank and Islandsbanki are mostly owned by foreign creditors while Landsbanki is now majority owned by the State. The ownership stake of the Icelandic State in the banks is managed by Bankasysla rikisins (State Financial Investments), which aims to privatise its shares in the banks in coming years.
Stock market
Because of the persistent inflation, historical reliance on fish production and the long-standing public ownership of the commercial banks, equity markets were slow to develop. The Iceland Stock Exchange was created in 1985. Trading in Icelandic T-Bonds began in 1986 and trading in equities commenced in 1990. All domestic trading in Icelandic stocks, bonds and mutual funds takes place on the ICEX.
The ICEX has used electronic trading systems since its creation. Since 2000, SAXESS, the joint trading system of the NOREX alliance, has been used. There are currently two equities markets on the ICEX. The Main Market is the larger and better known of the two. The Alternative Market is a less regulated over-the-counter market. Because of the small size of the market, trading is illiquid in comparison with larger markets. A variety of firms across all sectors of the Icelandic economy are listed on the ICEX.
The most important stock market index is the ICEX 15.
Other financial markets
Historically, investors tended to be reluctant to hold Icelandic bonds because of the persistence of high inflation and the volatility of the Króna. What did exist was largely limited to bonds offered by the central government. The bond market on the ICEX has boomed in recent years, however, largely because of the resale of mortgages as housing bonds.
A mutual fund market exists on the ICEX in theory, but no funds are currently listed. A small derivatives market formerly existed, but was closed in 1999 because of illiquidity.
External trade

Iceland's economy is highly export-driven. Marine products account for the majority of goods exports. Other important exports include aluminum, ferro-silicon alloys, machinery and electronic equipment for the fishing industry, software, woollen goods. Most of Iceland's exports go to the European Union (EU) and European Free Trade Association (EFTA) countries, the United States, and Japan. The 2005 value of Iceland's exports was $3.215 billion FOB.[39]
The main imports are machinery and equipment, petroleum products, foodstuffs and textiles. Cement is Iceland's most imported product. The total 2005 value of imports was $4.582 billion. Iceland's primary import partner is Germany, with 12.6%, followed by the United States, Norway, and Denmark. Most agricultural products are subject to high tariffs; the import of some products, such as uncooked meat, is greatly restricted for phyto-sanitary reasons.[39][40]
Iceland's relatively liberal trading policy has been strengthened by accession to the European Economic Area in 1993 and by the Uruguay Round, which also brought significantly improved market access for Iceland's exports, particularly seafood products. However, the agricultural sector remains heavily subsidized and protected; some tariffs range as high as 700%.
The fishing industry is one of the most important industries. It provides 40% of export income and employs 7.0% of the workforce; therefore, the state of the economy remains sensitive to world prices for fish products.[39]
The following table should be considered in light of the dramatic depreciation of the currency in 2008 of approximately 50%, corrected to EUD or USD. Corrected in this manner imports since the 2007 peak have been negative, not positive. See Wikipedia entry on Icelandic króna.
Imports
|
Exports
|
Economic agreements and policies
Iceland became a full European Free Trade Association member in 1970 and entered into a free trade agreement with the European Community in 1973. Under the agreement on a European Economic Area, effective January 1, 1994, there is basically free cross-border movement of capital, labor, goods, and services between Iceland, Norway, and the EU countries. However, many of Iceland's political parties remain opposed to EU membership, primarily because of Icelanders' concern about losing control over their fishing resources. Iceland also has bilateral free trade agreements with several countries outside the EEA. The most extensive of these is the Hoyvík Agreement between Iceland and the Faroe Islands, this agreement goes even further than the EEA agreement by establishing free trade in agricultural products between the nations. Iceland has a free trade agreement with Mexico on November 27, 2000.
Currency and monetary policy
The currency of Iceland is the króna (plural: krónur), issued exclusively by the Central Bank of Iceland since the bank's founding in 1961.[41] The exchange rate in 2008 was 78 krónur to the United States dollar, down from 97.43 in 2001.[39] Iceland's Krona went from 60 to the dollar in November 2007 to 147 to the dollar in November 2008.
Monetary policy is carried out by the Central Bank of Iceland, which maintains a 2.5% inflation target rate, adopted in March 2001.[42]
During the 1970s the oil shocks (1973 and 1979 energy crisis) hit Iceland hard. Inflation rose to 43% in 1974 and 59% in 1980, falling to 15% in 1987 but rising to 30% in 1988. Iceland experienced moderately strong GDP growth (3% on average) from 1995 to 2004. Growth slowed between 2000 and 2002, but the economy expanded by 4.3% in 2003 and grew by 6.2% in 2004. Growth in 2005 exceeded 6%. Inflation averaged merely 1.5% from 1993 to 1994, and only 1.7% from 1994 to 1995. Inflation over 2006 topped at 8.6%, with a rate of 6.9% as of January 2007. Standard & Poor's reduced their rating for Iceland to AA- from A+ (long term) in December 2006, following a loosening of fiscal policy by the Icelandic government ahead of the 2007 elections.[43][44] Foreign debt has risen to more than five times the value of its GDP, and Iceland's Central Bank has raised short-term interest rates to nearly 15% in 2007. Due to the plunging currency against the euro and dollar, in 2008 inflation is speculated to currently be at 20-25%.
Growth
Iceland's economy had been diversifying into manufacturing and service industries in the 1990s, and new developments in software production, biotechnology, and financial services were taking place. The tourism sector was also expanding, with the recent trends in ecotourism and whale watching. However, in 2008, the Icelandic economy entered a deep recession in correspondence to the global financial crisis. Although Iceland's economy grew 3.3% during the last quarter of 2009, the overall contraction in GDP over 2009 was 6.5%, less than the 10% originally forecasted by the IMF.[45][46]
See also
Notes
- 1 2 World Economic Outlook Database, April 2015, Retrieved 10 June 2015
- 1 2 3 Key figures, Statistics Iceland, Retrieved 4 August 2015
- 1 2 The World Factbook, Retrieved 10 June 2015
- ↑ Statistics Iceland, Retrieved 4 August 2015
- ↑ Income distribution, Statistics Iceland, Retrieved 10 June 2015
- ↑ Labour force, Statistics Iceland, Retrieved 10 June 2015
- ↑ World Bank Group, Ranking of economies, Retrieved 10 June 2015
- ↑ Statistics Iceland, Retrieved 5 August 2015
- ↑ Imports by countries November 2013 Statistics Iceland.
- 1 2 3 Iceland Ministry of finance and economic affairs, Retrieved 4 August 2015
- ↑ Source: Statistics Iceland.
- ↑ Christopher Mims. "One Hot Island: Iceland's Renewable Geothermal Power". Retrieved 3 March 2015.
- ↑ Iceland: One of the world´s most free economies, Invest in Iceland Agency
- ↑ Human Development Index Archived July 2, 2015, at the Wayback Machine.
- ↑ "Human Development Report 2007/2008 - Inequality measures, ratio of richest 10% to poorest 10%". Hdrstats.undp.org. 2010-11-04. Retrieved 2012-02-20.
- ↑ "The Economy of Iceland". The Central Bank of Iceland. Retrieved 2006-06-22.
- 1 2 "Energy Data". Askja Energy - The Independent Icelandic Energy Portal. Retrieved 3 March 2015.
- ↑ Presentation to the International Partnership for the Hydrogen Economy, Icelandic Ministry of Industry and Commerce & Ministry for Foreign Affairs, published January 2005, accessed 2007-05-14
- ↑ Powering The Plains, South Dakota Public Utilities Commission, published 2003, accessed 2007-05-14
- ↑ "Increased belief in oil at Jan Mayen (in Norwegian)". GEO365.no. 22 November 2011. Retrieved 23 November 2011.
- ↑ "Oil possible in the Dragon zone (in Icelandic)". Mbl.is. 23 November 2011. Retrieved 23 November 2011.
- ↑ "Economy of Iceland". Central Bank of Iceland. p. 23. Retrieved 2006-06-22.
- ↑ "Aluminium overtakes fish in Iceland". Nordregio. Retrieved 16 October 2013.
- ↑ "Viðbótarstækkun Norðuráls flýtt". Norðurál. April 3, 2006. Archived from the original on 2006-05-05. Retrieved 2006-06-22.
- ↑ "Norðurál semur við VHE" [Nordurál signs contract with VHE] (in Icelandic). Norðurál ehf. 15 October 2013. Retrieved 23 October 2013.
- ↑ "Fljótsdalur Power Station". Landvirkjun. Retrieved 16 October 2013.
- ↑ "Virkjanasaga frá 1930 til 2012" [Historic development of installed power between 1930 and 2012]. National Energy Authority (Orkustofnun), Iceland. Retrieved 16 October 2013.
- ↑ "Fjarðaál Overview". Alcoa Aluminum. Retrieved 2006-06-22.
- ↑ "Bjork's mother on hunger strike". BBC News. October 17, 2002. Retrieved 2006-06-22.
- ↑ "Alcoa, Government of Iceland and Municipality of Húsavík Sign Memorandum of Understanding". Alcoa. May 17, 2006. Retrieved 2006-06-22.
- ↑ "Alcoa hættir við Bakka" [Alcoa cancels Bakki] (in Icelandic). 17 October 2011. Retrieved 16 October 2013.
- ↑ "Century Aluminum Company Icelandic Subsidiary Signs Energy MOU for Helguvik Greenfield Smelter". Nordural. June 2, 2006. Archived from the original on October 8, 2007. Retrieved 2006-06-22.
- ↑ "Iceland's Ocean Economy—The economic impact and performance of the ocean cluster in 2011" Check
|url=value (help) (PDF) (in Icelandic). Icelandic Ocean Cluster. p. 4. Retrieved 29 October 2013. - ↑ "Employed persons by economic activity, sex and regions 2008-2012 (NACE REV 2.)". Statistics Iceland. Retrieved 29 October 2013.
- ↑ "Iceland's Ocean Economy—The economic impact and performance of the ocean cluster in 2011" Check
|url=value (help) (PDF) (in Icelandic). Icelandic Ocean Cluster. p. 10. Retrieved 29 October 2013. - ↑ "Iceland's Ocean Economy—The economic impact and performance of the ocean cluster in 2011" Check
|url=value (help) (PDF) (in Icelandic). Icelandic Ocean Cluster. p. 5. Retrieved 29 October 2013. - ↑ "Statistics Iceland - Statistics » Fisheries and agriculture » Catch and value of catch". Statistics Iceland. Retrieved 2012-02-20.
- ↑ Adam Gopnik. "The Coffee of Civilization in Iceland". The New Yorker (April 16, 2015). Retrieved April 16, 2015.
Miracle of the Mackerel. At the beginning of the twenty-first century, schools of mackerel, hugely profitable for the fishing industry, suddenly became abundant in Icelandic fishing waters.
- 1 2 3 4 "The World Factbook - Iceland - Economy". Central Intelligence Agency. Retrieved 2006-06-21.
- ↑ "Country Commercial Guide - Iceland". United States Commercial Service. Archived from the original on 2006-06-15. Retrieved 2006-06-21.
- ↑ "Notes and Coin". Central Bank of Iceland. Retrieved 2006-06-21.
- ↑ "The Economy of Iceland". The Central Bank of Iceland. p. 9. Retrieved 2006-06-22.
- ↑ Republic of Iceland Cut To FC 'A+/A-1', LC 'AA/A-1+' On Unbalanced Policy Mix; Outlook Stable. Press release No. 48, 22 December 2006.
- ↑ "Vanishing vigilantes". The Economist. 2007-07-19.
- ↑ Iceland scowls at UK after crisis, BBC, December 16, 2008.
- ↑ Iceland set to vote on debt repayment after talks fail, BBC, March 5, 2010.
External links
| Wikimedia Commons has media related to Economy of Iceland. |
- OECD's Iceland country Web site
- OECD Economic Survey of Iceland
- Icelandic Bureau of Statistics
- Iceland Stock Exchange (ICEX)
- Icelandic Energy Portal
- Integrated financial services in Iceland
- Iceland Country Exports Profile
- Exploding Range Rovers Tell Iceland's Story NPR, March 19, 2009
- Wall Street on the Tundra by Michael Lewis, Vanity Fair, April 2009 issue
Iceland articles | ||||||||
|---|---|---|---|---|---|---|---|---|
| History |
|  | ||||||
| Geography | ||||||||
| Politics | ||||||||
| Economy | ||||||||
| Society |
| |||||||
| ||||||||
Members of the European Free Trade Association (EFTA) | |
|---|---|