Earned value management
Earned value management (EVM), or Earned value project/performance management (EVPM) is a project management technique for measuring project performance and progress in an objective manner.
Overview
Earned value management is a project management technique for measuring project performance and progress. It has the ability to combine measurements of the project management triangle:
- Scope
- Time
- Costs
In a single integrated system, Earned Value Management is able to provide accurate forecasts of project performance problems, which is an important contribution for project management.
Early EVM research showed that the areas of planning and control are significantly impacted by its use; and similarly, using the methodology improves both scope definition as well as the analysis of overall project performance. More recent research studies have shown that the principles of EVM are positive predictors of project success.[1] Popularity of EVM has grown in recent years beyond government contracting, a sector in which its importance continues to rise[2] (e.g., recent new DFARS rules[3]), in part because EVM can also surface in and help substantiate contract disputes.[4]
Essential features of any EVM implementation include
- a project plan that identifies work to be accomplished,
- a valuation of planned work, called Planned Value (PV) or Budgeted Cost of Work Scheduled (BCWS), and
- pre-defined “earning rules” (also called metrics) to quantify the accomplishment of work, called Earned Value (EV) or Budgeted Cost of Work Performed (BCWP).
EVM implementations for large or complex projects include many more features, such as indicators and forecasts of cost performance (over budget or under budget) and schedule performance (behind schedule or ahead of schedule). However, the most basic requirement of an EVM system is that it quantifies progress using PV and EV.
Application example
Project A has been approved for a duration of 1 year and with the budget of X. It was also planned that the project spends 50% of the approved budget in the first 6 months. If now 6 months after the start of the project a Project Manager would report that he has spent 50% of the budget, one can initially think, that the project is perfectly on plan. However, in reality the provided information is not sufficient to come to such a conclusion. The project can spend 50% of the budget, whilst finishing only 25% of the work, which would mean the project is not doing well; or the project can spend 50% of the budget, whilst completing 75% of the work, which would mean that project is doing better than planned. EVM is meant to address such and similar issues.
History
EVM emerged[5] as a financial analysis specialty in United States Government programs in the 1960s, but it has since become a significant branch of project management and cost engineering. Project management research investigating the contribution of EVM to project success suggests a moderately strong positive relationship.[6] Implementations of EVM can be scaled to fit projects of all sizes and complexities.
The genesis of EVM occurred in industrial manufacturing at the turn of the 20th century, based largely on the principle of "earned time" popularized by Frank and Lillian Gilbreth, but the concept took root in the United States Department of Defense in the 1960s. The original concept was called PERT/COST, but it was considered overly burdensome (not very adaptable) by contractors who were mandated to use it, and many variations of it began to proliferate among various procurement programs. In 1967, the DoD established a criterion-based approach, using a set of 35 criteria, called the Cost/Schedule Control Systems Criteria (C/SCSC). In the 1970s and early 1980s, a subculture of C/SCSC analysis grew, but the technique was often ignored or even actively resisted by project managers in both government and industry. C/SCSC was often considered a financial control tool that could be delegated to analytical specialists.
In 1979, EVM was introduced to the architecture and engineering industry in a "Public Works Magazine" article by David Burstein, a project manager with a national engineering firm. This technique has been taught ever since as part of the project management training program presented by PSMJ Resources, an international training and consulting firm that specializes in the engineering and architecture industry.
In the late 1980s and early 1990s, EVM emerged as a project management methodology to be understood and used by managers and executives, not just EVM specialists. In 1989, EVM leadership was elevated to the Undersecretary of Defense for Acquisition, thus making EVM an element of program management and procurement. In 1991, Secretary of Defense Dick Cheney canceled the Navy A-12 Avenger II Program because of performance problems detected by EVM. This demonstrated conclusively that EVM mattered to secretary-level leadership. In the 1990s, many U.S. Government regulations were eliminated or streamlined. However, EVM not only survived the acquisition reform movement, but became strongly associated with the acquisition reform movement itself. Most notably, from 1995 to 1998, ownership of EVM criteria (reduced to 32) was transferred to industry by adoption of ANSI EIA 748-A standard.[7]
The use of EVM expanded beyond the U.S. Department of Defense. It was adopted by the National Aeronautics and Space Administration, United States Department of Energy and other technology-related agencies. Many industrialized nations also began to utilize EVM in their own procurement programs.
An overview of EVM was included in the Project Management Institute's first PMBOK Guide in 1987 and was expanded in subsequent editions. In the most recent edition of the PMBOK guide, EVM is listed among the general tools and techniques for processes to control project costs.[8]
The construction industry was an early commercial adopter of EVM. Closer integration of EVM with the practice of project management accelerated in the 1990s. In 1999, the Performance Management Association merged with the Project Management Institute (PMI) to become PMI’s first college, the College of Performance Management. The United States Office of Management and Budget began to mandate the use of EVM across all government agencies, and, for the first time, for certain internally managed projects (not just for contractors). EVM also received greater attention by publicly traded companies in response to the Sarbanes-Oxley Act of 2002.
In Australia EVM has been codified as standards AS 4817-2003 and AS 4817-2006.
Earned value management topics
Project tracking


It is helpful to see an example of project tracking that does not include earned value performance management. Consider a project that has been planned in detail, including a time-phased spend plan for all elements of work. Figure 1 shows the cumulative budget (cost) for this project as a function of time (the blue line, labeled PV). It also shows the cumulative actual cost of the project (red line, labeled AC) through week 8. To those unfamiliar with EVM, it might appear that this project was over budget through week 4 and then under budget from week 6 through week 8. However, what is missing from this chart is any understanding of how much work has been accomplished during the project. If the project was actually completed at week 8, then the project would actually be well under budget and well ahead of schedule. If, on the other hand, the project is only 10% complete at week 8, the project is significantly over budget and behind schedule. A method is needed to measure technical performance objectively and quantitatively, and that is what EVM accomplishes.
Project tracking with EVM
Consider the same project, except this time the project plan includes pre-defined methods of quantifying the accomplishment of work. At the end of each week, the project manager identifies every detailed element of work that has been completed, and sums the EV for each of these completed elements. Earned value may be accumulated monthly, weekly, or as progress is made.
Earned value (EV)

Figure 2 shows the EV curve (in green) along with the PV curve from Figure 1. The chart indicates that technical performance (i.e., progress) started more rapidly than planned, but slowed significantly and fell behind schedule at week 7 and 8. This chart illustrates the schedule performance aspect of EVM. It is complementary to critical path or critical chain schedule management.
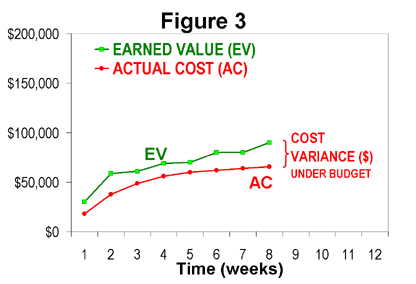
Figure 3 shows the same EV curve (green) with the actual cost data from Figure 1 (in red). It can be seen that the project was actually under budget, relative to the amount of work accomplished, since the start of the project. This is a much better conclusion than might be derived from Figure 1.
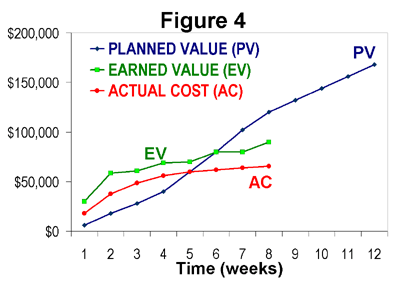
Figure 4 shows all three curves together – which is a typical EVM line chart. The best way to read these three-line charts is to identify the EV curve first, then compare it to PV (for schedule performance) and AC (for cost performance). It can be seen from this illustration that a true understanding of cost performance and schedule performance relies first on measuring technical performance objectively. This is the foundational principle of EVM.
Scaling EVM from simple to advanced implementations
The foundational principle of EVM, mentioned above, does not depend on the size or complexity of the project. However, the implementations of EVM can vary significantly depending on the circumstances. In many cases, organizations establish an all-or-nothing threshold; projects above the threshold require a full-featured (complex) EVM system and projects below the threshold are exempted. Another approach that is gaining favor is to scale EVM implementation according to the project at hand and skill level of the project team. [9] [10]
Simple implementations (emphasizing only technical performance)
There are many more small and simple projects than there are large and complex ones, yet historically only the largest and most complex have enjoyed the benefits of EVM. Still, lightweight implementations of EVM are achievable by any person who has basic spreadsheet skills. In fact, spreadsheet implementations are an excellent way to learn basic EVM skills.
The first step is to define the work. This is typically done in a hierarchical arrangement called a work breakdown structure (WBS) although the simplest projects may use a simple list of tasks. In either case, it is important that the WBS or list be comprehensive. It is also important that the elements be mutually exclusive, so that work is easily categorized in one and only one element of work. The most detailed elements of a WBS hierarchy (or the items in a list) are called activities (or tasks).
The second step is to assign a value, called planned value (PV), to each activity. For large projects, PV is almost always an allocation of the total project budget, and may be in units of currency (e.g., dollars or euros) or in labor hours, or both. However, in very simple projects, each activity may be assigned a weighted “point value" which might not be a budget number. Assigning weighted values and achieving consensus on all PV quantities yields an important benefit of EVM, because it exposes misunderstandings and miscommunications about the scope of the project, and resolving these differences should always occur as early as possible. Some terminal elements can not be known (planned) in great detail in advance, and that is expected, because they can be further refined at a later time.
The third step is to define “earning rules” for each activity. The simplest method is to apply just one earning rule, such as the 0/100 rule, to all activities. Using the 0/100 rule, no credit is earned for an element of work until it is finished. A related rule is called the 50/50 rule, which means 50% credit is earned when an element of work is started, and the remaining 50% is earned upon completion. Other fixed earning rules such as a 25/75 rule or 20/80 rule are gaining favor, because they assign more weight to finishing work than for starting it, but they also motivate the project team to identify when an element of work is started, which can improve awareness of work-in-progress. These simple earning rules work well for small or simple projects because generally each activity tends to be fairly short in duration.
These initial three steps define the minimal amount of planning for simplified EVM. The final step is to execute the project according to the plan and measure progress. When activities are started or finished, EV is accumulated according to the earning rule. This is typically done at regular intervals (e.g., weekly or monthly), but there is no reason why EV cannot be accumulated in near real-time, when work elements are started/completed. In fact, waiting to update EV only once per month (simply because that is when cost data are available) only detracts from a primary benefit of using EVM, which is to create a technical performance scoreboard for the project team.

In a lightweight implementation such as described here, the project manager has not accumulated cost nor defined a detailed project schedule network (i.e., using a critical path or critical chain methodology). While such omissions are inappropriate for managing large projects, they are a common and reasonable occurrence in many very small or simple projects. Any project can benefit from using EV alone as a real-time score of progress. One useful result of this very simple approach (without schedule models and actual cost accumulation) is to compare EV curves of similar projects, as illustrated in Figure 5. In this example, the progress of three residential construction projects are compared by aligning the starting dates. If these three home construction projects were measured with the same PV valuations, the relative schedule performance of the projects can be easily compared.
Intermediate implementations (integrating technical and schedule performance)
In many projects, schedule performance (completing the work on time) is equal in importance to technical performance. For example, some new product development projects place a high premium on finishing quickly. It is not that cost is unimportant, but finishing the work later than a competitor may cost a great deal more in lost market share. It is likely that these kinds of projects will not use the lightweight version of EVM described in the previous section, because there is no planned timescale for measuring schedule performance. A second layer of EVM skill can be very helpful in managing the schedule performance of these “intermediate” projects. The project manager may employ a critical path or critical chain to build a project schedule model. As in the lightweight implementation, the project manager must define the work comprehensively, typically in a WBS hierarchy. He/she will construct a project schedule model that describes the precedence links between elements of work. This schedule model can then be used to develop the PV curve (or baseline), as shown in Figure 2.
It should be noted that measuring schedule performance using EVM does not replace the need to understand schedule performance versus the project's schedule model (precedence network). However, EVM schedule performance, as illustrated in Figure 2 provides an additional indicator — one that can be communicated in a single chart. Although it is theoretically possible that detailed schedule analysis will yield different conclusions than broad schedule analysis, in practice there tends to be a high correlation between the two. Although EVM schedule measurements are not necessarily conclusive, they provide useful diagnostic information.
Although such intermediate implementations do not require units of currency (e.g., dollars), it is common practice to use budgeted dollars as the scale for PV and EV. It is also common practice to track labor hours in parallel with currency. The following EVM formulas are for schedule management, and do not require accumulation of actual cost (AC). This is important because it is common in small and intermediate size projects for true costs to be unknown or unavailable.
- Schedule variance (SV)

- SV greater than 0 is good (ahead of schedule). The SV will be 0 at project completion because then all of the planned values will have been earned.
However, Schedule Variance (SV) measured through EVM method is indicative only. To know whether a project is really behind or ahead of schedule (on time completion), Project Manager has to perform critical path analysis based on precedence and inter-dependencies of the project activities.
- Schedule performance index (SPI)

- SPI greater than 1 is good/favourable (ahead of schedule).
Making earned value schedule metrics concordant with the CPM schedule
The actual critical path is ultimately the determining factor of every project's duration. Because earned value schedule metrics take no account of critical path data, big budget activities that are not on the critical path have the potential to dwarf the impact of performing small budget critical path activities. This can lead to "gaming" the SV and SPI metrics by ignoring critical path activities in favor of big budget activities that may have lots of float. This can sometimes even lead to performing activities out-of-sequence just to improve the schedule tracking metrics, which can cause major problems with quality.
A simple two-step process has been suggested to fix this:
1. Create a second earned value baseline strictly for schedule, with the weighted activities/milestones on the as-late-as-possible dates of the backward pass of the critical path algorithm, where there is no float.
2. Allow earned value credit for schedule metrics to be taken no earlier than the reporting period during which the activity is scheduled unless it is on the project's current critical path.
In this way, the distorting aspect of float would be eliminated. There would be no benefit to performing a non-critical activity with lots of float until it is due in proper sequence. Also, an activity would not generate a negative schedule variance until it had used up its float. Under this method, one way of gaming the schedule metrics would be eliminated. The only way of generating a positive schedule variance (or SPI over 1.0) would be by completing work on the current critical path ahead of schedule, which is in fact the only way for a project to get ahead of schedule. [11]
- See also earned schedule for a description of known limitations in SV and SPI formulas and an emerging practice for correcting these limitations.
Advanced implementations (integrating cost, schedule and technical performance)
In addition to managing technical and schedule performance, large and complex projects require that cost performance be monitored and reviewed at regular intervals. To measure cost performance, planned value (or BCWS - Budgeted Cost of Work Scheduled) and earned value (or BCWP - Budgeted Cost of Work Performed) must be in units of currency (the same units that actual costs are measured.) In large implementations, the planned value curve is commonly called a Performance Measurement Baseline (PMB) and may be arranged in control accounts, summary-level planning packages, planning packages and work packages. In large projects, establishing control accounts is the primary method of delegating responsibility and authority to various parts of the performing organization. Control accounts are cells of a responsibility assignment (RACI) matrix, which is the intersection of the project WBS and the organizational breakdown structure (OBS). Control accounts are assigned to Control Account Managers (CAMs). Large projects require more elaborate processes for controlling baseline revisions, more thorough integration with subcontractor EVM systems, and more elaborate management of procured materials.
In the United States, the primary standard for full-featured EVM systems is the ANSI/EIA-748A standard, published in May 1998 and reaffirmed in August 2002. The standard defines 32 criteria for full-featured EVM system compliance. As of the year 2007, a draft of ANSI/EIA-748B, a revision to the original is available from ANSI. Other countries have established similar standards.
In addition to using BCWS and BCWP, prior to 1998 implementations often use the term Actual Cost of Work Performed (ACWP) instead of AC. Additional acronyms and formulas include:
- Budget at completion (BAC): The total planned value (PV or BCWS) at the end of the project. If a project has a Management Reserve (MR), it is typically not included in the BAC, and respectively, in the Performance Measurement Baseline.
- Cost variance (CV)

- CV greater than 0 is good (under budget).
- Cost Performance Index (CPI)

- CPI greater than 1 is good/favourable (under budget):
- < 1 means that the cost of completing the work is higher than planned (bad);
- = 1 means that the cost of completing the work is right on plan (good);
- > 1 means that the cost of completing the work is less than planned (good or sometimes bad).
- Having a CPI that is very high (in some cases, very high is only 1.2) may mean that the plan was too conservative, and thus a very high number may in fact not be good, as the CPI is being measured against a poor baseline. Management or the customer may be upset with the planners as an overly conservative baseline ties up available funds for other purposes, and the baseline is also used for manpower planning.
- Estimate at completion (EAC)
- EAC is the manager's projection of total cost of the project at completion.

- This formula is based on the assumption, that the performance of the project (or rather a deviation of the actual performance from a baseline) to date gives a good indication of what a performance (or rather deviation of a performance from a baseline) will be in the future. In another words this formula is using statistics of the project to date to predict future results. Therefore it has to be used carefully, when the nature of the project in the future is likely to be different from the one to date (e.g. performance of the project compare to baseline at the design phase may not be a good indication of what it will be during a construction phase).
- Estimate to complete (ETC)
- ETC is the estimate to complete the remaining work of the project. ETC must be based on objective measures of the outstanding work remaining, typically based on the measures or estimates used to create the original planned value (PV) profile, including any adjustments to predict performance based on historical performance, actions being taken to improve performance, or acknowledgement of degraded performance.
- While algrebraically, ETC = EAC-AC is correct, ETC should NEVER be computed using either EAC or AC. In the following equation,

- ETC is the independent variable, EAC is the dependent variable, and AC is fixed based on expenditures to date. ETC should always be reported truthfully to reflect the project team estimate to complete the outstanding work. If ETC pushes EAC to exceed BAC, then project management skills are employed to either recommend performance improvements or scope change, but never force ETC to give the "correct" answer so that EAC=BAC. Managing project activities to keep the project within budget is a human factors activity, not a mathematical function.
- To-complete performance index (TCPI)
- The TCPI provides a projection of the anticipated performance required to achieve either the BAC or the EAC. TCPI indicates the future required cost efficiency needed to achieve a target BAC (Budget At Complete) or EAC (Estimate At Complete). Any significant difference between CPI, the cost performance to date, and the TCPI, the cost performance needed to meet the BAC or the EAC, should be accounted for by management in their forecast of the final cost.
- For the TCPI based on BAC (describing the performance required to meet the original BAC budgeted total):

- or for the TCPI based on EAC (describing the performance required to meet a new, revised budget total EAC):

- This implies, that if revised budget (EAC) is calculated using Earned Value methodology formula (BAC/CPI), then at the moment, when TCPI based on EAC is first time calculated, it will always be equal to CPI of a project at that moment. This happens because when EAC is calculated using formula BAC/CPI it is assumed, that cost performance of the remaining part of the project will be the same as the cost performance of the project to date.
- Independent estimate at completion (IEAC)
- The IEAC is a metric to project total cost using the performance to date to project overall performance. This can be compared to the EAC, which is the manager's projection.

Agile EVM
In complex environments like software development, an iterative and incremental or Agile approach is often used to deliver complex products more successfully. Agile EVM is used as trend burndown/burnup graphs to make forecasts of progress towards a completion date transparent. However, EVM techniques are always used for the underlying calculations.
Preparation
Setting up Agile EVM is similar to a simple implementation of EVM with the following preparation steps:
- All project work is gathered as work items (i.e. Stories or Requirements) and managed in a single ordered list (i.e. Prioritized Requirements List or Product Backlog);
- Planned Value is determined by estimating the relative size of a work item compared to other items. Story Points are used as the unit of measurement for PV and EV;
- The one, and only, earning rule is that when a work item is done then the corresponding Story Points for a work item are earned. To agree what "done" means, project teams establish and share a Definition of Done, listing all criteria a work item has to comply with before it's considered done. To mitigate project risks, no partially done work items are ever considered.
Practices

Agile EVM is now all about executing the project and tracking the accumulated EV according to the simple earning rule. Because Agile EVM has been evolving for many years the following practices are well-established:
- EV is accumulated at fixed time intervals (i.e. Timebox, Iteration or Sprint) of 1–4 weeks;
- PV and EV is graphically tracked & extrapolated as remaining value in a Release Burndown Chart as shown in figure 6;
- Rather than an S-shaped curve the PV in Agile EVM is a straight line because an Agile project has no distinct phases and corresponding variances in the rate of value delivery;
- The EV in Story Points done in one fixed time interval is known as the Velocity of a team;
- In Agile scope change is embraced and the amount of added (removed) scope in Story Points is added (removed) to the Velocity or Scope Floor. The latter is shown in Figure 6 where several scope increases have lowered the Scope Floor below the x-axis. The advantage of using a Scope Floor is that any scope changes can easily be separated from Velocity variances;
- The intersection between the Remaining Value and Scope Floor lines indicates the expected release date and the corresponding Remaining Budget.
Calculations
Agile EVM is based on transparency and therefore graphically used in various trend charts. However, all EVM formulas (CPI, SPI, EAC, etc.) can still be used in Agile EVM by expressing the input variables like EV, PV and AC as:
- Percentages of the number of planned or earned Story Points of the total number of Story Points or;
- Financials by distributing the project budget over the total number of Story Points.
Agile embraces change and therefore scope is considered variable (i.e. not fixed). Instead of using the INITIAL estimate in total number of Story Points, in Agile EVM calculations always the LATEST estimate in total number of Story Points is used to calculate CPI, SPI, EAC, etc.
Schedule Performance
The use of SPI in EVM is rather limited in forecasting schedule performance problems because it is dependent on the completion of earned value on the Critical Time Path (CTP).
Because Agile EVM is used in a complex environment, any earned value is more likely to be on the CTP. The latest estimate for the number of fixed time intervals can be calculated in Agile EVM as:
- Initial Duration in number of fixed time intervals / SPI or;
- Latest Estimate in total number of Story Points / Velocity.
Limitations
Proponents of EVM note a number of issues with implementing it[13] ,[14] and further limitations may be inherent to the concept itself.
Because EVM requires quantification of a project plan, it is often perceived to be inapplicable to discovery-driven or Agile software development projects. For example, it may be impossible to plan certain research projects far in advance, because research itself uncovers some opportunities (research paths) and actively eliminates others. However, another school of thought holds that all work can be planned, even if in weekly timeboxes or other short increments. Thus, the challenge is to create agile or discovery-driven implementations of the EVM principle, and not simply to reject the notion of measuring technical performance objectively. (See the lightweight implementation for small projects, described above). Applying EVM in fast-changing work environments is, in fact, an area of project management research.[15]
Traditional EVM is not intended for non-discrete (continuous) effort. In traditional EVM standards, non-discrete effort is called “level of effort" (LOE). If a project plan contains a significant portion of LOE, and the LOE is intermixed with discrete effort, EVM results will be contaminated.[16] This is another area of EVM research.
Traditional definitions of EVM typically assume that project accounting and project network schedule management are prerequisites to achieving any benefit from EVM. Many small projects don't satisfy either of these prerequisites, but they too can benefit from EVM, as described for simple implementations, above. Other projects can be planned with a project network, but do not have access to true and timely actual cost data. The systems that feed the data required by earned value management are usually in silos rather than interfaced and integrated.[17] In practice, the collection of true and timely actual cost data can be the most difficult aspect of EVM. Such projects can benefit from EVM, as described for intermediate implementations, above, and Earned Schedule.
As a means of overcoming objections to EVM's lack of connection to qualitative performance issues, the Naval Air Systems Command (NAVAIR) PEO(A) organization initiated a project in the late 1990s to integrate true technical achievement into EVM projections by utilizing risk profiles. These risk profiles anticipate opportunities that may be revealed and possibly be exploited as development and testing proceeds. The published research resulted in a Technical Performance Management (TPM) methodology and software application that is still used by many DoD agencies in informing EVM estimates with technical achievement.[18] The research was peer-reviewed and was the recipient of the Defense Acquisition University Acquisition Research Symposium 1997 Acker Award for excellence in the exchange of information in the field of acquisition research.
There is the difficulty inherent for any periodic monitoring of synchronizing data timing: actual deliveries, actual invoicing, and the date the EVM analysis is done are all independent, so that some items have arrived but their invoicing has not and by the time analysis is delivered the data will likely be weeks behind events. This may limit EVM to a less tactical or less definitive role where use is combined with other forms to explain why or add recent news and manage future expectations.
There is a measurement limitation for how precisely EVM can be used, stemming from classic conflict between accuracy and precision, as the mathematics can calculate deceptively far beyond the precision of the measurements of data and the approximation that is the plan estimation. The limitation on estimation is commonly understood (such as the ninety-ninety rule in software) but is not visible in any margin of error. The limitations on measurement are largely a form of digitization error as EVM measurements ultimately can be no finer than by item, which may be the Work Breakdown Structure terminal element size, to the scale of reporting period, typically end summary of a month, and by the means of delivery measure. (The delivery measure may be actual deliveries, may include estimates of partial work done at the end of month subject to estimation limits, and typically does not include QC check or risk offsets.)
See also
References
- ↑ Marshall, Robert. The Contribution of Earned Value Management to Project Success of Contracted Efforts. Journal of Contract Management, 2007, pp. 21-331.
- ↑ "KM Systems Group Announces First Annual wInsight Industry Group Conference -- "WIGCON": Earned Value Management (EVM) is an important tool for improving Department of Defense, Federal Agency, and Government Contractor Project Performance". Wall Street Journal - MarketWatch. 21 September 2011. Retrieved 15 November 2011.
- ↑ "New federal contracting rules can help or hurt, says former contracting officer". Huntsville Times. 23 September 2011. Retrieved 15 November 2011.
- ↑ "U.S. Penalizes Huntington Ingalls". Reuters. 11 November 2011. Retrieved 15 November 2011.
- ↑ See also:
- Defense Systems Management College (1997). Earned Value Management Textbook, Chapter 2. Defense Systems Management College, EVM Dept., 9820 Belvoir Road, Fort Belvoir, VA 22060-5565.
- Abba, Wayne (2000-04-01). "How Earned Value Got to Prime Time: A Short Look Back and a Glance Ahead" (PDF). PMI College of Performance Management (www.pmi-cpm.org). Retrieved 2006-10-31.
- Fleming, Quentin; Joel Koppelman (2005). Earned Value Project Management (Third ed.). Project Management Institute. ISBN 1-930699-89-1.
- ↑ Marshall, Robert A. (2006-11-09). "The contribution of earned value management to project success on contracted efforts: A quantitative statistics approach within the population of experienced practitioners" (PDF). PMI (www.pmi.org). Archived from the original (PDF) on July 22, 2011. Retrieved 2006-11-09.
- ↑ "ANSI EIA-748 Standard - Earned Value Management Systems" (PDF) (June1998 ed.). Electronic Industries Alliance. 1998.
- ↑ A Guide to the Project Management Body of Knowledge. Newtown Square, PA: Project Management Institute. 2013. pp. 217–219.
- ↑ Sumara, Jim; John Goodpasture (1997-09-29). "Earned Value -- The Next Generation -- A Practical Application for Commercial Projects" (PDF). Retrieved 2006-10-26.
- ↑ Goodpasture, John C. (2004). Quantitative Methods in Project Management. J. Ross Publishing. pp. 173–178. ISBN 1-932159-15-0.
- ↑ Devaux, Stephen A. (2014). Managing Projects as Investments: Earned Value to Business Value. CRC Press. pp. 160–171. ISBN 978-1-4822-1270-9.
- ↑ Fortuin, Chris. "Agile Compass". OrangeFortune.
- ↑ Alleman, Glen (2012-06-02). "Herding Cats : Issues with Deploying Earned Value Management". Retrieved 2013-04-04.
- ↑ Schulze, E. (2010-06-21). "How Earned Value Management is Limited". Retrieved 2013-04-04.
- ↑ Sulaiman, Tamara (2007-01-08). "AgileEVM -- Earned Value Management The Agile Way". Agile Journal. Archived from the original on February 21, 2010. Retrieved 2007-03-07.
- ↑ "The Guide". Defense Contracting Management Agency. Retrieved 2011-09-22.
- ↑ "Challenges to using Earned Value Management'". projectauditors.com.
- ↑ Pisano, Nicholas (1999). "Technical Performance Measurement, Earned Value, and Risk Management: An Integrated Diagnostic Tool for Program Management". Defense Acquisition University Acquisition Research Symposium.
Further reading
- Humphreys, Gary (2001). Project Management Using Earned Value. Humphreys and Associates. ISBN 0-9708614-0-0
- Philipson, Erik and Sven Antvik (2009). Earned Value Management - an introduction. Philipson Biz. ISBN 978-91-977394-5-0
- Project Management Institute (2005). Practice Standard for Earned Value Management. Project Management Institute. ISBN 1-930699-42-5
- Solomon, Paul and Ralph Young (2006). Performance-Based Earned Value. Wiley-IEEE Computer Society. ISBN 978-0-471-72188-8
- Stratton, Ray (2006). The Earned Value Maturity Model. Management Concepts. ISBN 1-56726-180-9
- U.S. Air Force Materiel Command (1994). "Guide to Analysis of Contractor Cost Data". AFMCPAM 65-501
- Defense Contract Management Agency (2006) "Earned Value Implementation Guide" DAU link ISBN 978-1468178289
- GAO (2009) "GAO Cost Estimating and Assessment Guide" GAO-09-SSP
External links
- EVM at NASA
- "DOE G 413.3-10, Earned Value Management System (EVMS)" (PDF). United States Department of Energy. 6 May 2008.
- U.S. Office of the Undersecretary of Defense for Acquisition, Technology and Logistics Earned Value Management website
- Measuring Integrated Progress on Agile Software Development Projects
- Monitoring Scrum Projects with AgileEVM and Earned Business Value (EBV) Metrics
- UK MoD on-line training using Flash player
- U.S. DoD DAU Acquisition Community Earned Value Management website
- U.S. Defense Contract Management Agency Guidebook
- EVM earned value management general definitions
- EVMS Surveillance Instruction, U.S. Defense Contract Management Agency
- AcqNotes Earned Value Management